
“A double materiality assessment identifies which environmental, social and governance (ESG) topics matter most, from two directions: how sustainability issues affect your company (financial materiality) and how your company affects the world (impact materiality). It’s increasingly a legal requirement (the EU’s CSRD chief among them). This guide covers the full process: what a materiality assessment is, why it’s becoming mandatory, the 7-step process, how to measure materiality with a survey (using ranking methods that avoid the flat “everything is important” results you get from rating scales), and how to turn the scores into a materiality matrix you can put in a report.”
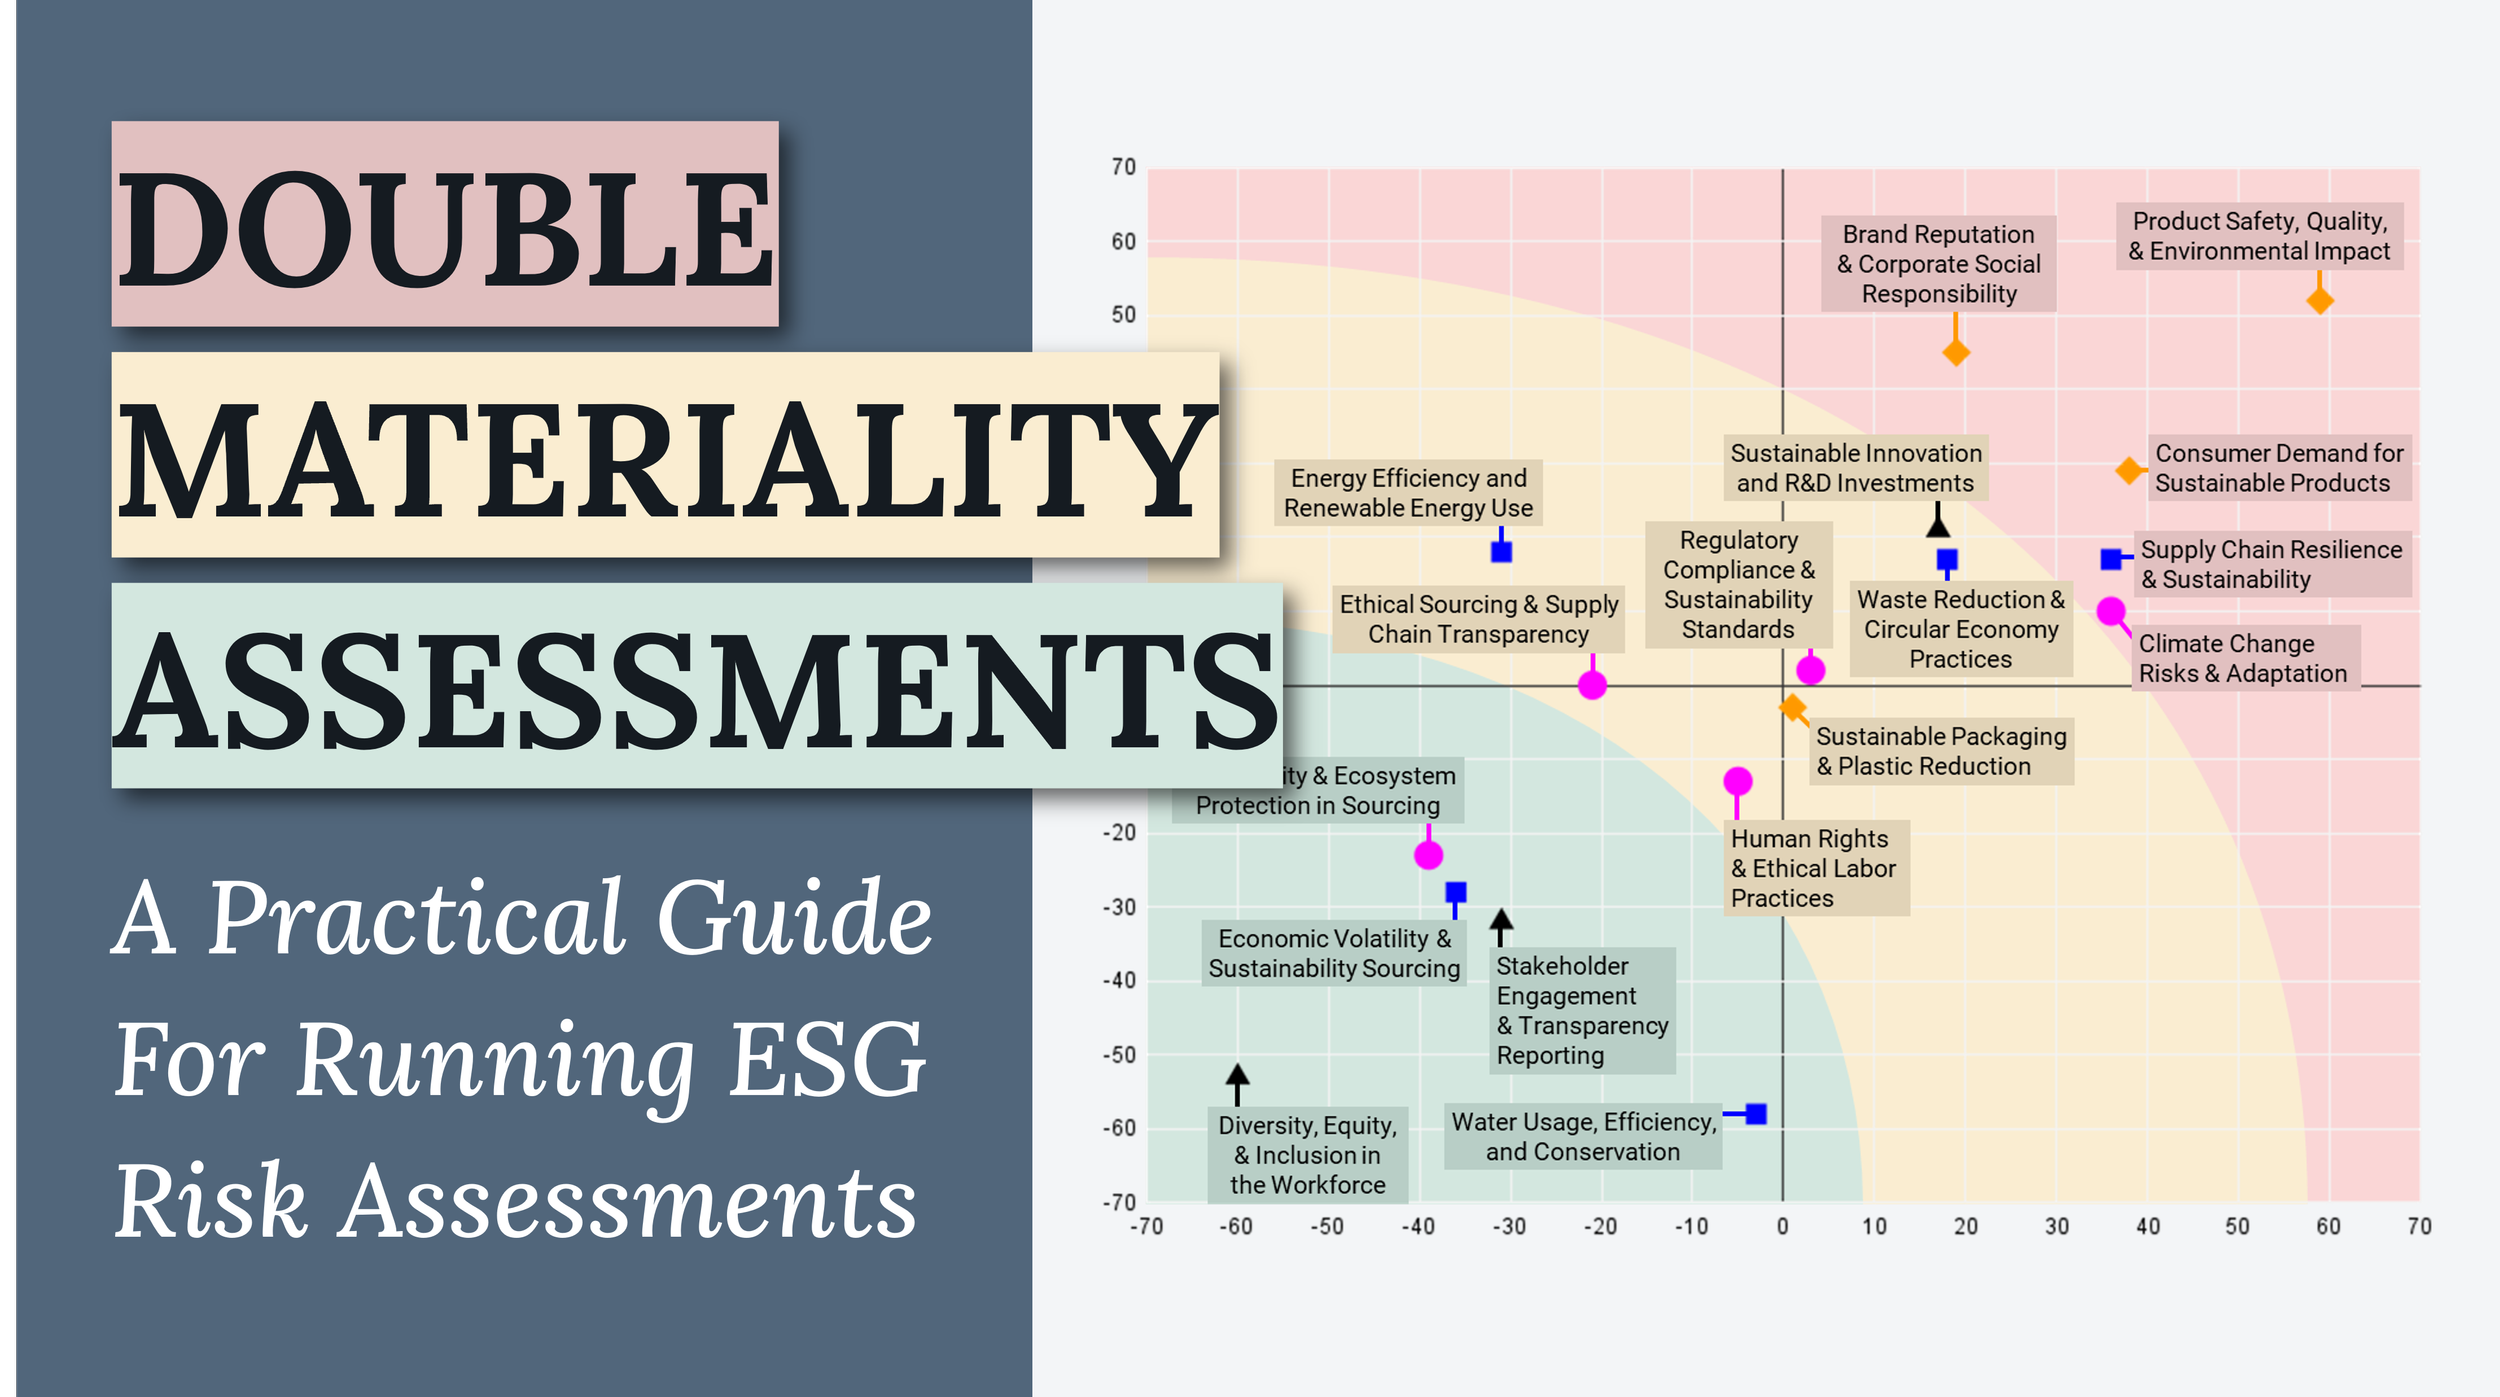
Materiality assessments are exploding in popularity, not only because of new legal requirements from 2024 onwards, but also because of the many academic studies linking materiality assessments to superior financial performance for the companies that run them.
Materiality assessments aren't hard to administer yourself. The various free guides you'll find online will try to convince you they're complex, time-consuming processes. In reality, those guides deliberately leave out any information on how to actually measure materiality, so you'll be forced to pay them >$100,000/year to run the assessments for you.
This guide is the opposite. I don't run an ESG consultancy. I've personally helped design numerous materiality assessments, I know what the "secret sauce" is, and I've got no reason not to share it. This post covers everything you need to run a materiality assessment (or a double materiality assessment, I'll explain the difference). In particular, I dive deeeeeep into two areas:
How to measure a materiality score for each of your topics → skip here
How to turn your scores into a materiality matrix scatterplot → skip here
What is a Materiality Assessment?
Materiality means something is significant enough to influence an organisation's decisions or outcomes. Traditionally, materiality focused on how much an issue or event could financially affect a company's performance or its stakeholders' decisions.
In recent years, a new type called the Double Materiality Assessment has become increasingly popular. Unlike traditional assessments that focus on financial performance, Double Materiality Assessments determine how a company's decisions affect not only its financial bottom line but also broader societal and environmental issues.
Double Materiality Assessments are a common risk-management assessment used in ESG processes. ESG, which stands for "Environmental, Social, and Governance", is a set of standards investors use to screen investments for their potential impact on the world.
Materiality assessments have been popular partly because of past studies showing that companies running them have better financial outcomes, such as a 4.6% increase in market value (MIT 2021), superior profitability (McKinsey 2020), and better market results than competitors (Harvard Business School 2015).
Materiality assessments are becoming legal requirements globally
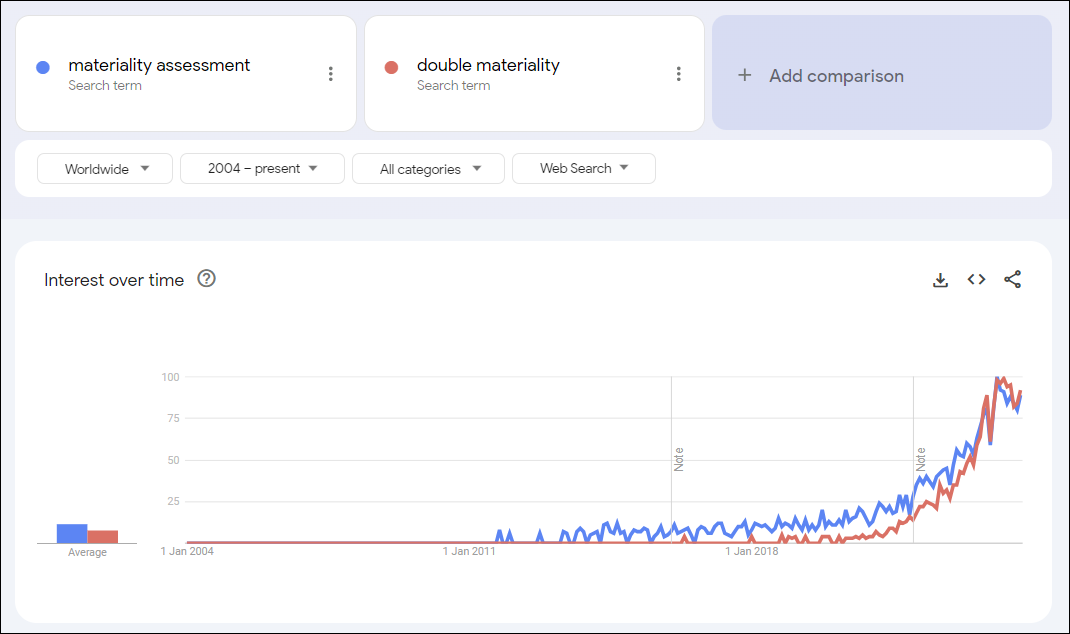
It wasn't until early 2022, when governments began writing Double Materiality Assessments into new regulations like the CSRD, that interest really began to explode.
In January 2021, the EU Commission announced the Corporate Sustainability Reporting Directive (CSRD), a regulation that begins taking effect in 2025 as part of the European Green Deal. Under CSRD, over 49,000 companies in the EU, equivalent to over 75% of all company revenue generated in the EU, are now required to run double materiality assessments covering environmental, social, and governance issues as well as financial impacts.
Companies that don't operate in the EU aren't affected by this, but materiality assessments are already commonplace elsewhere, such as the SEC's Climate Disclosure Rule in the US, which requires a traditional financial materiality assessment (this will likely expand to cover double materiality in future too).
So… how do I actually run a materiality assessment?
If you're after some not-very-light reading, the European Financial Reporting Advisory Group (EFRAG) published a 21,000-word guide to double-materiality assessments. KPMG's 5,000-word guide says nothing about how to quantify materiality, and Deloitte's guide has hilariously vague suggestions like "use AI technology to collect and evaluate stakeholder inputs", "conduct impact and financial assessment", and "validate your results". Like, woooow, thank you Deloitte, that really is everything I needed to get the job done. 🤡👍
If you're thinking of outsourcing this, be prepared for a hefty price tag: freelance ESG advisors charge $120,000 to $250,000 per materiality assessment, and it's not worth thinking about what a multinational consulting firm would quote.
The craziest part is that this isn't a one-time thing. Double Materiality Assessments are here to stay, and large companies should expect to run them annually from here on, indefinitely. The better and cheaper your process is today, the more successful you'll be at rerunning it in future.
The 7-step Double Materiality Assessment process
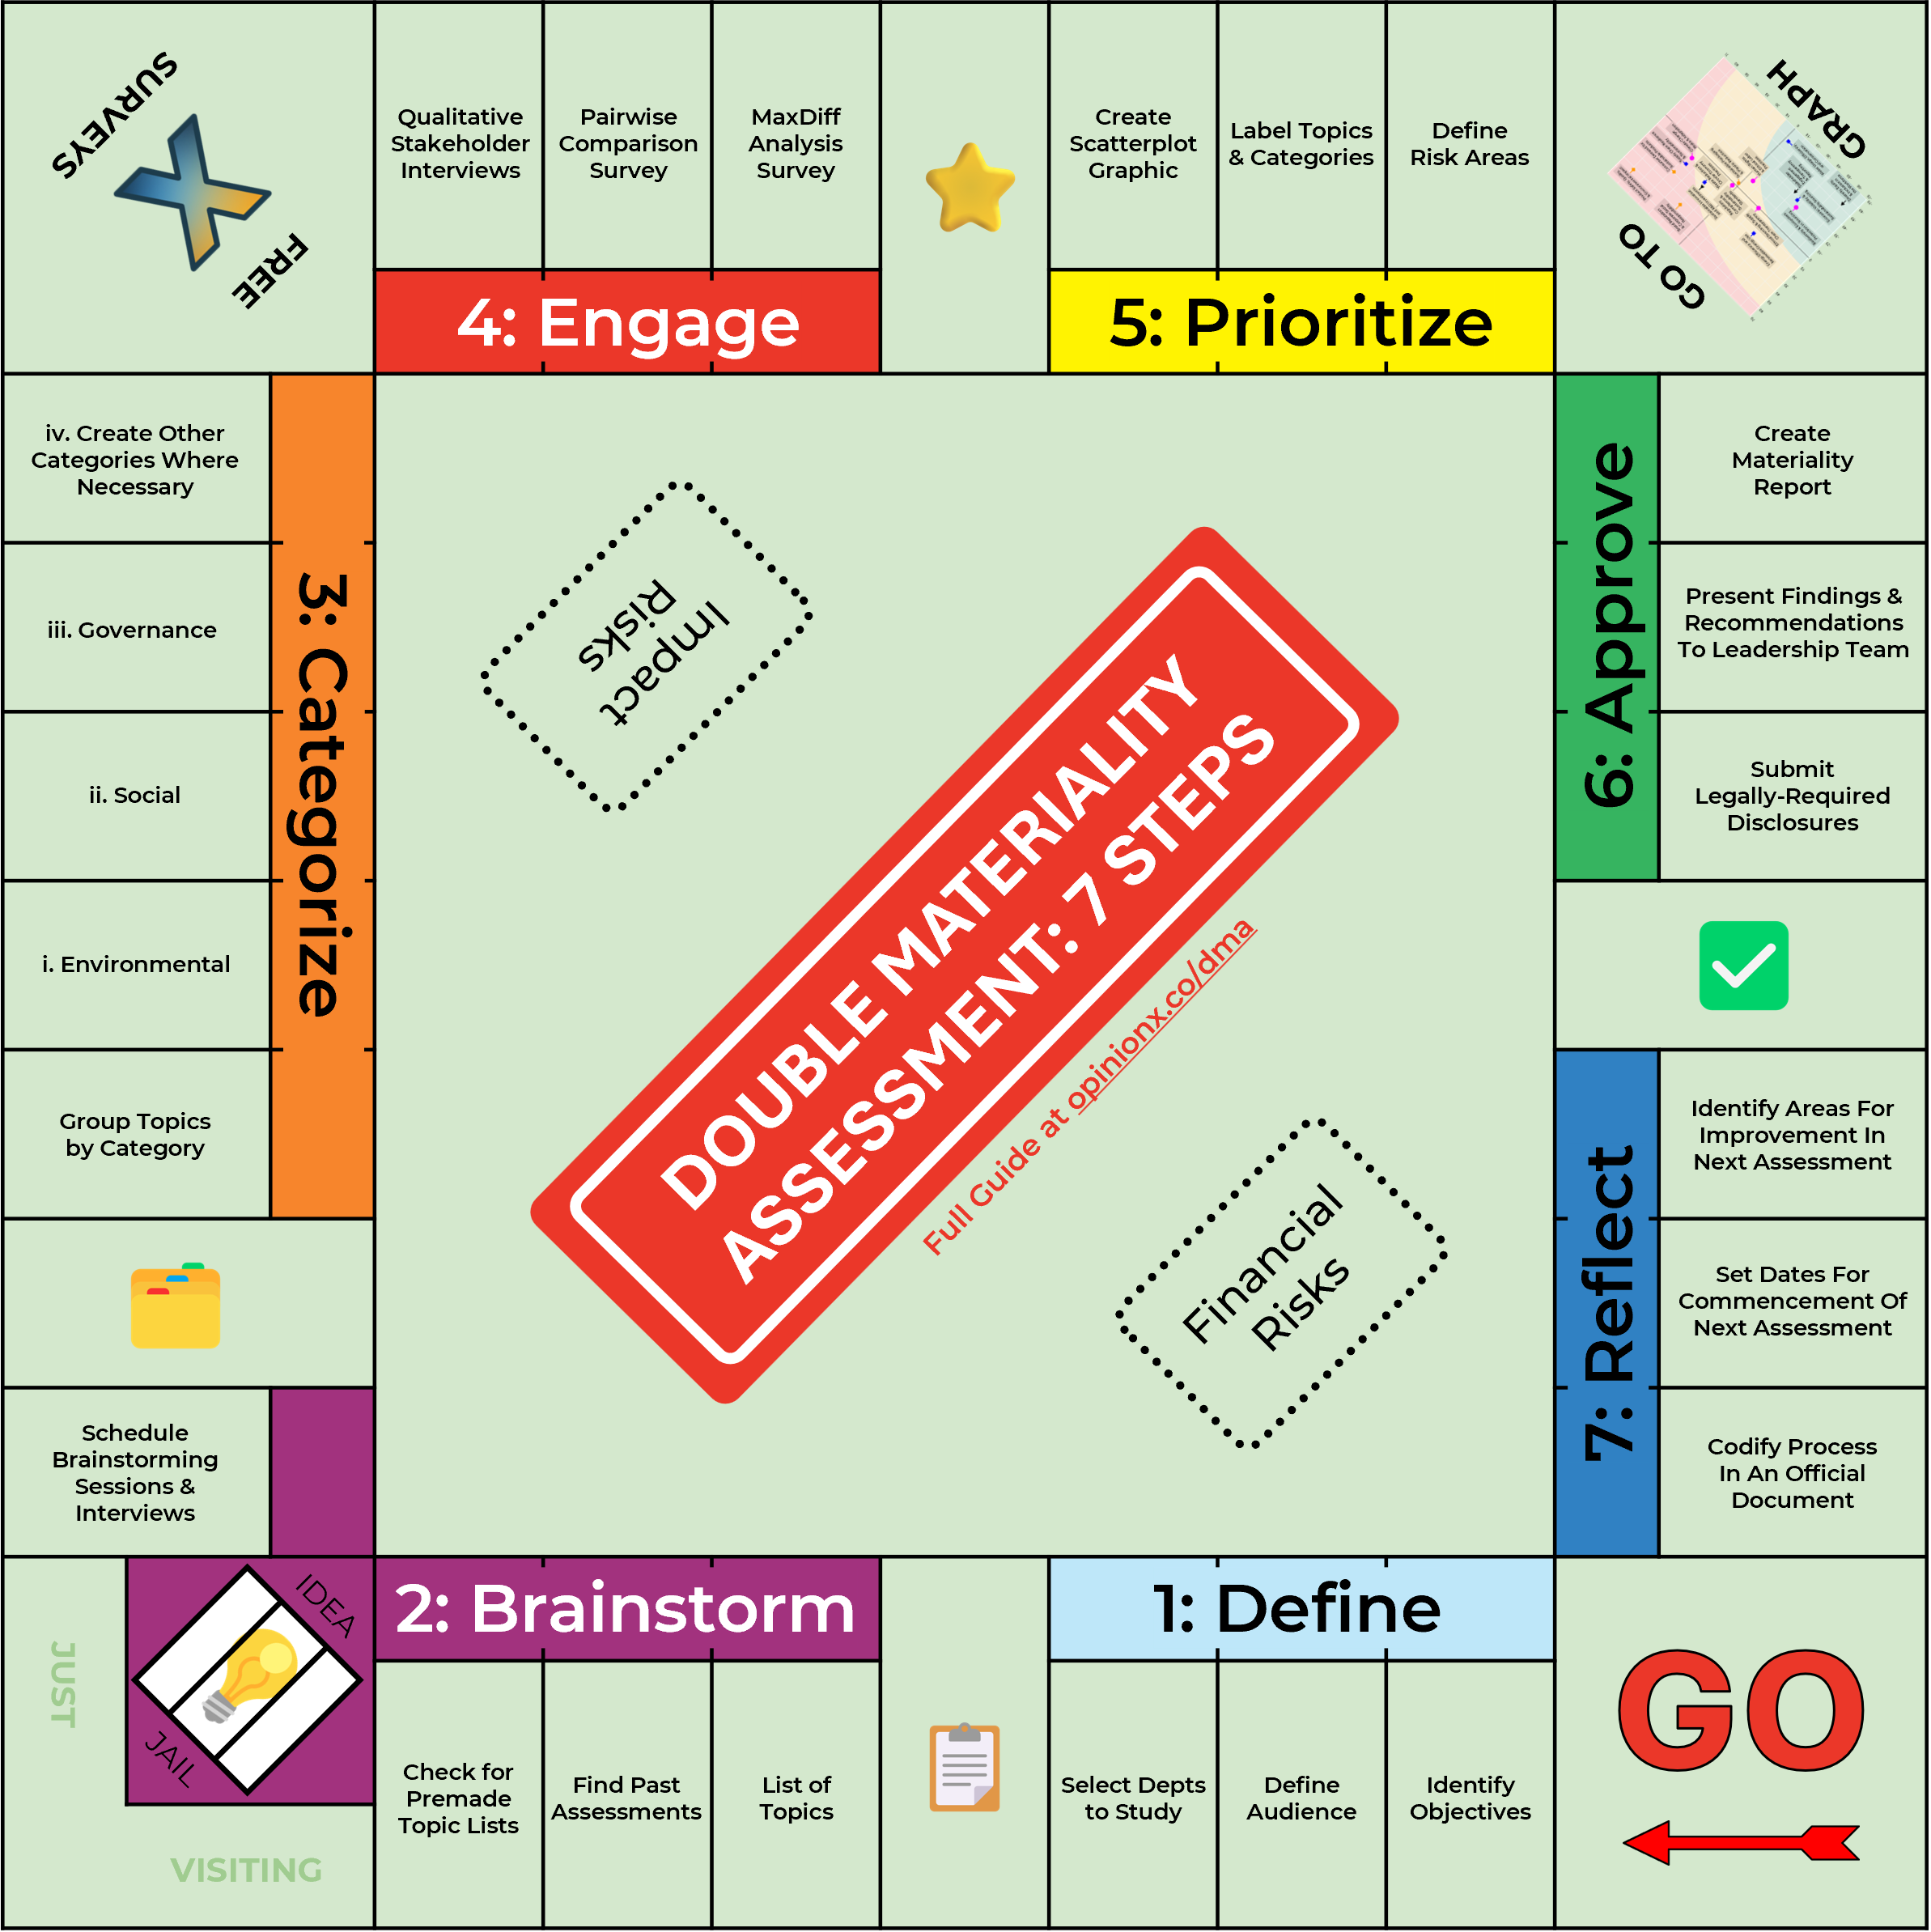
These seven steps are like an abridged version of KPMG's guide, with my own changes to make it much easier to understand and run yourself. Later in this guide I go into much more depth on steps 4 and 5, with actionable advice, specific methods and tools, and real examples. First, a quick overview of all seven.
Step 1: Define
What's the objective of running this materiality assessment? It may be mandatory due to regulations like CSRD, to refine your sustainability strategy, or to inform strategy more broadly.
Who will your assessment engage? For regulatory processes this must include a broad range of stakeholders (leadership team, employees, suppliers, and customers).
What parts of the organisation are you studying? A specific department, business unit, geographical region, or the entire organisation?
Step 2: Brainstorm
Create a list of topics that could be considered "material". ChatGPT is your friend for this step. ;)
Look for any materiality assessments your organisation ran in the past, so you can use their topic list as a starting point.
Check for public documents with sample topic lists for your industry, such as those from the International Financial Reporting Standards Foundation or the Sustainability Accounting Standards Board, or guideline documents like this one from EFRAG.
Book a brainstorming session with colleagues from various departments.
Schedule time to engage external stakeholders via one-to-one interviews or focus groups.
Step 3: Categorise
Group topics into categories of similar issues. Generally these are the three ESG themes (Environmental, Social, and Governance), but you can add categories relevant to your circumstances, such as "Innovation and Technology" or "Health and Security".
Step 4: Engage ⭐
Create a survey with comparison-based ranking methods like Pairwise Comparison or MaxDiff Analysis to measure which topics have the highest relative importance, and send it to stakeholders to collect votes.
The survey should repeat the comparison-based ranking twice: once to gather relative importance for financial materiality, then again for impact materiality.
I've written more on this, including interactive examples and specific suggestions, later in this article (skip ahead).
Step 5: Prioritise ⭐
Convert your financial and impact data into a materiality matrix, which helps you identify which topics are high importance and require mandatory disclosures. There's a step-by-step process with annotated screenshots later in this article (skip ahead).
Step 6: Approve
Bring your materiality matrix and findings report to your leadership team to secure approval for your assessment of the company's material topics and risks.
Your report should cover the main findings and suggest next steps for integrating them into the company's risk-management strategy.
Make any required disclosures and reports to legal entities under the relevant regulations, such as the EU's CSRD or the US's SEC Disclosures.
Step 7: Reflect
Distribute your report within your company, making sure the stakeholder groups you engaged receive a copy of the findings they helped create.
Evaluate the process and outcome to spot what could be improved next time.
Agree a schedule for the next assessment. Large companies that identify a significant range of high-risk topics, or organisations in sectors with rapidly changing macroeconomic variables, should run Double Materiality Assessments at least annually.
Codify the steps you took in an official document, so future assessments can benefit from your work and run at lower cost and higher efficiency in the years ahead.
Plenty of other guides online use tens of thousands of words on these seven steps, but the most neglected and under-explained parts are Step 4: Engage (how to measure the materiality or risk score for each topic) and Step 5: Prioritize (how to turn your scores into a "materiality matrix" scatterplot). I'll spend the rest of this article on those two.
How To Measure Materiality For Double Materiality Assessments
By the time you reach Step 4: Engage, you've got a list of potential topics grouped under 3-5 categories. Now it's time to take that list to stakeholders and quantify a score representing each topic's risk level, or "materiality".
Measurement methods
Most guides recommend one of two approaches for quantifying materiality topics: a high-medium-low scale or a 1-5 star rating. Both are fundamentally flawed for materiality assessments and should never be used.
Rating scales suffer from a problem called straightlining, where most participants assign the same high rating to every topic. That's especially true in materiality assessments, where every topic has already been qualified as a potential macroeconomic risk. With an overly simplistic scale, your output scores end up overly influenced by a tiny minority of participants who assigned outlier low scores.
Imagine asking a bunch of tourists to rank a list of summer holiday destinations. On a 1-5 star scale, most assign 5/5 to places like Spain, Portugal, Italy, Greece, Malta, and Croatia, making it very hard to read their real preferences. Instead, we should switch from an absolute measure (like a 1-5 scale) to a relative one, comparing topics against each other to find their relative importance.
We could show participants the same list of countries, but this time as a series of head-to-head votes: Spain -v- Portugal, Italy -v- Croatia, Portugal -v- Italy, and so on. Rather than ranking everything at once, these head-to-head pairs make subjective voting much easier to complete. Afterwards, we measure the percentage of pair votes each option wins and use that to rank them from highest to lowest relative importance.
Two comparison-based survey methods are ideally suited to Double Materiality Assessments.
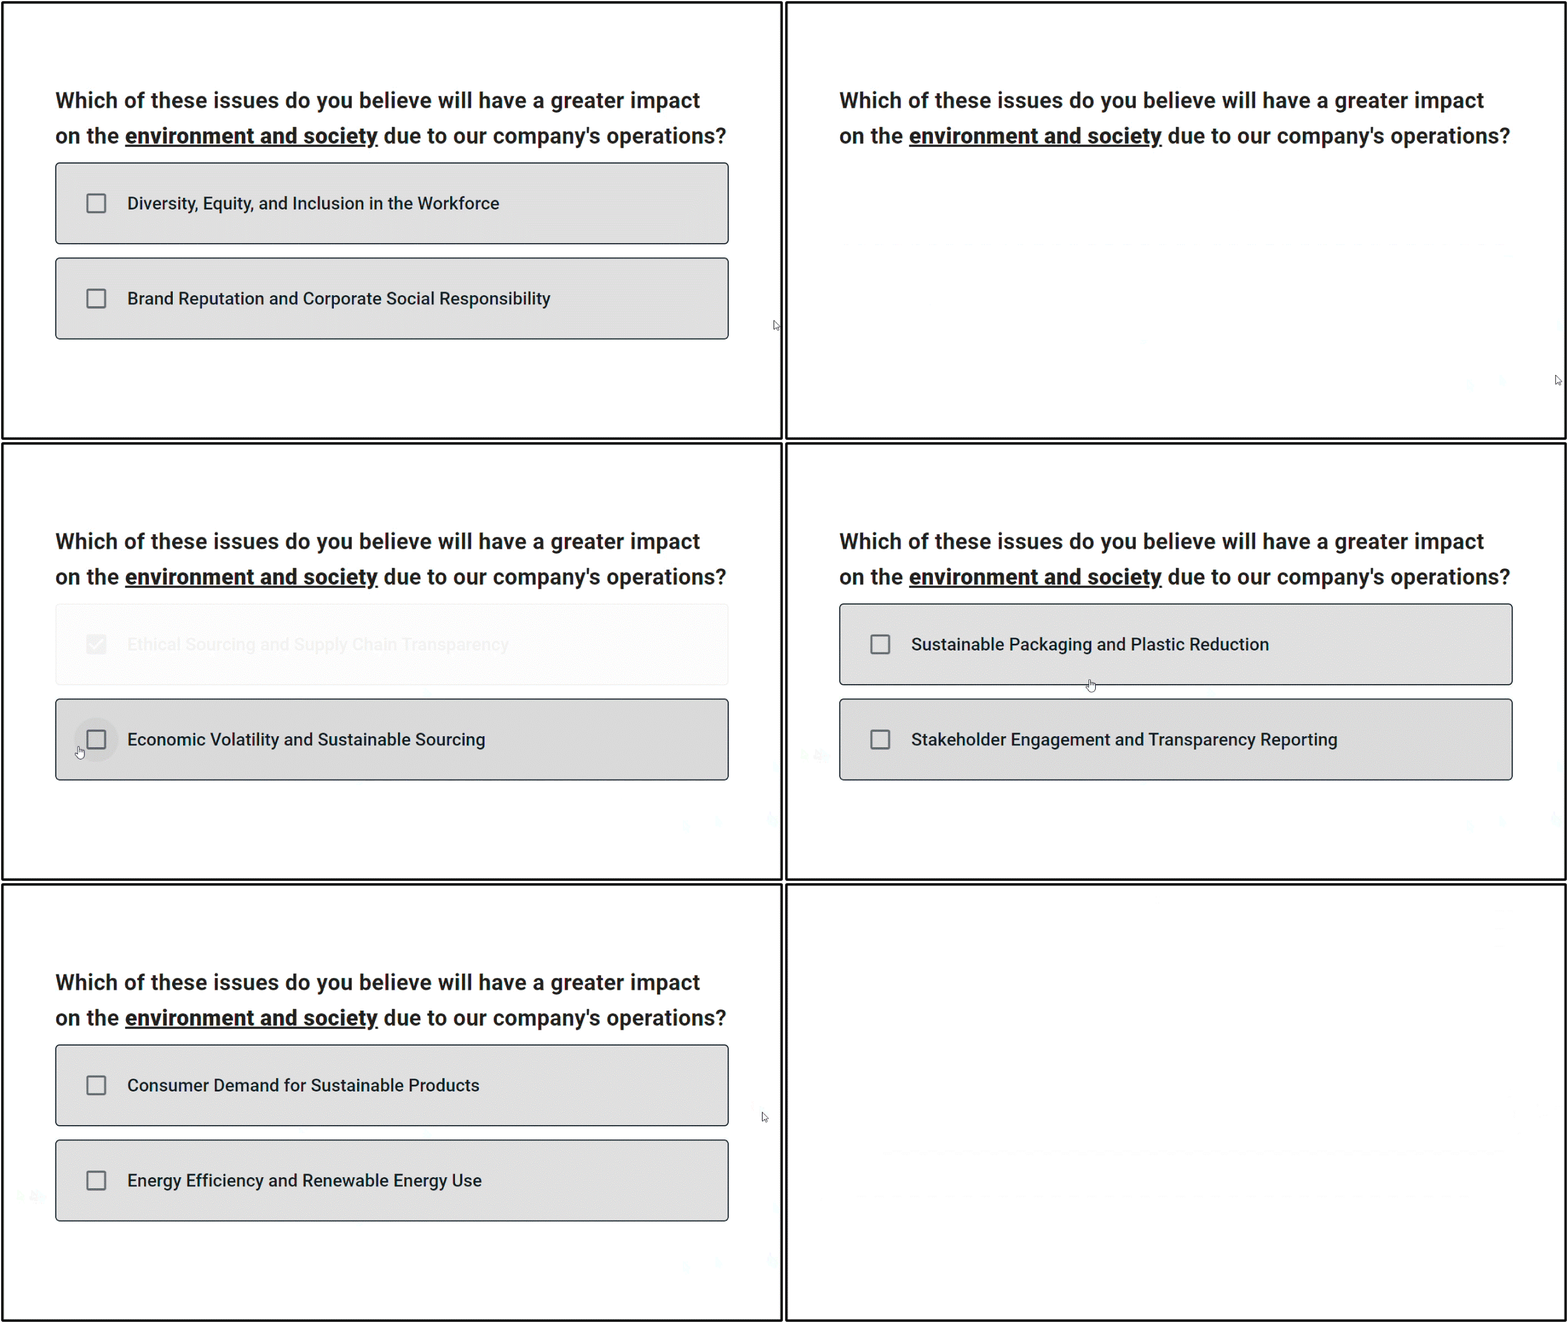
1. Pairwise Comparison. Pairwise Comparison takes your list of topics and turns it into a series of head-to-head "pair votes". Each vote asks the participant to pick the more impactful topic. Once the survey is complete, topics get a score from 0-100 representing the percentage of pair votes they won. OpinionX is a free tool for pairwise comparison surveys.
2. MaxDiff Analysis. MaxDiff Analysis is very similar, but instead of two options per vote it shows 3-6 and asks participants to identify the most and least impactful each time. Each topic gets a score from -100 to +100 using the formula (#wins - #loses) / #appearances. For example, if a topic appeared in 20 votes and was picked most impactful 14 times and least impactful 2 times, its score would be (14-2)/20 = 60. You can create MaxDiff surveys with unlimited options on OpinionX, with the free tier covering up to 25 participants per survey and larger samples on a paid plan.
Setting up a double materiality survey and want a hand with the question design and measurement method? Book a free 30-minute setup call and a research expert will walk through it with you, no cost, no obligation.
A third option that also uses forced comparison is Ranked Choice Voting, but I wouldn't recommend it for Double Materiality Assessments. Ranked Choice Voting isn't well suited to ranking lists of 10 or more options at a time, and it's particularly challenging to rank a long list of subjective options this way.
Some criteria to help you choose between Pairwise Comparison and MaxDiff Analysis:
i. Individual vs aggregate results. What level of results do you need? MaxDiff has a higher information density, since each voting set can include up to 6 topics and each vote collects both a +1 and a -1 data point. Pairwise Comparison shows only two options at a time, so it needs many more votes per person to gather the same amount of data. That makes MaxDiff ideal for more accurate rankings per individual (say, for follow-up qualitative interviews), while Pairwise Comparison is better if you're aggregating everyone's votes into overall results or grouping votes by stakeholder type.
ii. Complex vs simple options. How long are your ranking options? If they include a lot of text or long explanations, MaxDiff's 6 topics per vote is a LOT of reading and comparing for participants. In those cases, complex statements are better suited to Pairwise Comparison.
Survey design
Now that we've covered the methods for quantifying our topics, it's time to build the full survey. Whether you choose Pairwise Comparison or MaxDiff Analysis, you'll need to use the same method twice: once for Financial Materiality, then for Impact Materiality.
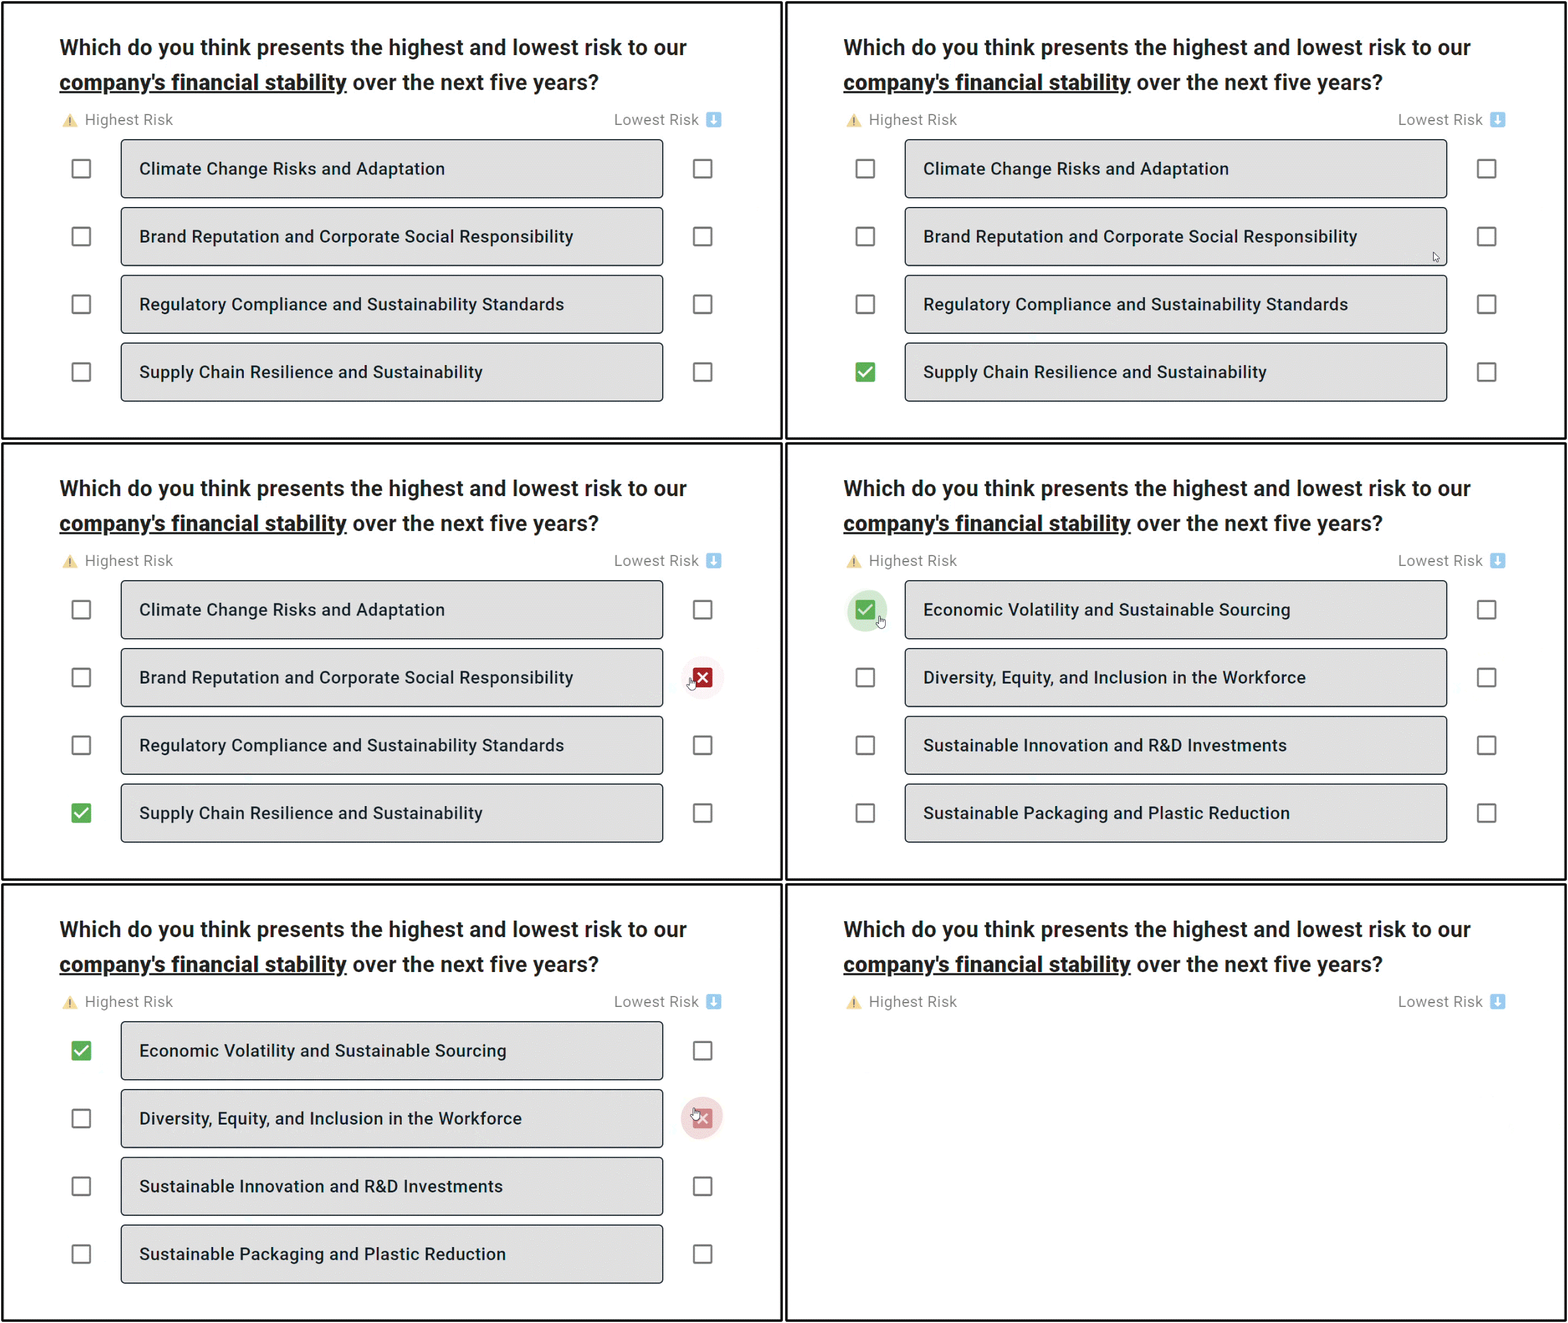
First, for Financial Materiality (how external factors could financially affect the company), some example prompts for a MaxDiff Analysis survey:
"Which of the following factors do you believe could have the most significant impact on our company's financial performance in the next three years? Please select the most and least impactful."
"From the following topics, which do you think presents the highest and lowest risk to our company's financial stability over the next five years?"
"Considering our industry and market position, which of these factors do you believe could most and least influence our financial outcomes over the next decade?"
Try it yourself with this interactive example of a maxdiff survey for measuring financial materiality:
⬆️ Created using the“Best/Worst Rank” survey format on OpinionX ⬆️
Some similar examples for Impact Materiality (how internal actions could affect external stakeholders, the environment, or society) for a Pairwise Comparison survey:
"Considering our company's influence on society and the environment, which of these two issues do you believe carries a higher responsibility for us to address?"
"Which of these issues do you believe will have a greater impact on the environment and society due to our company's operations?"
"Of the two topics below, which one do you think has a more significant impact on stakeholders and should be prioritised in our sustainability strategy?"
Try an interactive example of a pairwise comparison survey for measuring Impact Materiality:
⬆️ Created using the“Pair Rank” survey format on OpinionX ⬆️
Both question types are available for free on OpinionX surveys. When setting them up, you can use OpinionX's built-in calculator to figure out the right design variables, such as the number of votes per person needed for a reliable dataset.
Enrichment data
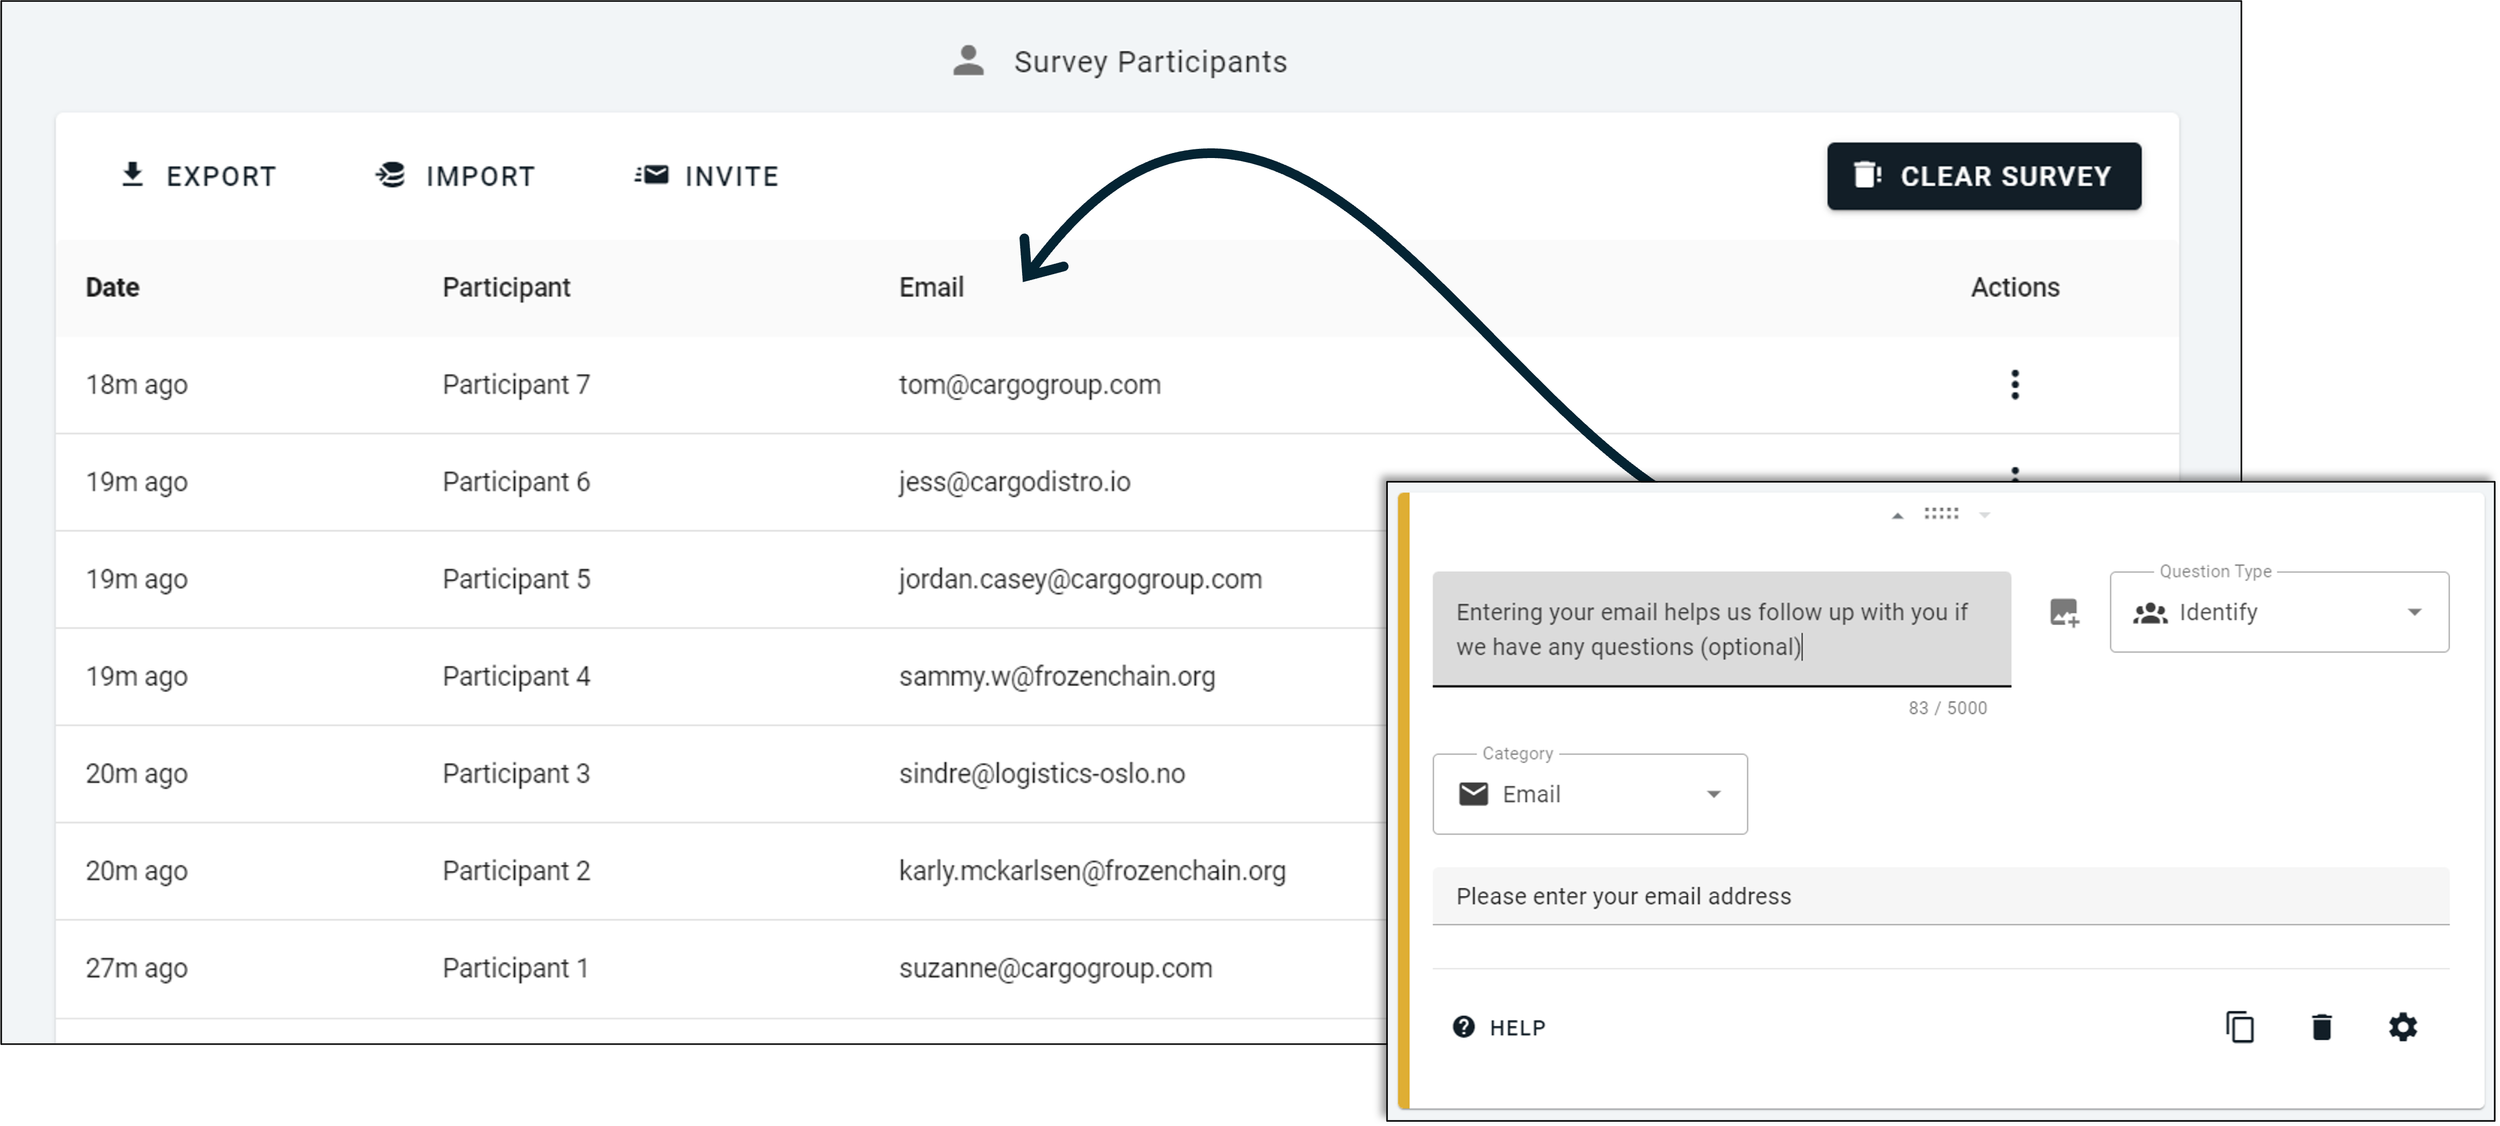
I recommend including these three questions in your Double Materiality Assessment survey, after participants have completed the maxdiff/pairwise ranking exercises.
1. Participant identifier. Collect your participant's name, email, or some other identifiable data, so you can rule out duplicates. This also lets you view someone's personal ranked results, ideal material for follow-up qualitative interviews into why they ranked the topics the way they did.
2. Demographic categories. Include some simple multiple-choice questions so participants can bucket themselves into their stakeholder group (for example by department, seniority, or region). This lets you later filter results to individual segments in isolation, or compare ranked scores between stakeholder groups.

^ Filter results by stakeholder group with just one click on OpinionX
3. Open response. You may have missed some important issues while drafting your topic list. I usually include an open-response textbox after each of the two ranking exercises, so participants can suggest additional topics that should've been in the voting list. On OpinionX, these responses can be edited and added to your voting list in two clicks.
Including these question types after your financial and impact ranking exercises gives you all the data you need to turn your results into a materiality matrix and generate data-driven risk-management suggestions from real quantitative data.
Interpreting materiality scores
Once stakeholders complete your survey, what do the results look like?

^ Screenshot from OpinionX
If you used MaxDiff Analysis, your results list each option ranked by its score, calculated with the formula (#wins - #loses) / #appearances. For pairwise comparison surveys the results are a little simpler: options ranked with a score from 0-100 representing the percentage of pair votes each won.
You can also view results for all participants at once using the Participants Tab on OpinionX, which shows everyone's results in one table, each row a participant.
Deciding what is or isn't a material issue is left to each company. There's no objective benchmark; companies develop their own thresholds and justifications. Most large companies already have defined measures for financial materiality, but if you don't, a good way to sort issues into high, medium and low risk is a Materiality Matrix scatterplot chart.
How to create a Materiality Matrix (labelled scatterplot chart)
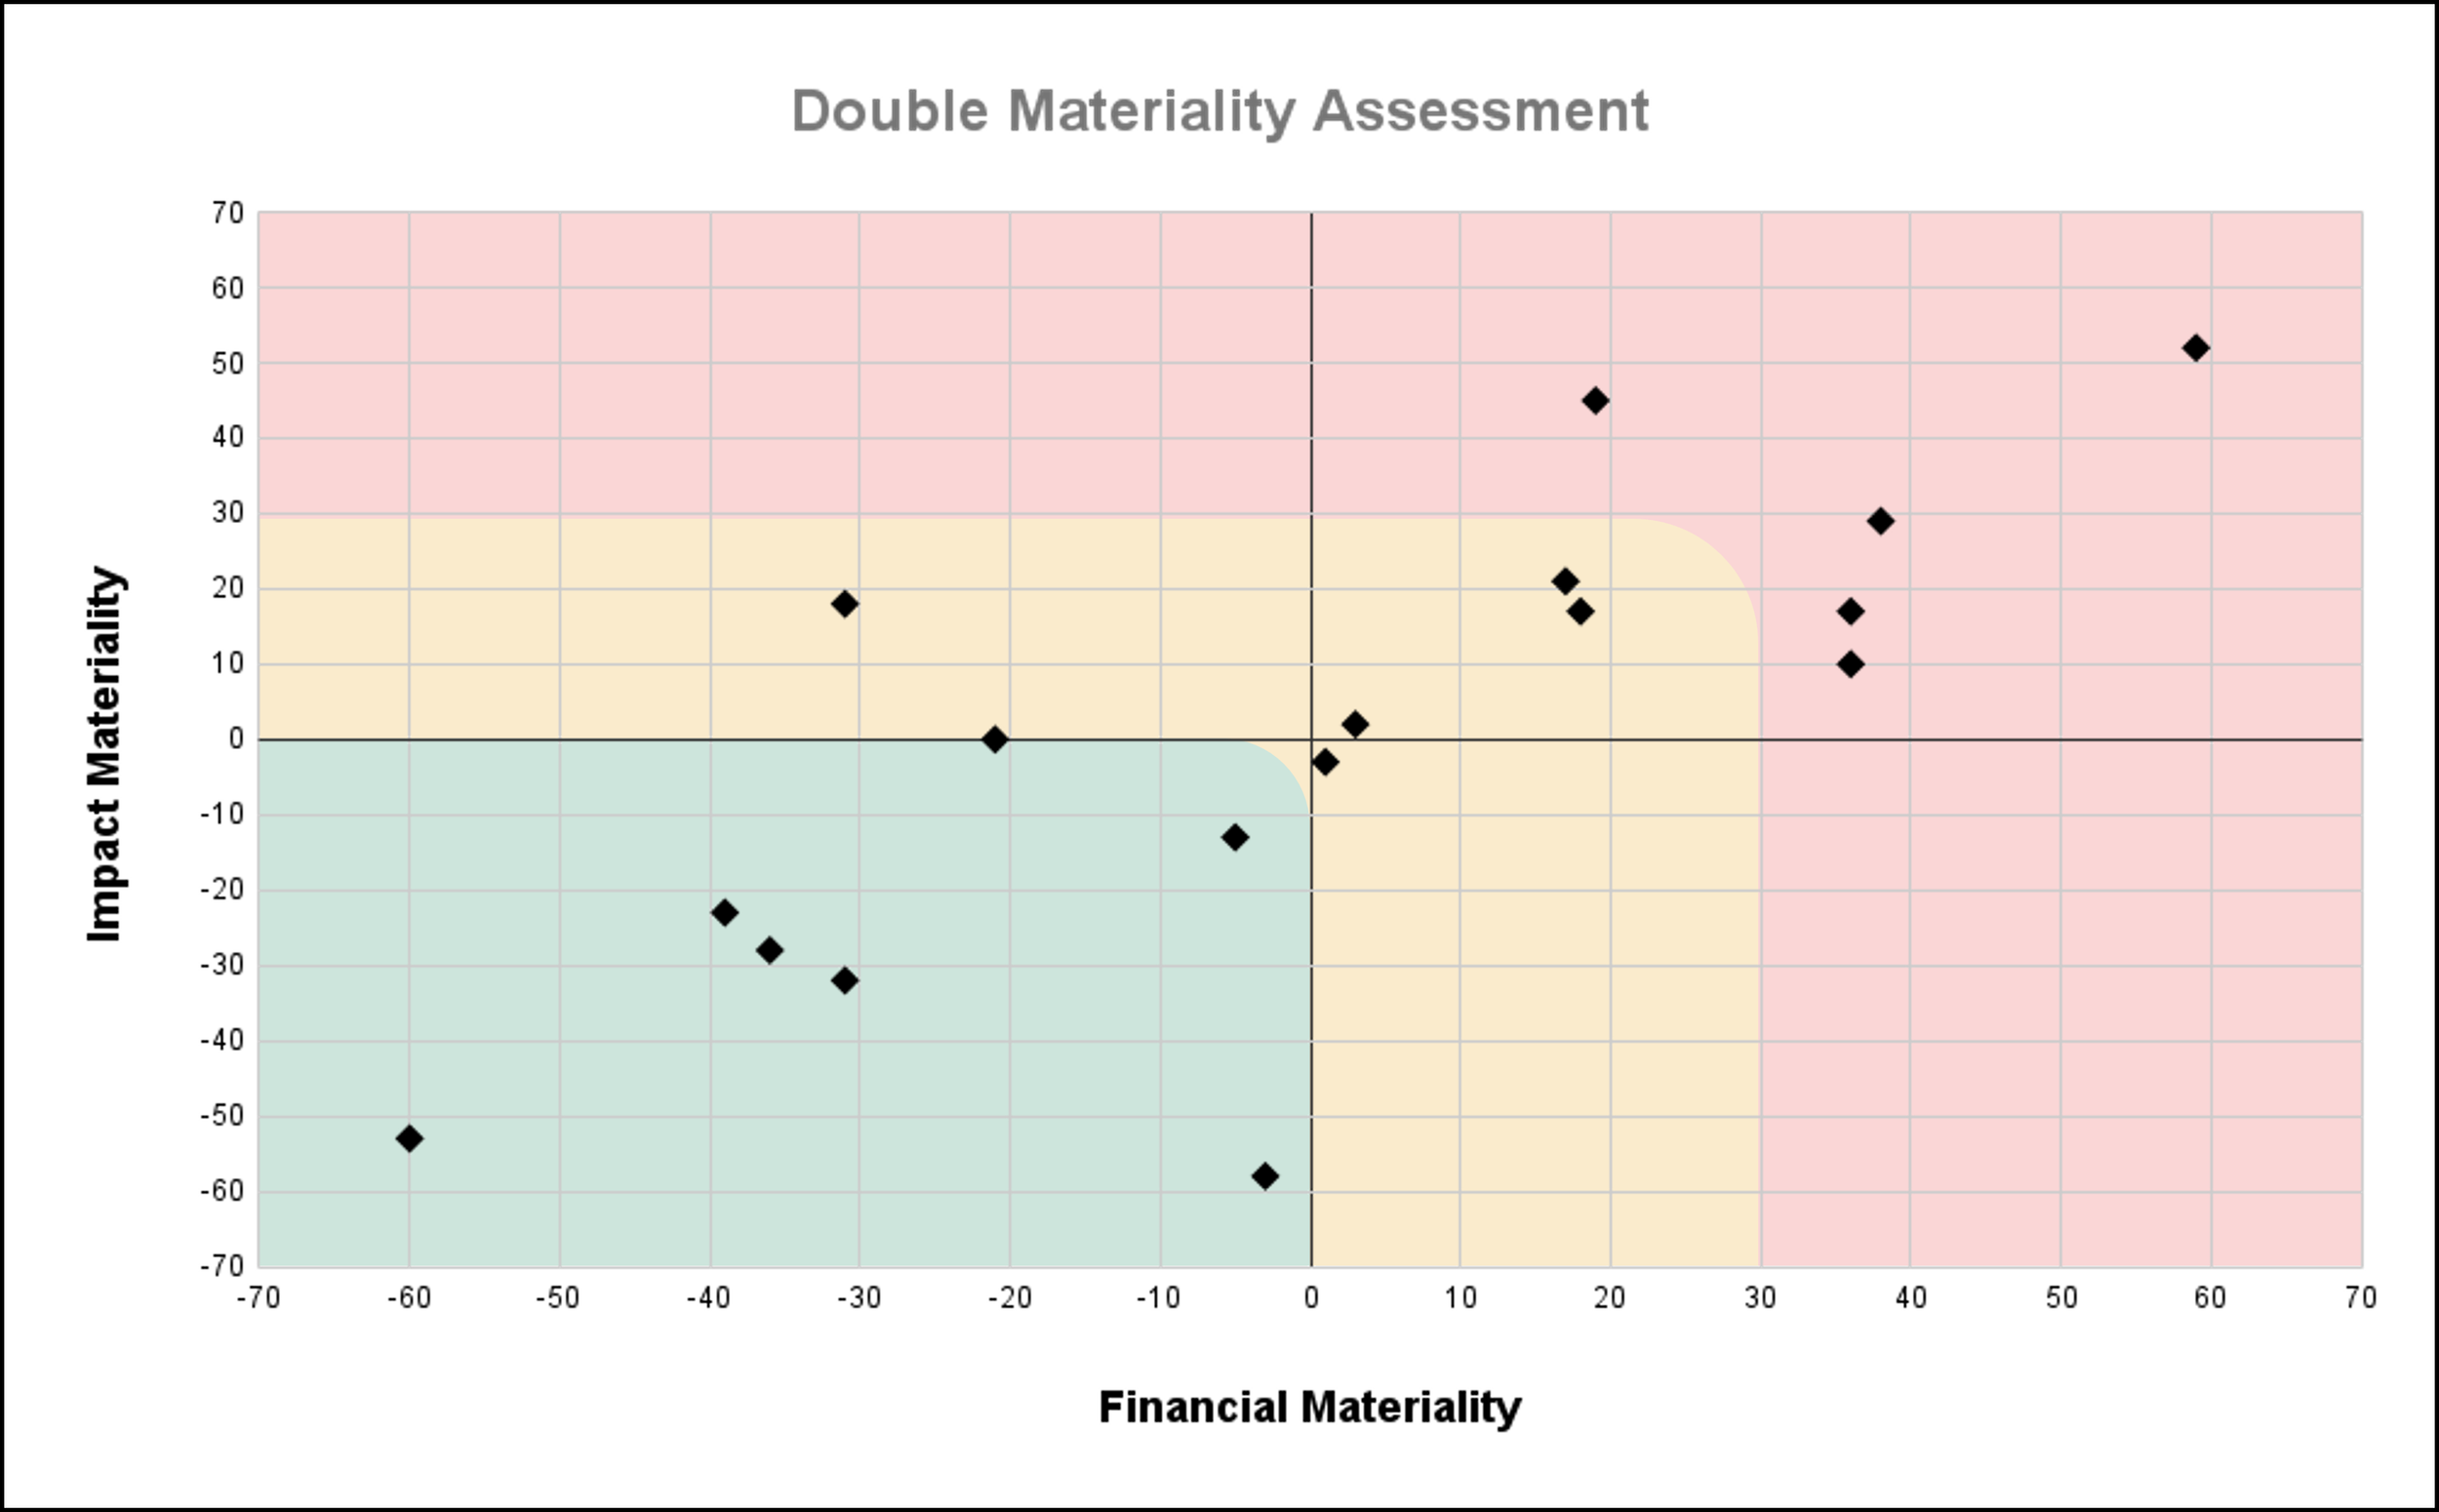
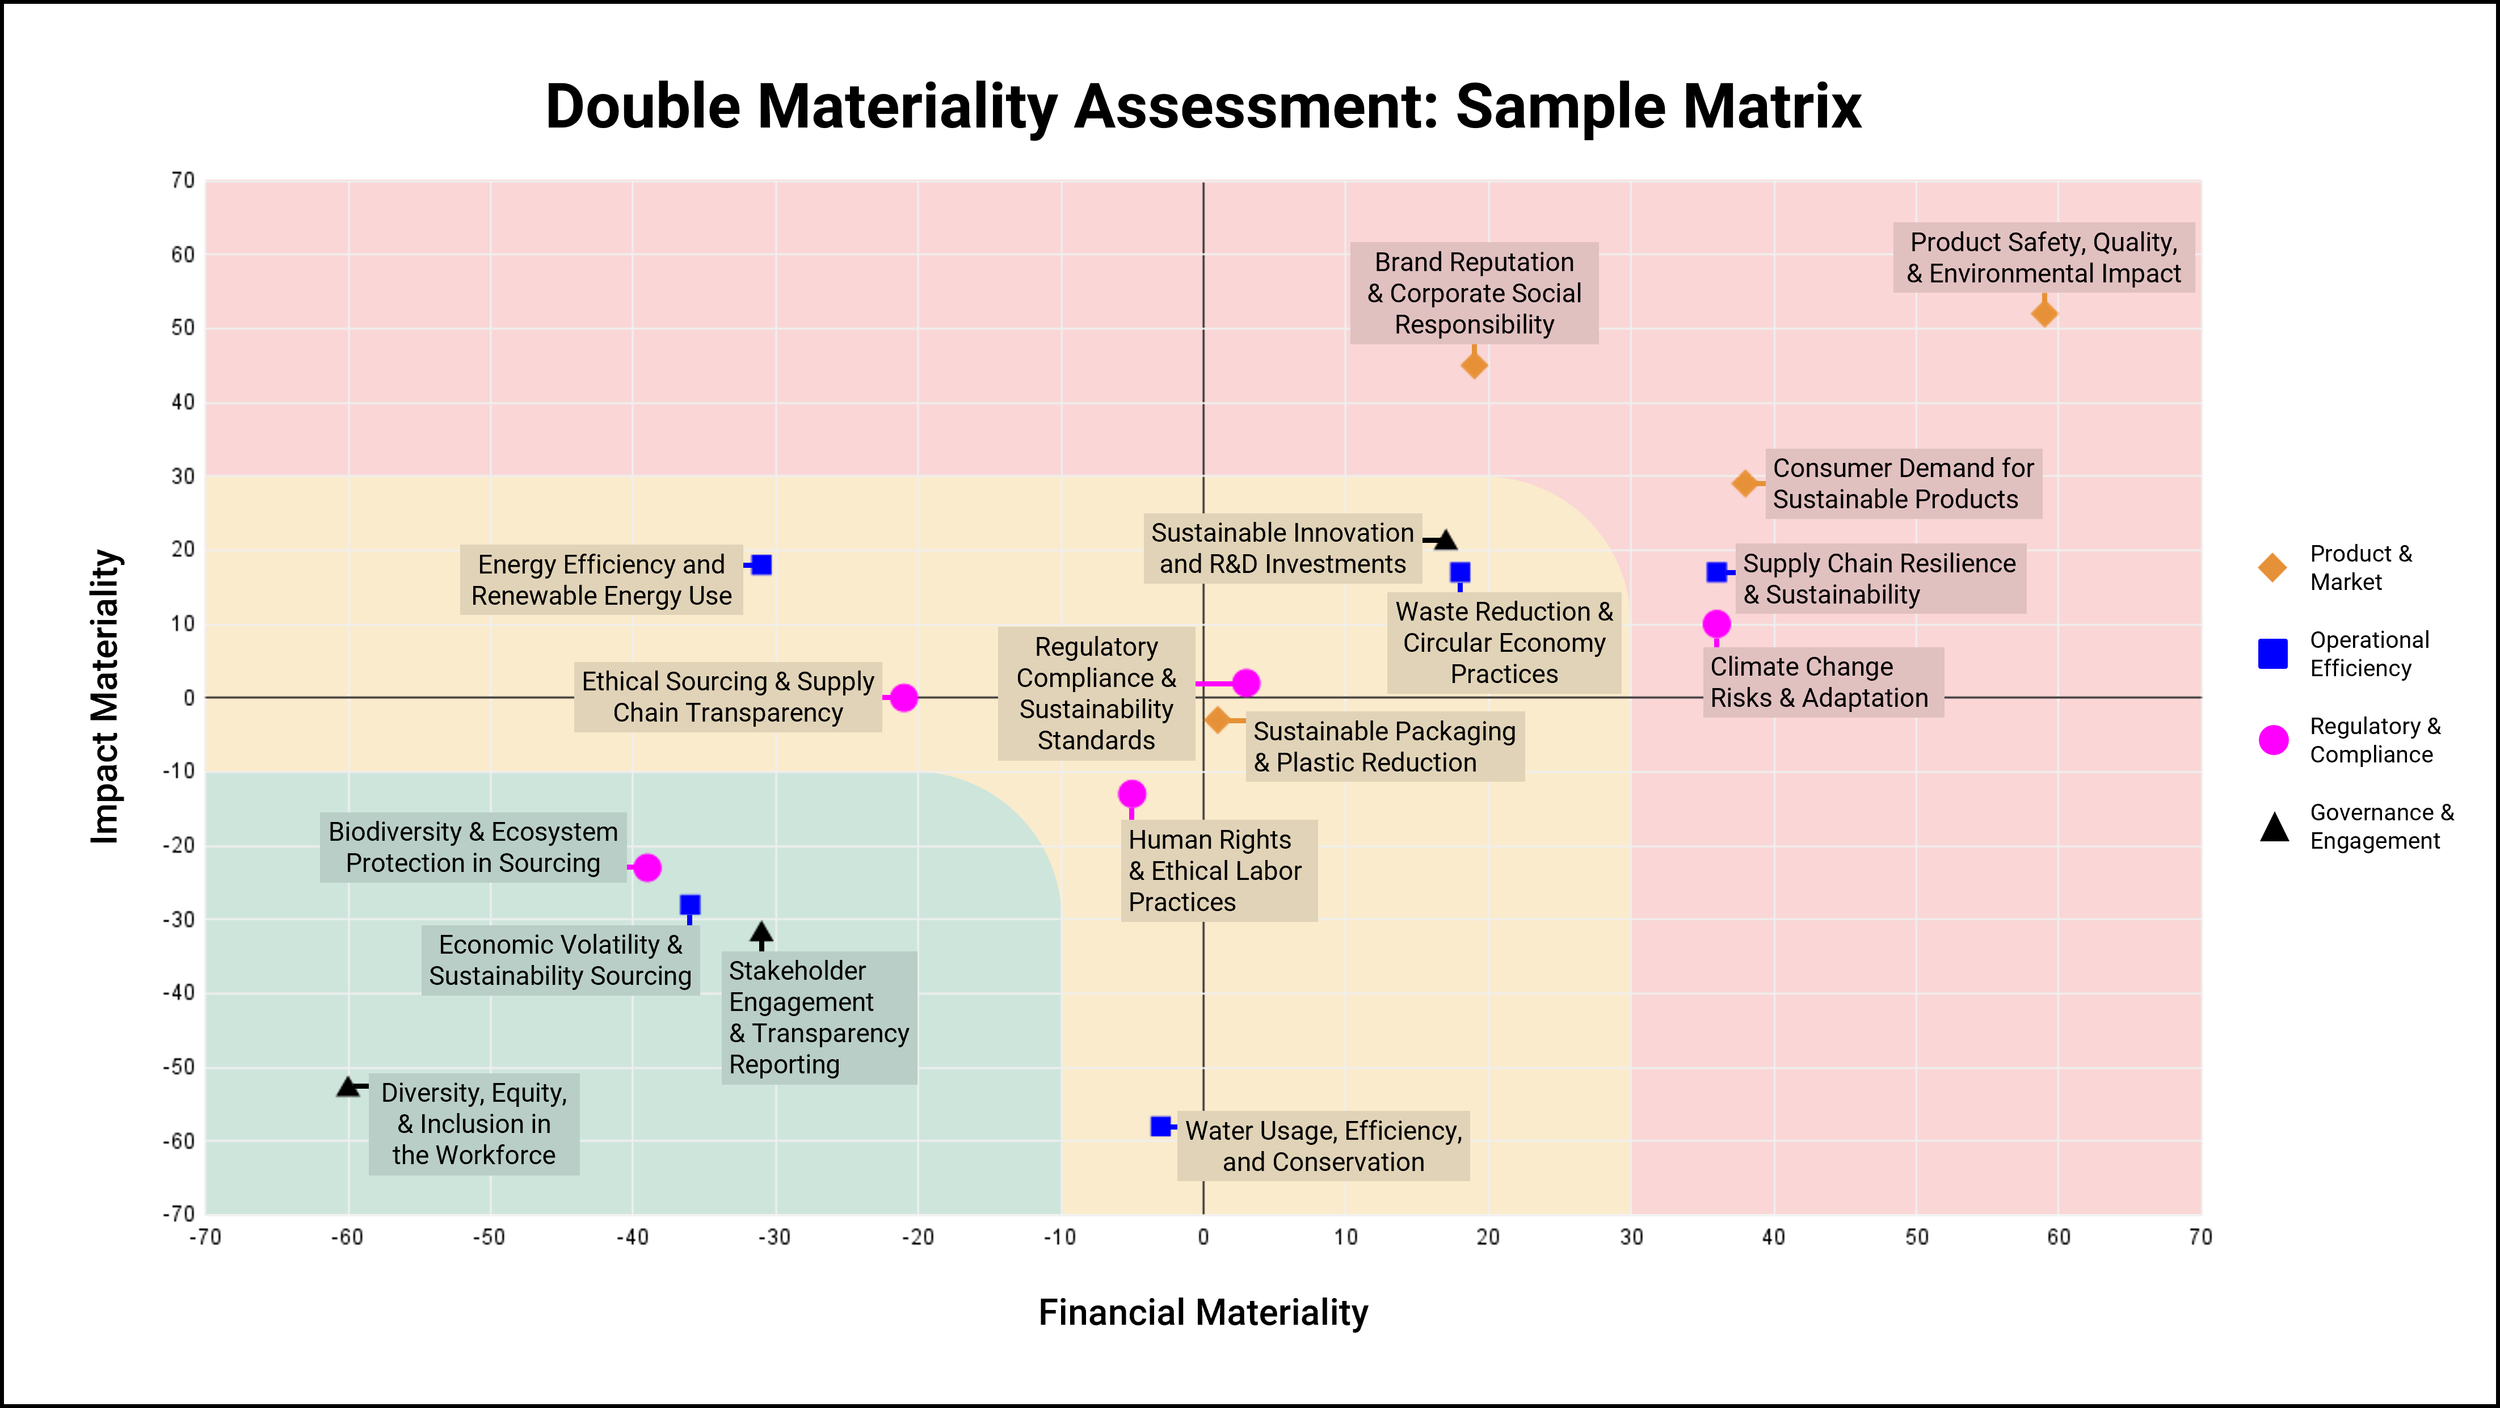
The final step I'll focus on is how to convert your Double Materiality Assessment survey results into a labelled scatterplot. Here's what my end result looked like using Google Sheets and PowerPoint.
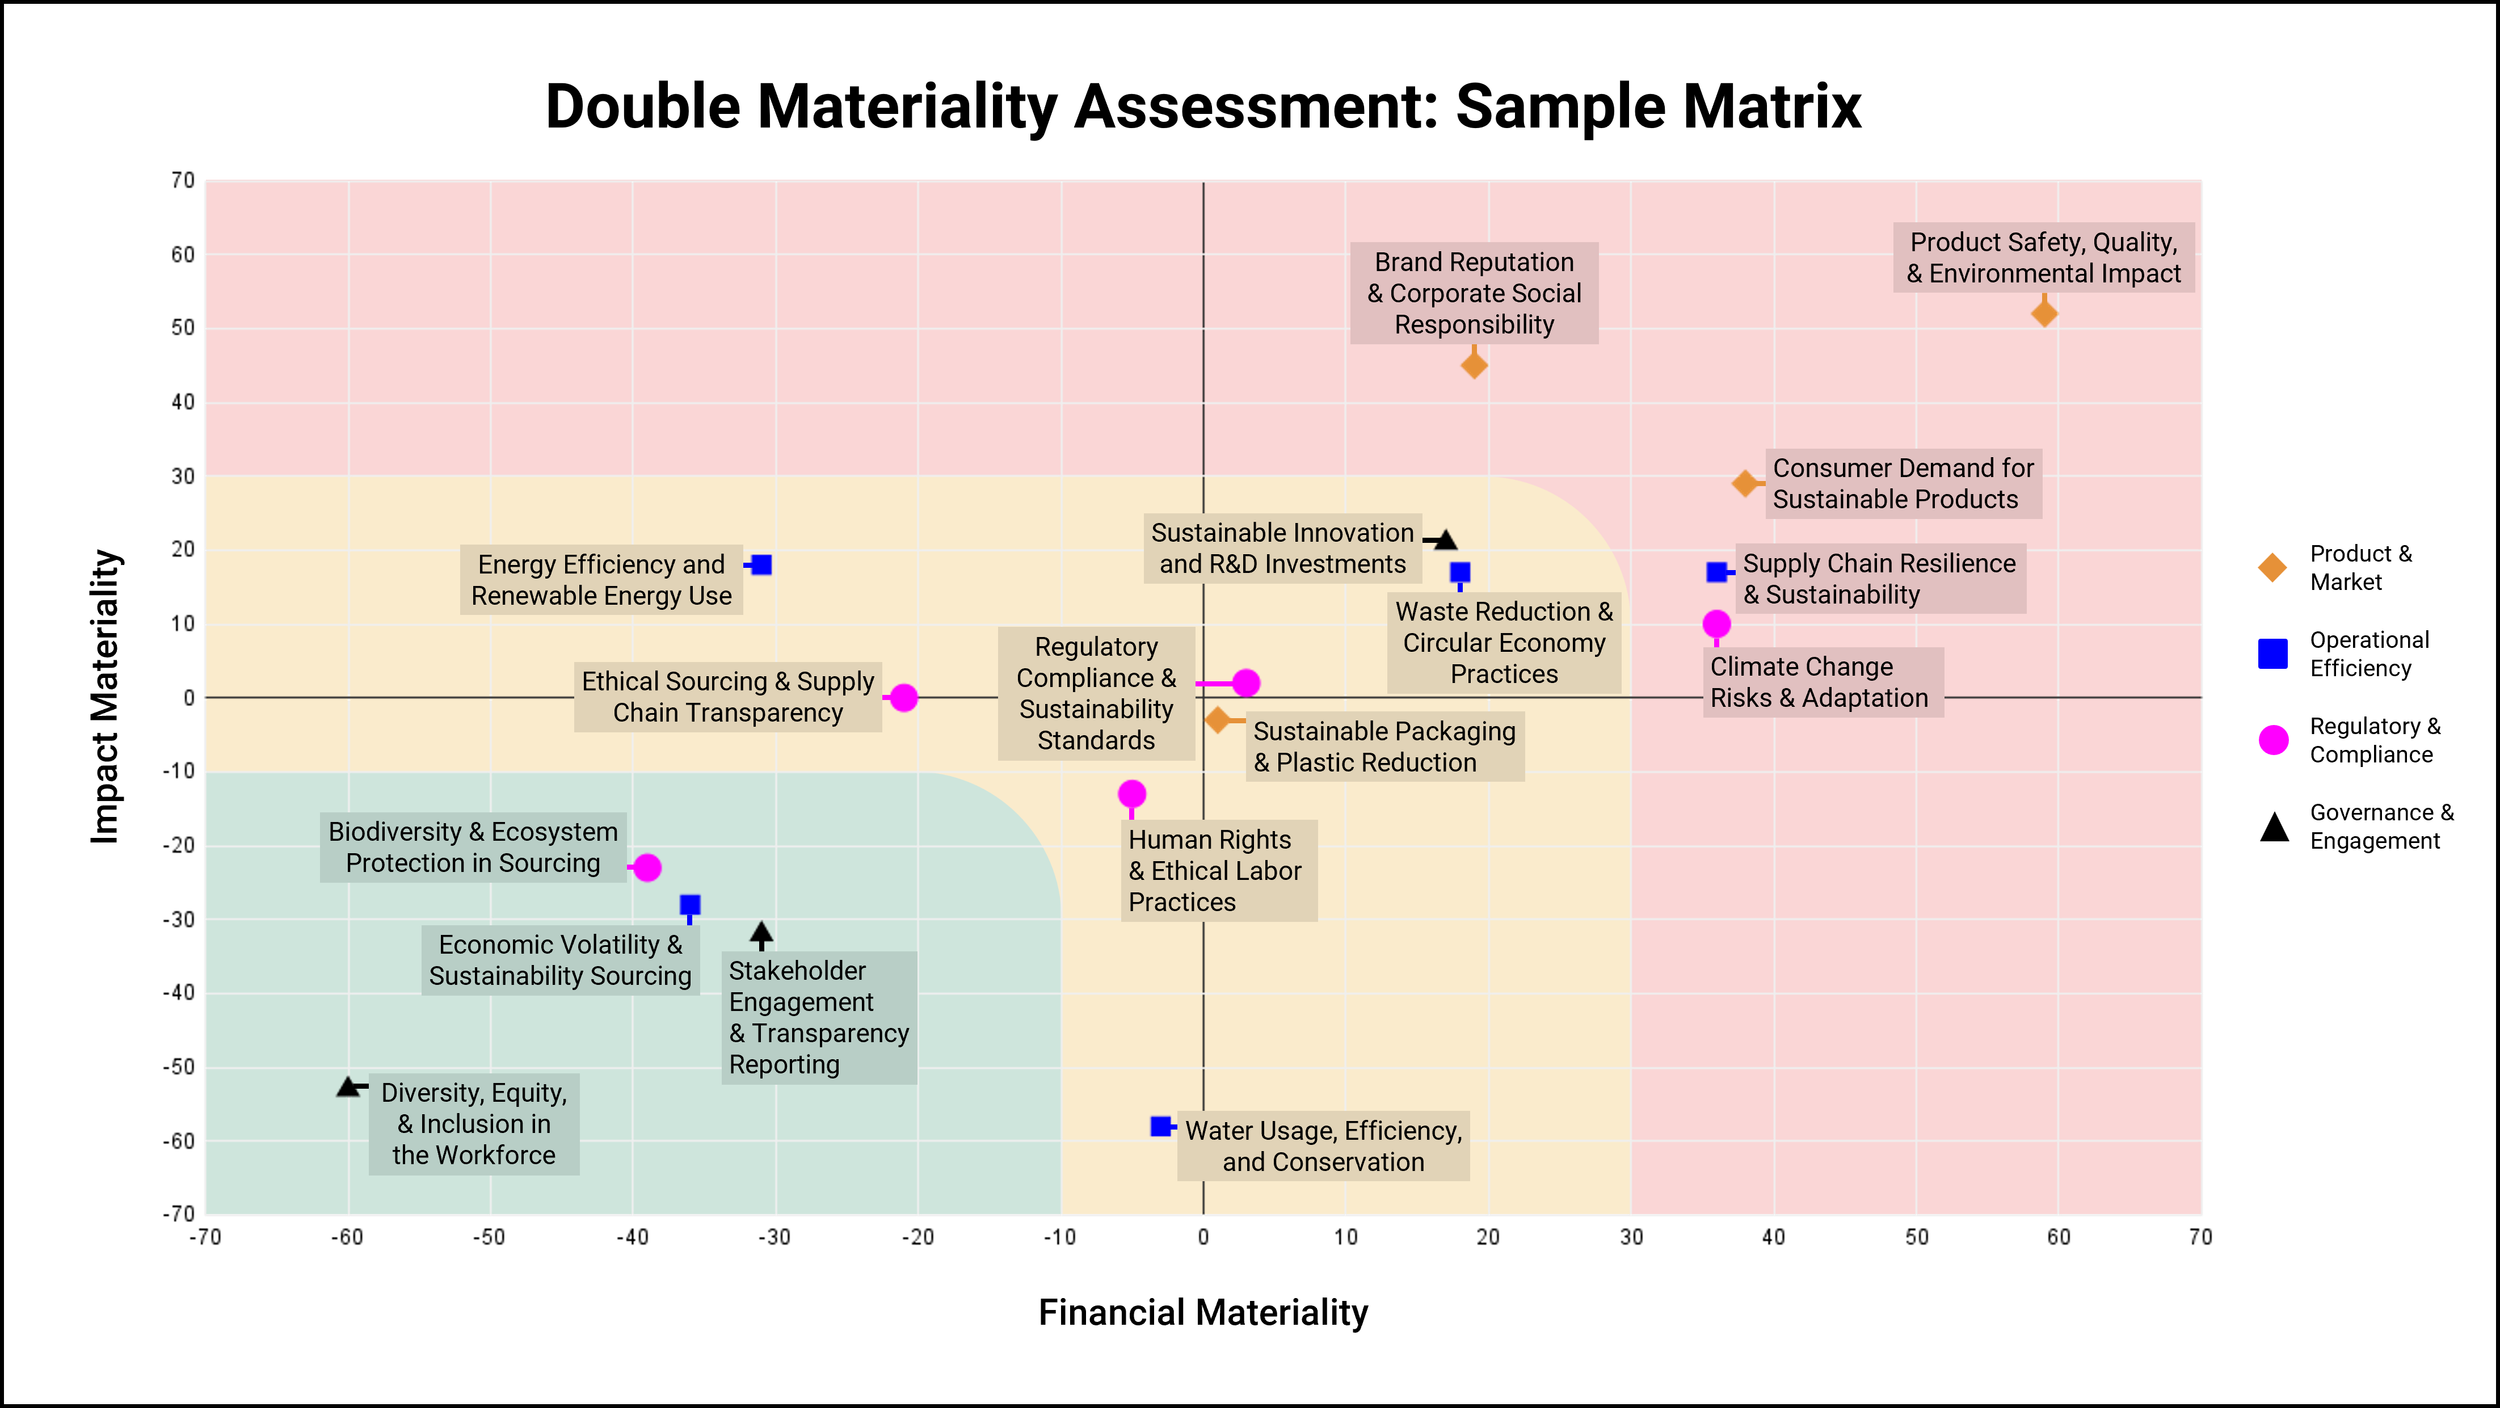
Here are the steps I followed to create this Materiality Matrix.
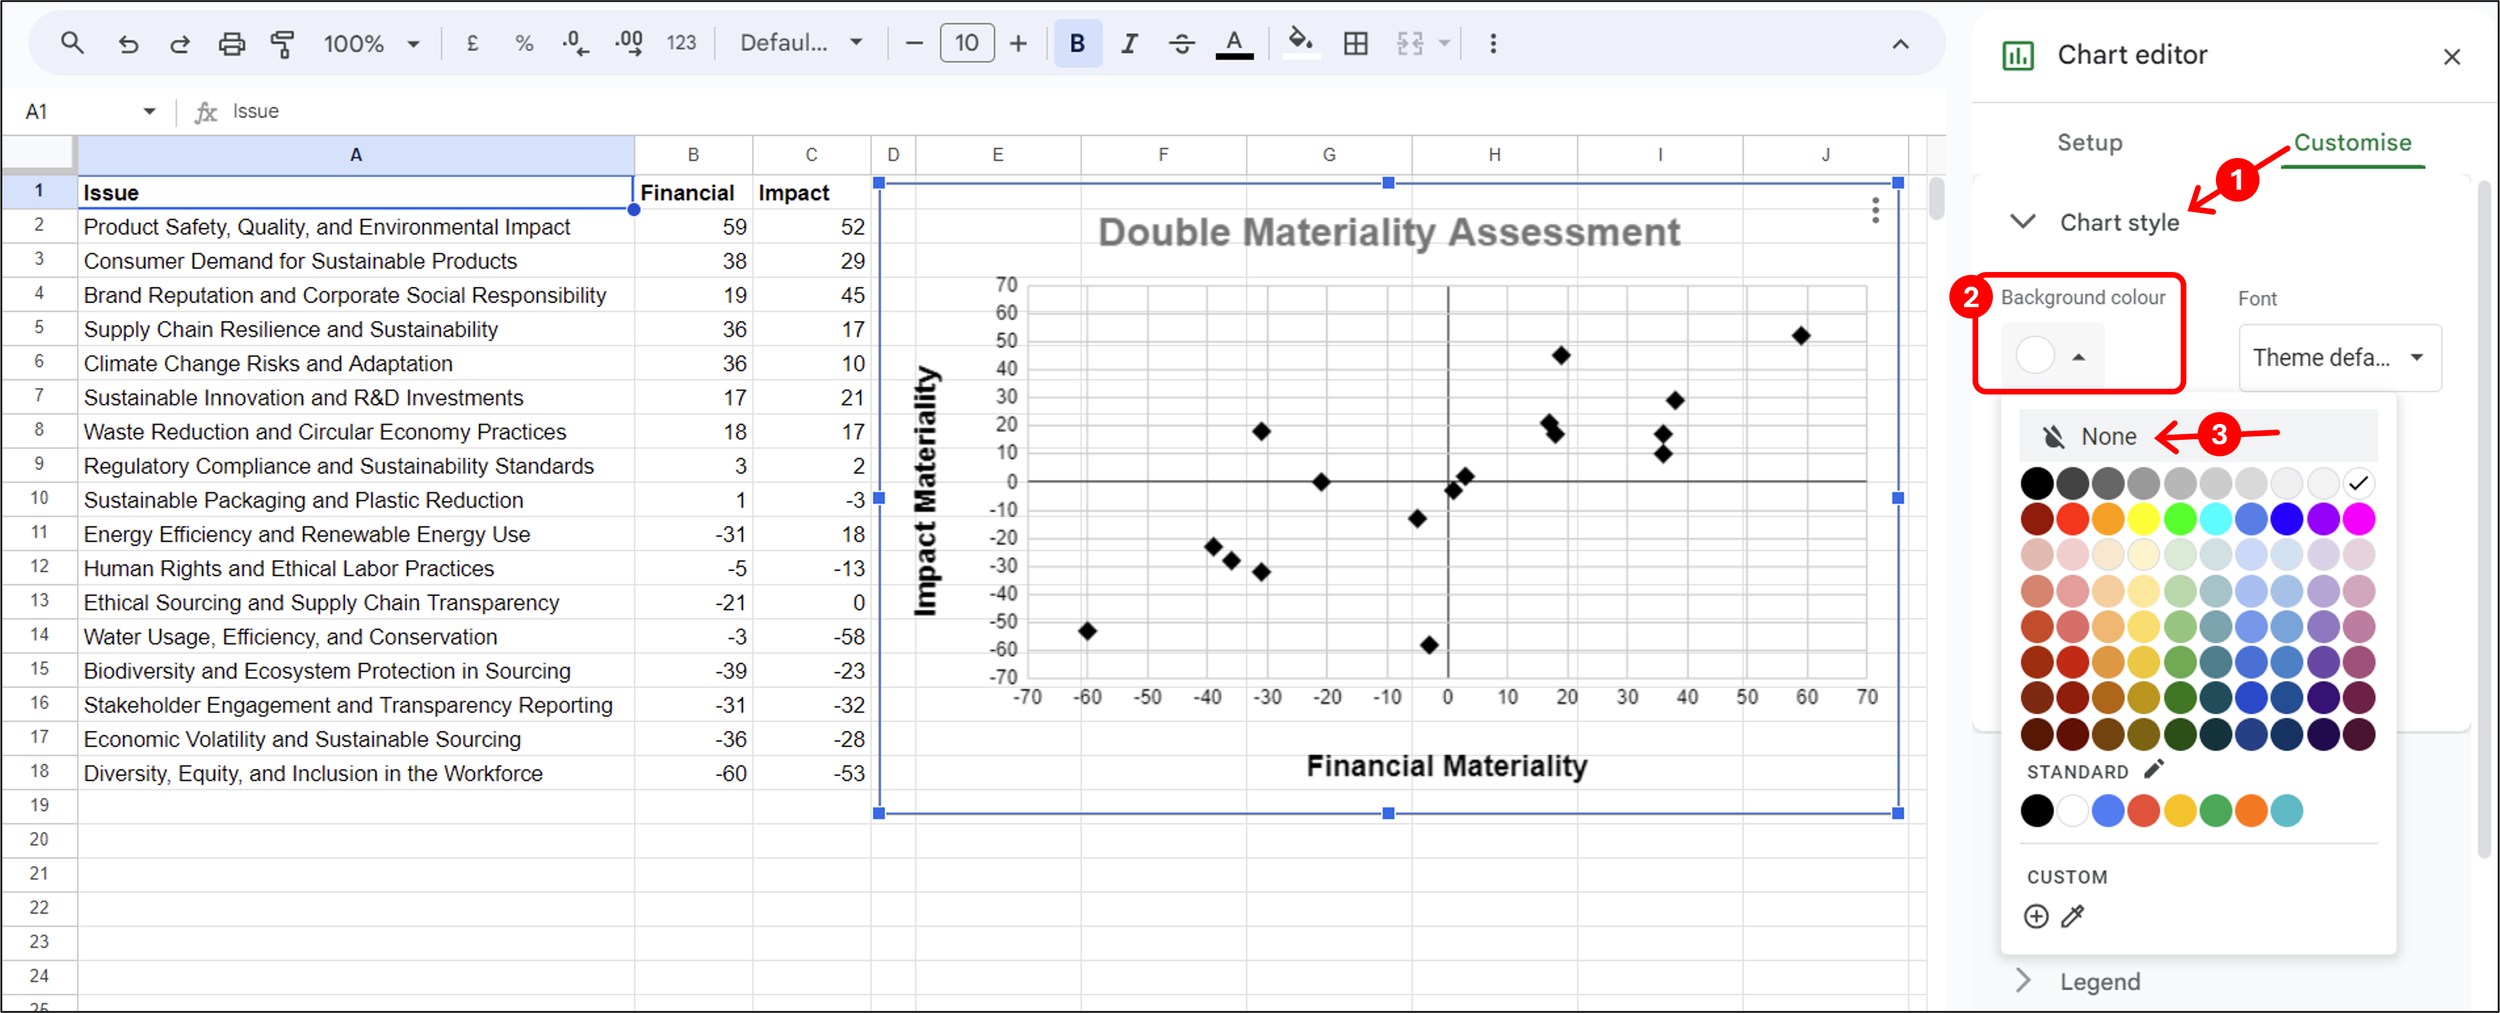
I copied my survey scores and pasted them into Google Sheets as a simple three-column table with the headings: (A) Issue, (B) Financial Score, (C) Impact Score. The example below uses MaxDiff scores, which is why the scale goes into negative numbers (MaxDiff scoring runs from -100 to +100). I then highlighted the table, clicked "Insert: Chart" and chose "Scatter Chart" from the Chart Type dropdown.
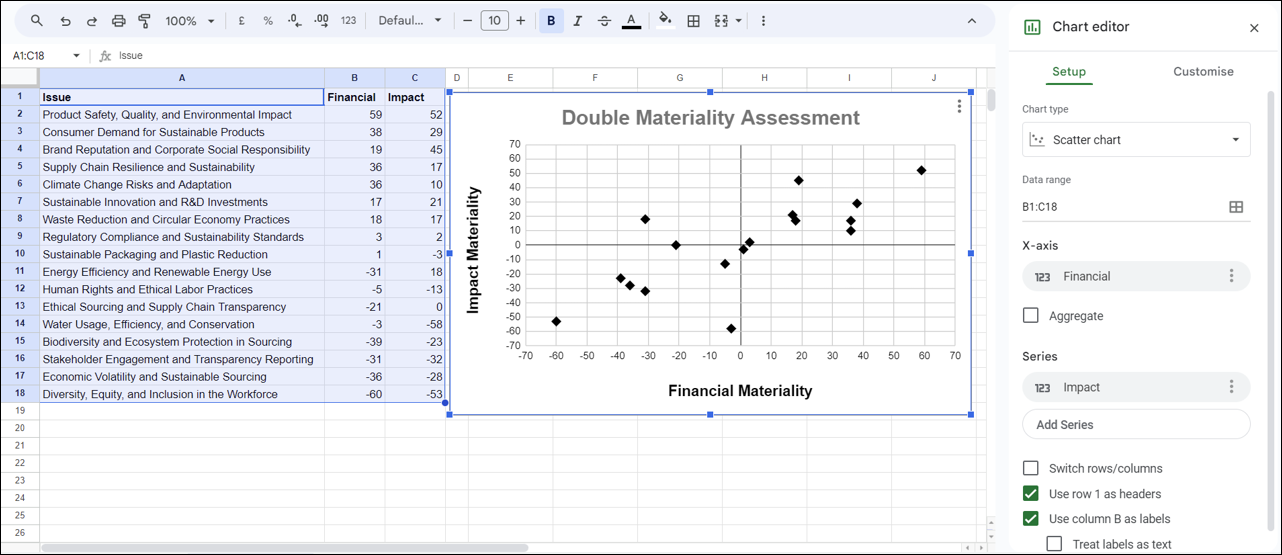
Unfortunately, there's no good scatterplot format with labels on either Google Sheets or Excel, so I had to use a manual workaround. First, I made the background transparent by going to Customize → Chart Style → Background Color → None.
Next, I downloaded it as an image by clicking the triple dot on the top-right corner of the chart, then "Download Chart" → "PNG Image", and opened that image in a new PowerPoint document.
Once open in PowerPoint, I added three rectangles using the "Insert: Shape" tool for my red high-risk zone (#FAD6D6), yellow medium-risk zone (#FAEBCC), and green low-risk zone (#CDE5DC). Each time I added a rectangle, I removed the border, added the fill colour, and clicked "Send Backward" to move it behind the transparent scatterplot. The high-risk red rectangle should meet both axes at their extreme ends, to show a topic can still count as high-risk even if it only scored highly on one of the two metrics.
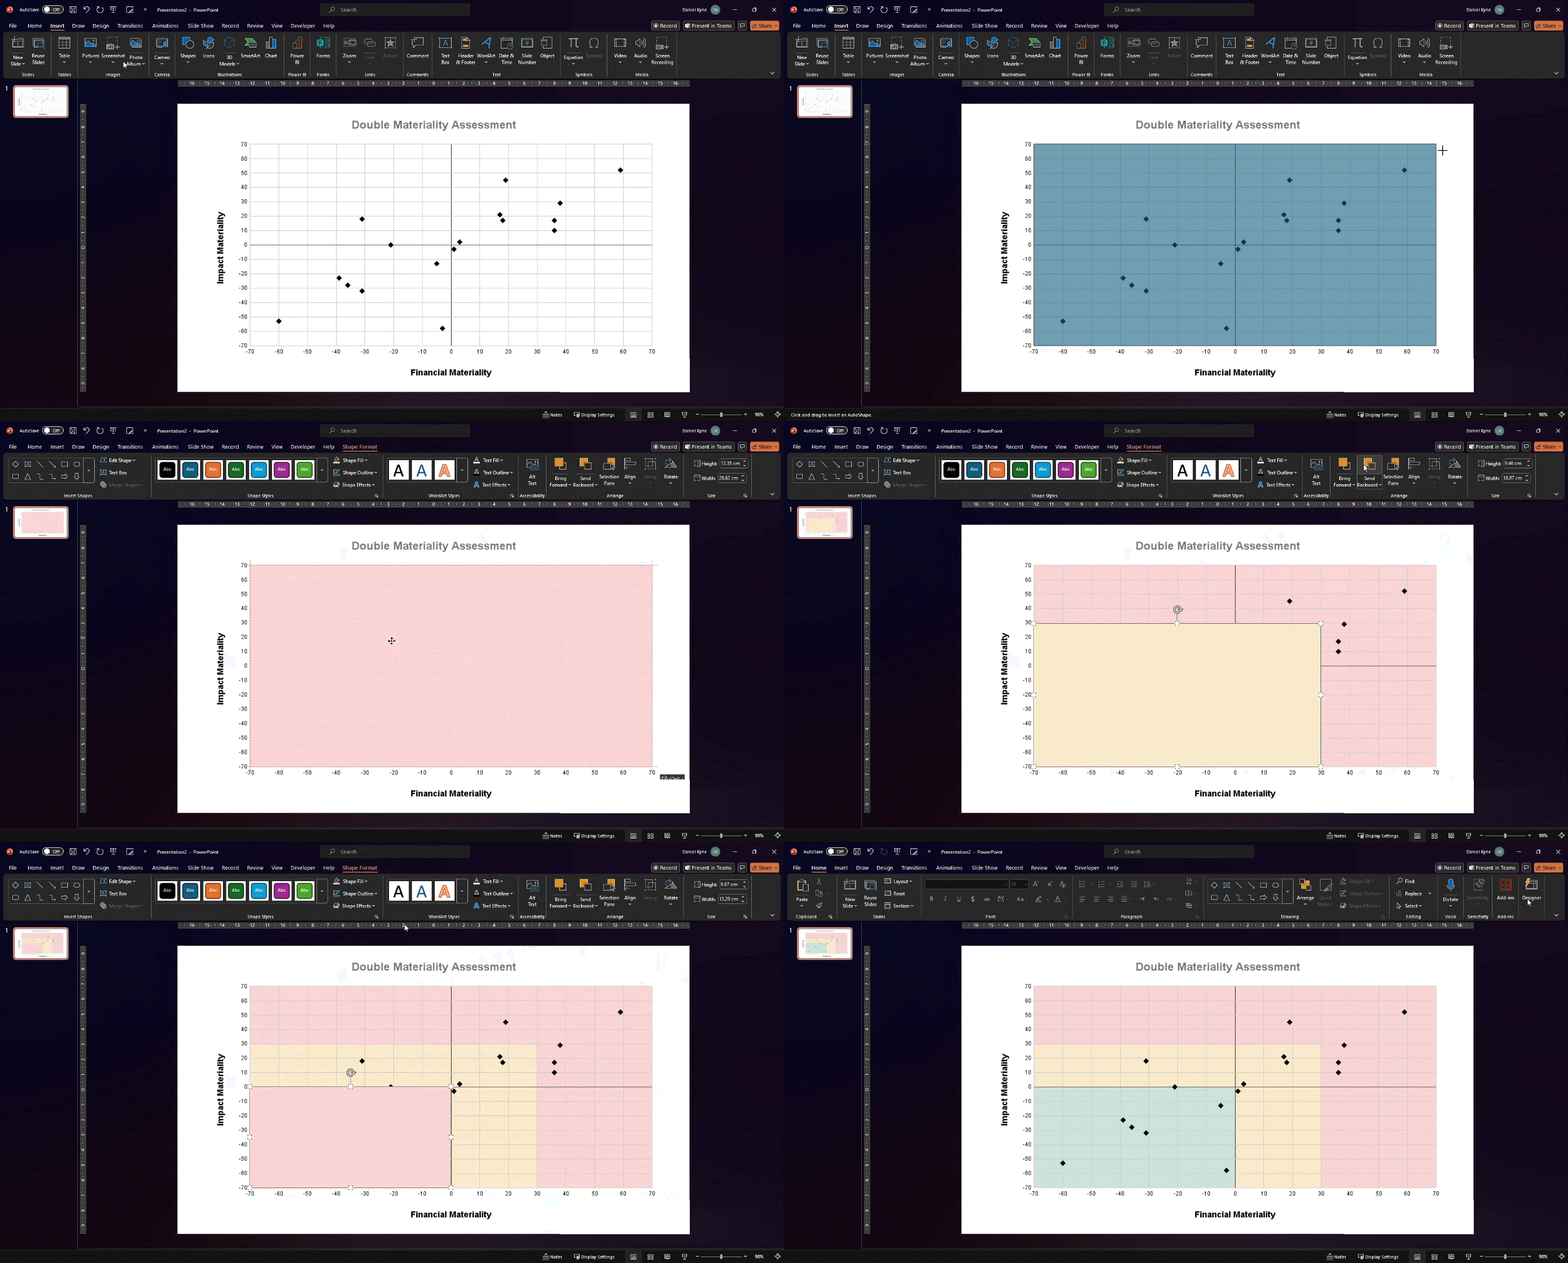
Note: this GIF didn't screen-capture the dropdown menus that should have appeared for choosing shape type and fill colour.
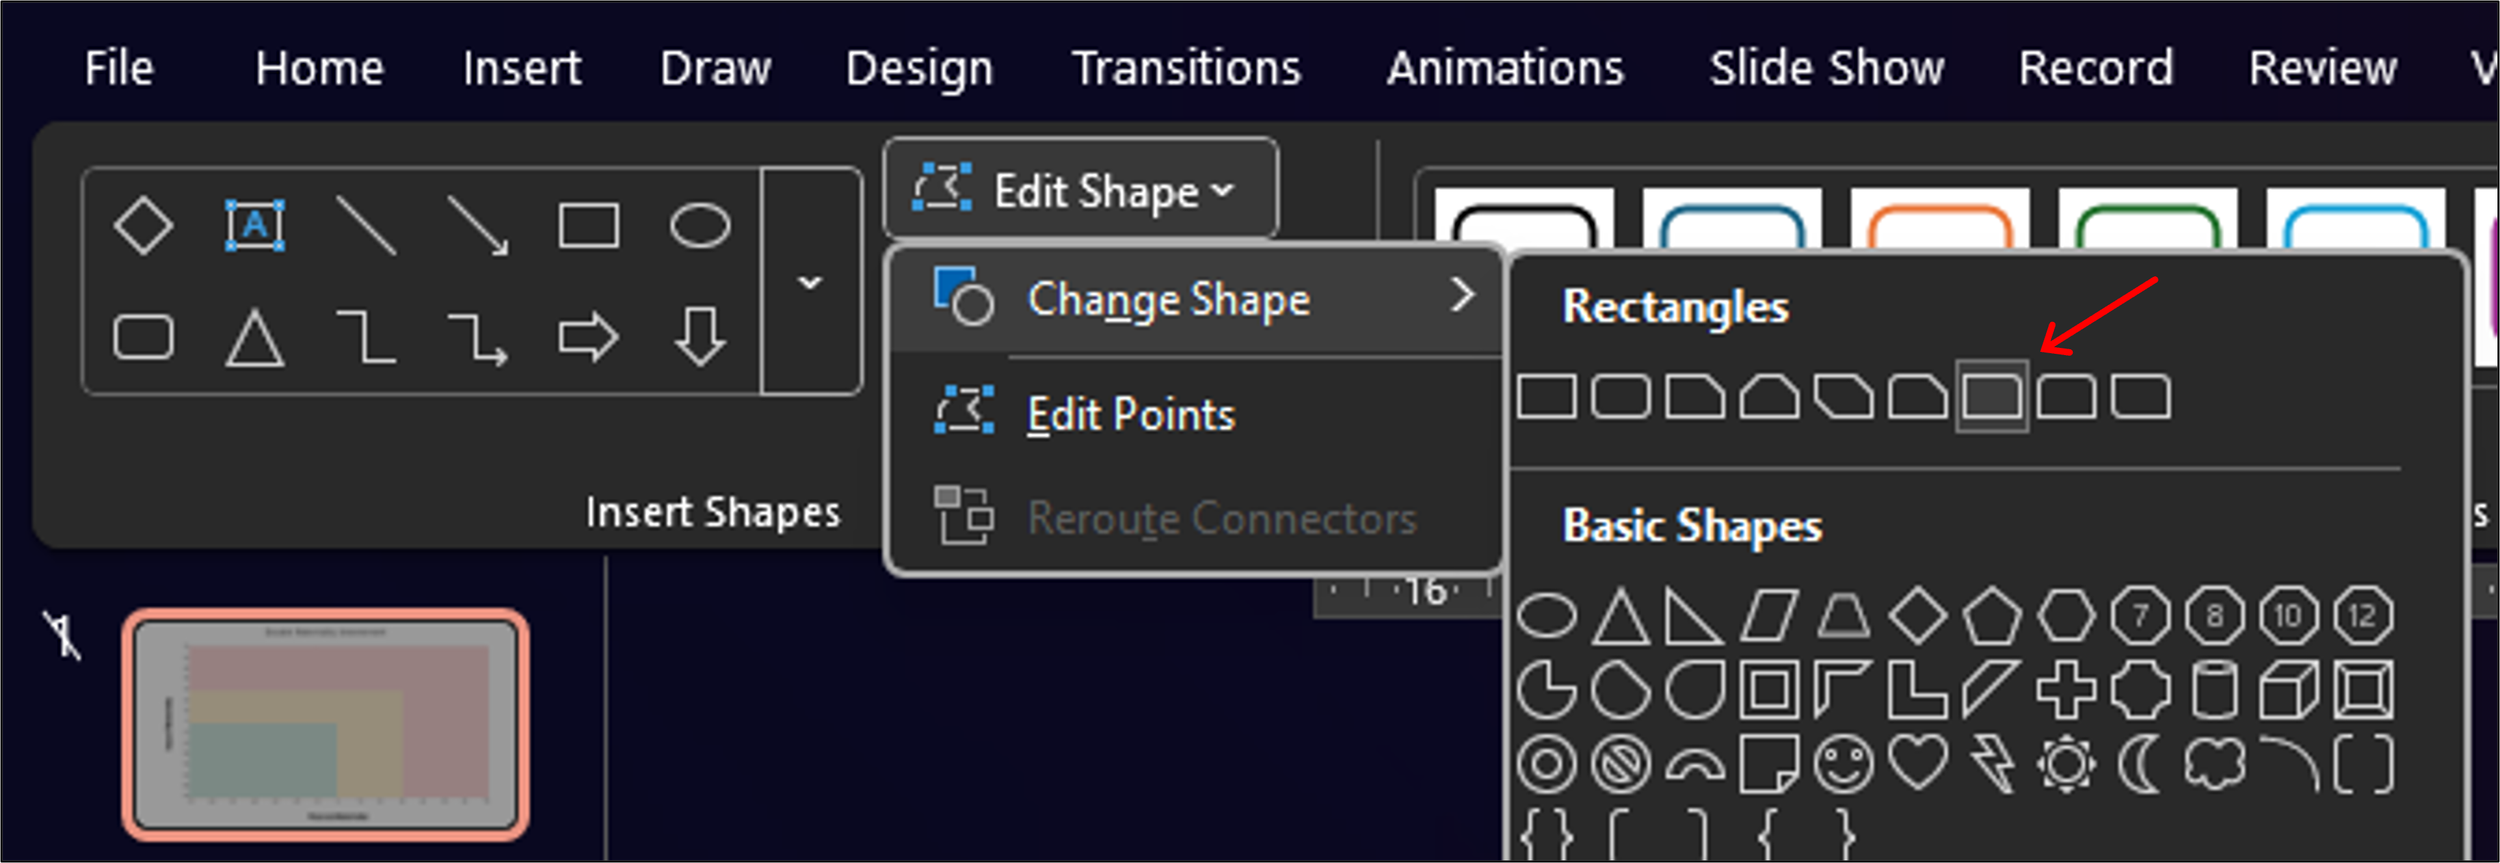
Once you've added those three rectangles as your scatterplot background, you can round a corner on the yellow and green boxes by clicking the shape, going to the "Shape Format" tab, opening the "Edit Shape" dropdown, clicking "Change Shape", and choosing the third-last option (a rectangle with only its top-right corner rounded).
This gives us the correct background and shape for our Materiality Matrix:
Like most things, the last 20% of customisation takes 80% of the work. This includes:
Adding labels to each data point.
Creating a category system with different colours/shapes for issues on the matrix.
Tailoring the axis labels and titles to make it more visually appealing.
I added labels to each point manually using textboxes in PowerPoint, and matched the background fill of each textbox to the section of the scatterplot the issue landed in. To change the size, colour, or shape of an individual point, triple-click any point on the scatterplot to open a customisation window.

The axes and gridlines can be edited in Google Sheets using the options under the "Gridlines and Ticks" section of the Customization sidebar. I also used PowerPoint to add a symbols key on the right side of the scatterplot. Once you've tailored the styling, export it again as a PNG and replace the image you'd been using in PowerPoint with the updated one.
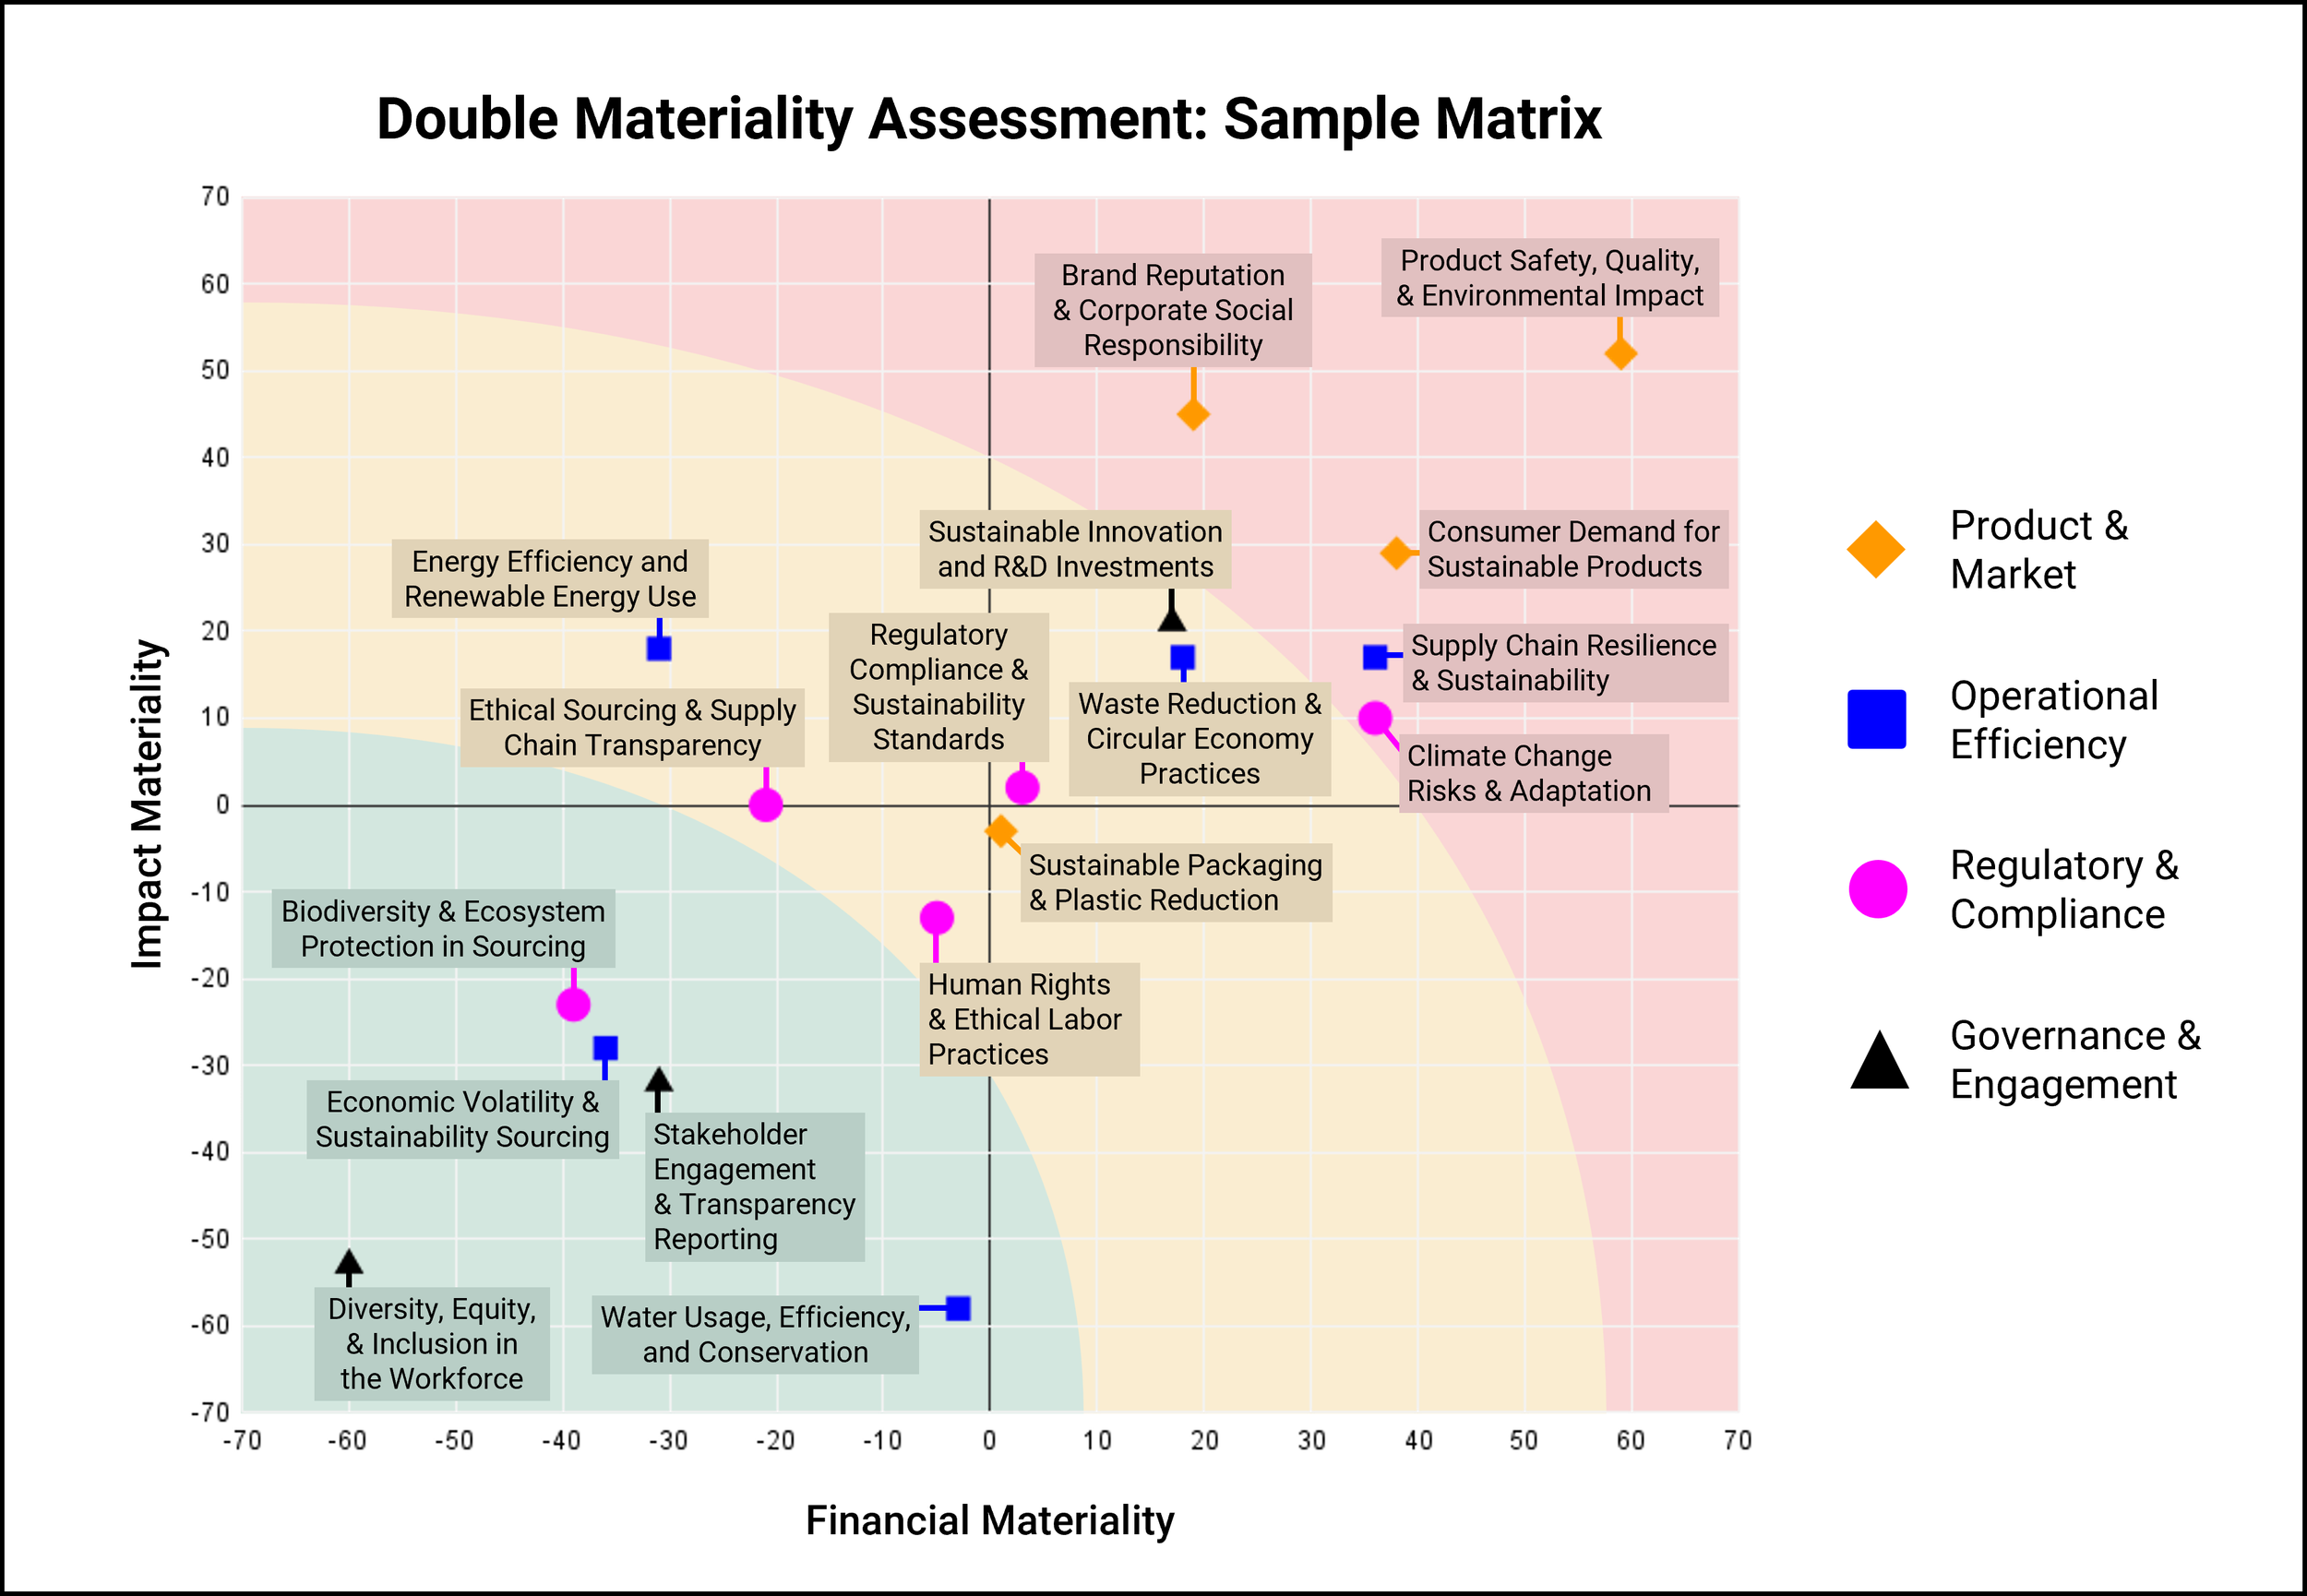
Here's a second format I created using the same approach, but with quarter-cut circles instead of rectangles for the background. Creating the quarter-circle shapes is quite a bit more complicated than the rectangles, but this approach does a better job of weighting the combined scores of both metrics when deciding which risk category a topic belongs in.
Post-research steps for Double Materiality Assessments
Once you've got your materiality matrix, it's time to move on to steps 6 and 7, Approve and Reflect.
Take your materiality matrix and a detailed report on your research methodology to your leadership team to get approval for the process you've run. That report should ideally also include detail on your survey participants, such as a breakdown of numbers in each stakeholder group consulted, transcripts or summaries of any interviews, and next steps like making mandatory disclosures for issues your assessment defined as high risk (and remember, an issue doesn't have to score high in both metrics to be material; a high score in just one is justification enough).
If this was the first double materiality assessment in your organisation, or you changed the process significantly, create a "best practice" document detailing the steps you took. Most large organisations (and any company with significant ESG impact risks) can expect to run double materiality assessments annually from 2024 onwards, so the more you preserve from this assessment, the more efficient future ones will be. This wrap-up period is also a good time to put tentative dates in your teammates' calendars for planning next year's assessment.
Start building internal expertise in materiality assessments today
Double Materiality Assessments aren't disappearing any time soon. From 2025 onwards, expect to hear about DMAs more and more often as they become regulatory requirements for a growing number of companies. Instead of paying seven figures a year to outsource this to an agency that knows 10% as much as you do about your organisation's context, you can start building the internal experience needed to run your own assessments each year. Create a free Pairwise Comparison survey and MaxDiff Analysis survey on OpinionX in under 5 minutes. Even if you don't launch it, you're doing yourself a favour by learning how these measurement methods work and how they apply to internal assessments like the Double Materiality framework.
Frequently asked questions
What is a double materiality assessment? An assessment that identifies which ESG topics are most material to a company from two perspectives: financial materiality (how sustainability issues affect the business) and impact materiality (how the business affects people and the environment).
Why are materiality assessments becoming mandatory? Regulations like the EU's Corporate Sustainability Reporting Directive (CSRD) require in-scope companies to report on material ESG topics, and a double materiality assessment is how you decide which topics those are. More jurisdictions are moving the same way.
How do you measure materiality? Survey your stakeholders on the ESG topics using a ranking method (like pairwise comparison or MaxDiff) rather than a rating scale. Ranking forces trade-offs and avoids the "everything scores high" problem that rating scales produce, giving you a clear order of priority.
How do you create a materiality matrix? Plot each topic on a scatter chart with the two materiality dimensions as the axes (financial and impact), so the most material topics sit in the top-right. The guide above walks through building one in Google Sheets and PowerPoint.
What survey method is best for a materiality assessment? A ranking method such as pairwise comparison or MaxDiff, because they measure relative importance across many topics and sidestep the straightlining you get when stakeholders rate everything as important on a scale.
Want more like this? Over 42,000 researchers and product people get The Full-Stack Researcher in their inbox. Subscribe for the next one.