
“A MaxDiff survey puts a handful of statements on screen and asks for the strongest and the weakest. Repeat that enough times and every statement lands somewhere on a scale, which is what a star rating never manages. This hub covers the method, the maths behind the scores, how to size a study, and where to read further on each part.”
What is MaxDiff analysis?
MaxDiff analysis ranks a list by repeatedly presenting small groups of statements and asking the participant to flag one as strongest and one as weakest.
Typically only 3 to 6 options appear at a time, though you can show more if needed. Each time the participant votes, a new set from the overall list appears.
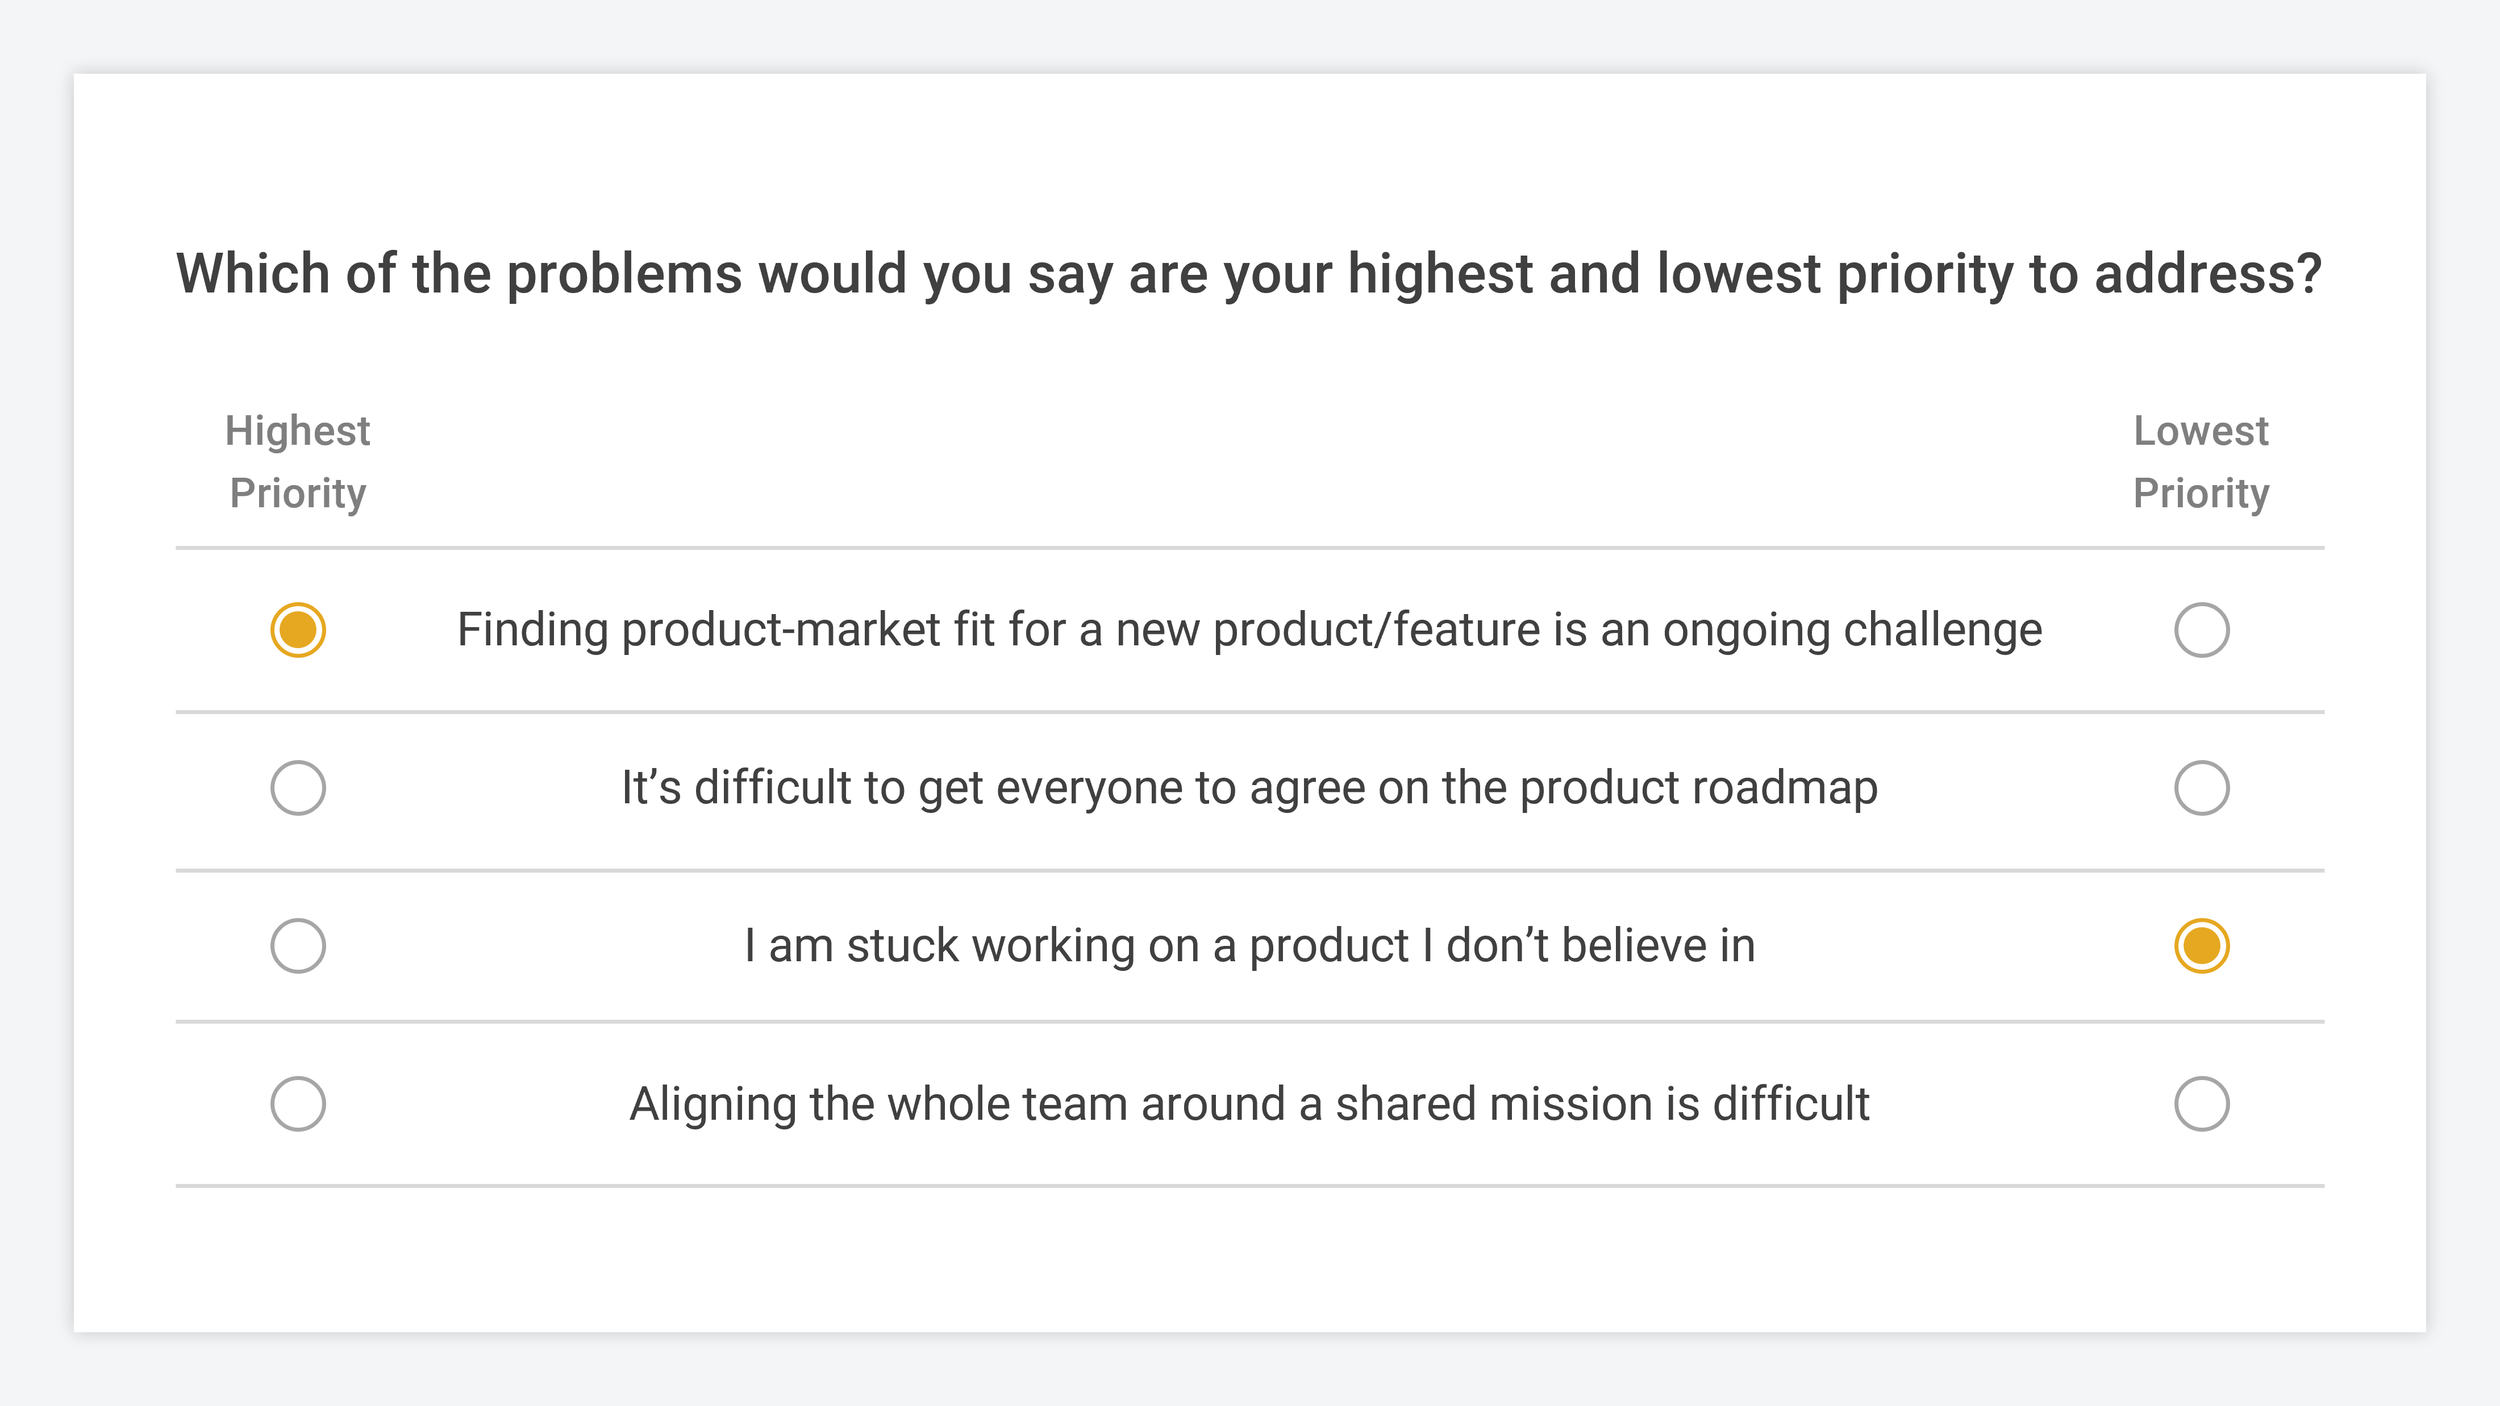
The "best" and "worst" labels can be changed to suit the research occasion: Favourite and Least Favourite, Top and Bottom, Most and Least Preferred.
Try one for yourself
The fastest way to understand MaxDiff is to complete one. This example ranks a list of colours from most to least preferred. Seven voting sets, then you see the results.
How is MaxDiff different from other types of survey questions?
Comparison is compulsory here, and that changes the shape of what comes back. MaxDiff returns continuous data spread along a scale.
Stars return discrete data instead, bunched at whichever values people default to. Nothing in a 5-star question prevents a participant handing out fours all the way down, which leaves you with a list and no order.

^ This is exactly why researchers go for forced comparison methods like MaxDiff instead of rating-based questions like Likert Scales — it’s much better at mapping the minor differences in people’s preferences even when they like all the options.
The gaps between people's preferences are the most valuable output of ranked results, and a rating question destroys them. Every top priority ends up flattened into the same 5-star response. Central tendency bias is why researchers reach for forced comparison instead.
When is MaxDiff analysis used?
MaxDiff measures priorities, which suits it to several research situations.
One is prioritisation: ranking problem statements to find which pain does the most damage, or which feature customers most want built. Another is sales and marketing research, comparing messaging ideas or product claims to see which one an audience picks. Airbnb used MaxDiff this way to measure customer concerns.
In pricing research it works out which features carry the value inside a given tier, which feeds both feature discovery and upgrade messaging. It's also fast enough to run live in a workshop, which turns a meeting where the loudest person wins into one with a result attached.
Then there's segmentation. Because MaxDiff captures each person's preferences individually, the output splits cleanly by group. That's needs-based segmentation, and VEED ran exactly that study.
What are the advantages of MaxDiff Analysis?
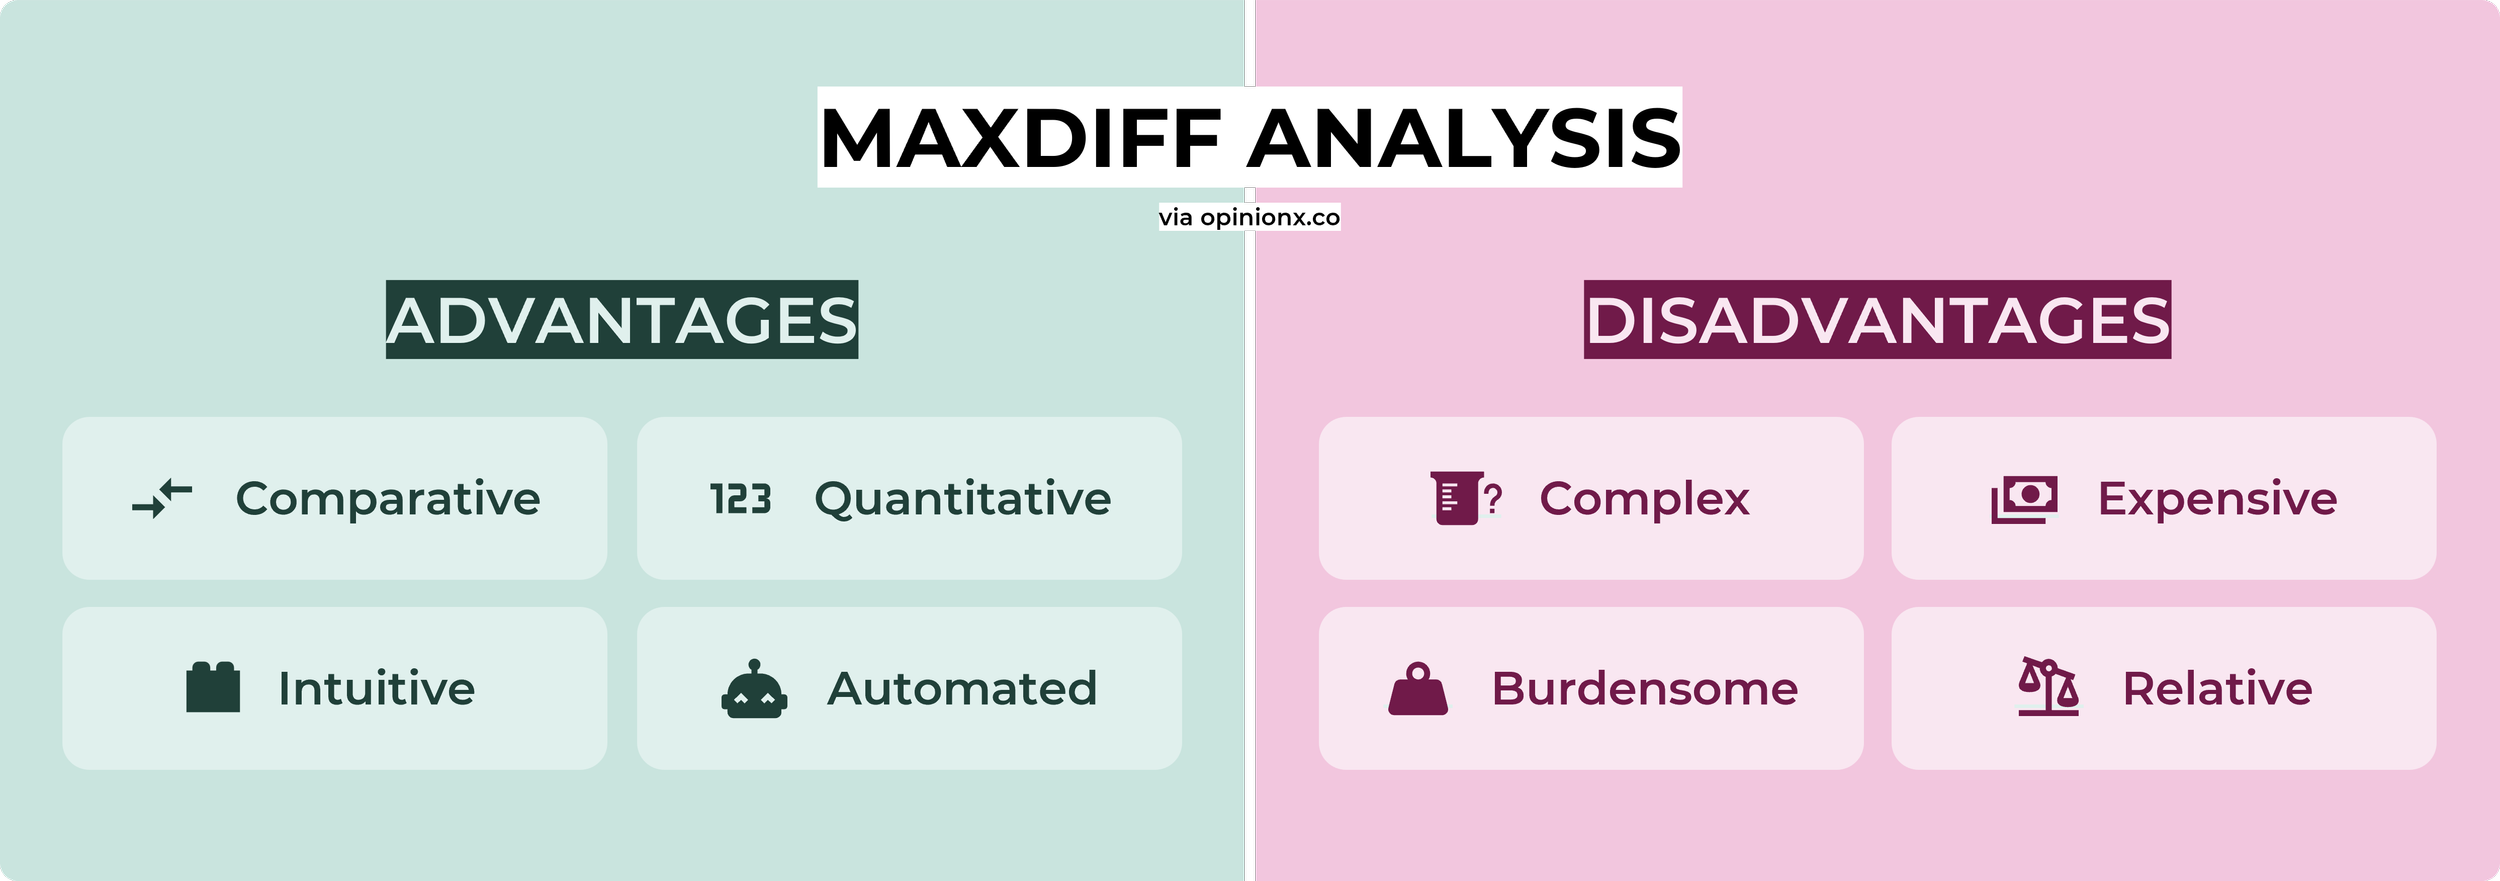
Forcing comparison turns opinions into a ranked list without anyone manually ordering everything, and it converts text and images into numerical statistics, which is what a big decision usually needs behind it. The task itself stays simple: a six-year-old could complete one. Pick the best and worst from 3 to 6 choices, repeat. It works as well on a phone as on desktop, where manually ranking a long list doesn't. And because every vote has the same shape, a study with ten respondents and one with ten thousand take the same amount of analysis work.
Against that, four things to know.
Scoring can get complex. Some tools use linear regression or Bayesian models that produce statistics most people can't decipher. The simple formula below is far easier to explain, and to defend when someone challenges your results.
It's expensive almost everywhere else. Most research tools treat MaxDiff as an advanced method and price it accordingly.
It gets burdensome if overloaded. The rule of thumb is 3 to 6 options per set. Past that, switch to pairwise comparison, which shows two at a time.
Everything is relative. Like every discrete-choice method, MaxDiff scores options against each other, so it'll name the strongest option on your list without ever telling you whether the list itself was worth ranking. Do qualitative work first so the list covers a sufficient range.
Is MaxDiff the same as best-worst scaling?
No, despite decades of people online insisting otherwise.
MaxDiff names the collection mechanic: participants identify the pair separated by the largest gap in preference.
Best-worst scaling names the result, a scale running best to worst, and more than one method can produce it. MaxDiff is one of them. Pairwise comparison, ranked choice voting and conjoint analysis can all produce a best-worst scale.
Academia has separated the two since 2005. Outside academia they get used interchangeably, and we do it ourselves: the OpinionX question type is called Best/Worst Rank precisely to cover both.
The academic sources behind that distinction are laid out in best-worst scaling explained.
How are the results calculated?
Some tools use Bayesian models or linear regression. The common approach is aggregate scoring.
Best votes minus worst votes, divided by appearances. Written out: (best-worst)/appearances.
Run that on an option seen across 100 sets, flagged strongest 50 times and weakest 15: (50-15)/100 lands it at 35%.
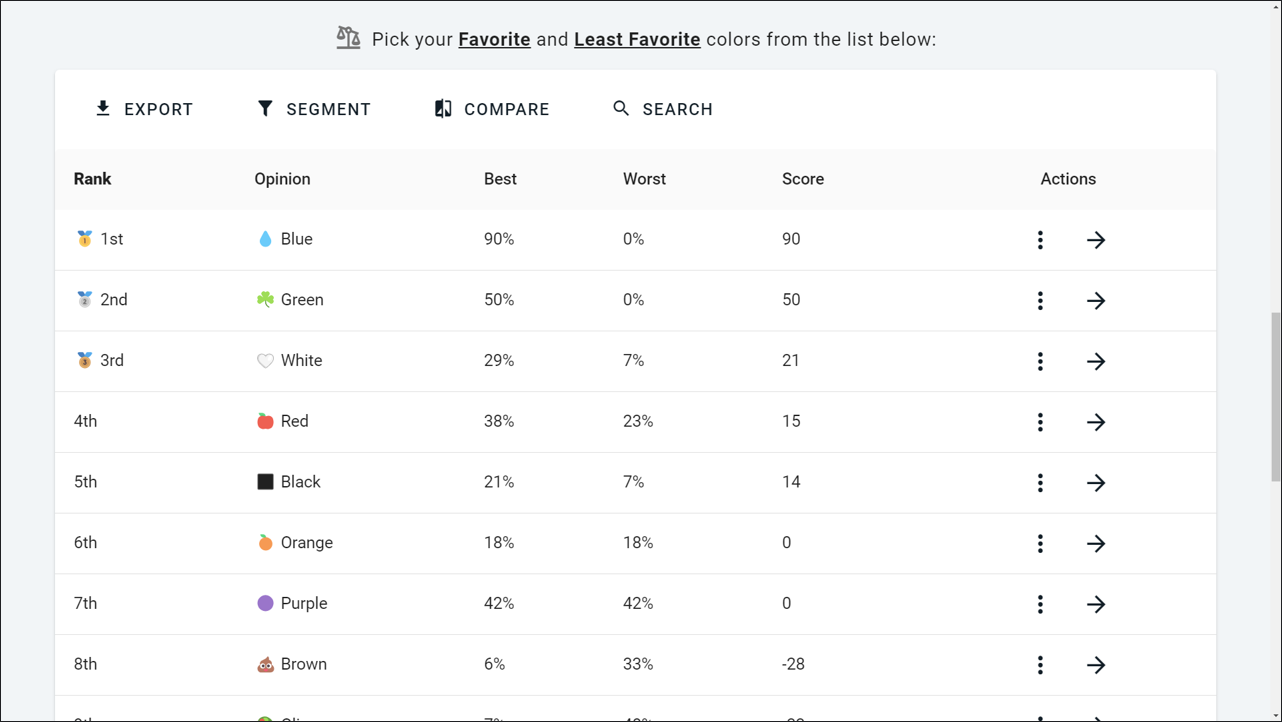
Screenshot of the results table on a Best/Worst Rank survey hosted (via OpinionX)
Scores run from -100 to +100. That's the whole calculation, and it's short enough that you can explain it to a stakeholder in one sentence.
How do you calculate sample size for MaxDiff analysis?
Most guides hand you an arbitrary minimum of 100 participants. That number means nothing on its own. The right target depends on how your survey is configured.
Five variables:
| Variable | What it means |
|---|---|
| x | Total ranking options in your survey |
| n | Options shown per set |
| p | Participants you expect to finish, as a minimum estimate |
| s | Sets per participant |
| r | The reliability variable, ensuring each option appears in at least r comparisons |
They combine as rx/np = s.
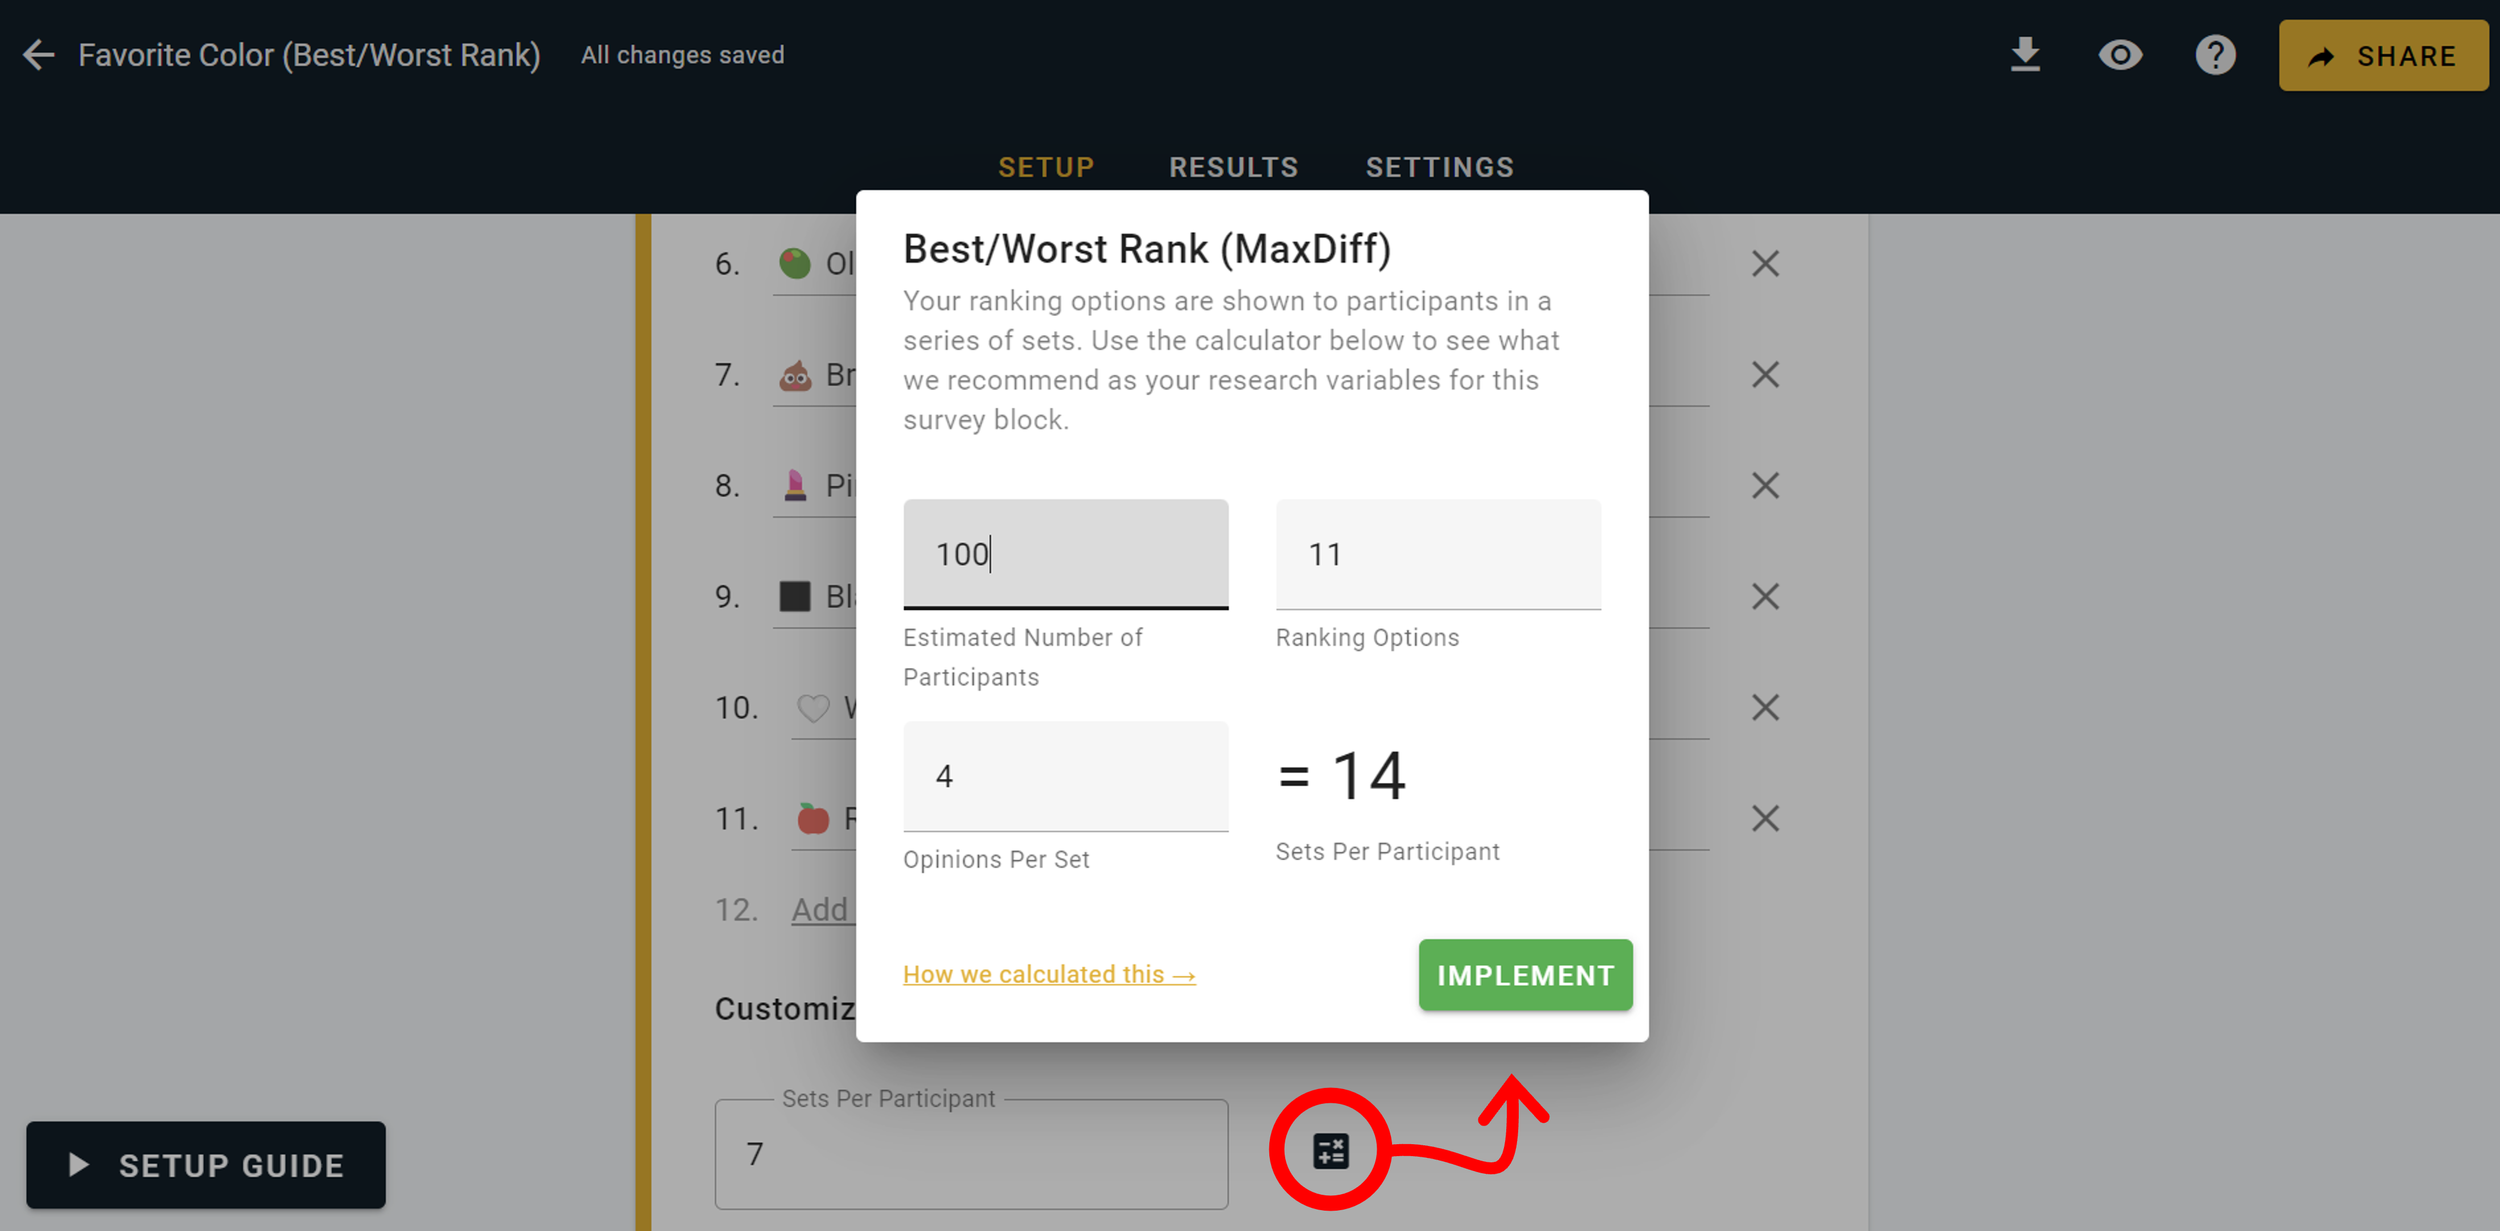
Set r to at least 200, so every option appears at least 200 times across the survey. The output, s, is the easiest variable to change when you want more reliable results.
A survey with 30 options (x), showing 4 per set (n), expecting 80 people to finish (p): 200(30)/4(80) = 18.75. Round up, so 19 sets per participant.
Four caveats on that. Never go below 10 sets, so if the formula returns under 10, show 10 anyway, because each set takes seconds. The formula rearranges, and solving for participants instead gives p = rx/sn. Count the whole survey, not one question, because if you have several ranking questions you need to add up every vote a participant casts, and anything above 40 sets across a survey is a lot to ask without an incentive. And segmenting changes p: if segmentation matters, substitute the participants variable for the number you expect from your smallest key segment.
What are the best MaxDiff analysis tools?
Most survey platforms treat MaxDiff analysis as an advanced feature and price it that way. Several put it behind their most expensive tier, several can't be tested without a sales conversation, and for at least one it's hard to find evidence the format exists at all.
Nine platforms are reviewed with current pricing, screenshots and verdicts in comparing MaxDiff tools.
What are the alternatives to MaxDiff analysis?
Four methods cover similar ground:
Pairwise comparison shows two options at a time instead of 3 to 6, which makes each vote faster and lighter. Best for long or wordy lists.
Ranked choice voting hands over the full list to order. Simplest of the four, and it should be capped at 6 to 10 options.
Points allocation, also called constant sum, gives each participant a budget of credits to spread across options. It captures magnitude, not just order.
Conjoint analysis votes on profiles containing several variables at once, which is the only way to rank categories and the options inside them together. Considerably more complex than MaxDiff.
All four are compared in alternatives to MaxDiff analysis.
Running MaxDiff analysis on OpinionX
The MaxDiff question type is called Best/Worst Rank. It uses the (best-worst)/appearances formula above, and the sample size calculator is built into the question so you don't have to work the numbers by hand.
Every question type and every analysis feature is unlocked on the free tier, capped at 25 participants per survey. That's enough to run a full MaxDiff study, check the configuration and read the segmented results before paying anything. The Analyze plan is $900 a year and removes the participant cap.
Frequently asked questions
What is MaxDiff analysis in simple terms?
Small groups of options, usually three to six per screen, with one marked strongest and one marked weakest. Enough repetitions and the whole list ends up ranked, each option carrying a score instead of only a position.
How is a MaxDiff score calculated?
Aggregate scoring: (best-worst)/appearances. Subtract an option's worst votes from its best votes, then divide by how many times it appeared. An option seen 100 times, picked best 50 and worst 15, scores 35%. Scores run from -100 to +100.
How many participants does a MaxDiff survey need?
No fixed minimum exists, whatever the commonly quoted 100 suggests. Configuration decides it, through rx/np = s, with each option needing at least 200 appearances. Thirty options at four per set across 80 participants works out at 19 sets each.
How many options should you show per set?
Three to six. Fewer than three and you're running pairwise comparison. More than six and the cognitive load climbs fast, which costs you completion rate and data quality.
Is MaxDiff the same as best-worst scaling?
No. MaxDiff describes how the data is collected, best-worst scaling describes the output. Pairwise comparison, ranked choice voting and conjoint analysis can all produce a best-worst scale too.
Over 42,000 researchers and product people get one method breakdown like this each week in The Full-Stack Researcher.