
CONJOINT ANALYSIS SURVEYS
Design and run conjoint analysis surveys with simple setup and automated results
Built on a gold-standard HB-MNL scoring model, OpinionX is a flexible survey platform with advanced market research methods, helping teams run conjoint and segmentation analysis in-house without needing any specialists.
You don't need a credit card · Free up to 25 participants
Trusted by scaling startups, research agencies, and large enterprises alike


What is conjoint analysis?
Conjoint analysis is a survey method that measures what attributes matter most to people when buying a product. By asking people to choose between profiles that with randomised configurations of those attributes, their choices reveal how much each attribute drives their decision and which levels they prefer for each attribute.
These results feed into charts that show people’s value perception of each attribute, market simulators that predict their purchase decisions, and segment charts that compare different types of target customers.
Use it when...
The decision has several moving parts at once, price, plan tier, features, delivery, and you need to know which ones drive the choice and by how much.
Best for...
Product teams packaging a plan, pricing teams setting tiers, and researchers forecasting how a new profile would take share from the offers already on the market.
Alternative methods...
MaxDiff when your options are a single flat list, not attributes of one product.
Van Westendorp or Gabor Granger when price is the only variable you're testing.
How conjoint analysis surveys work on OpinionX
Add conjoint into any survey
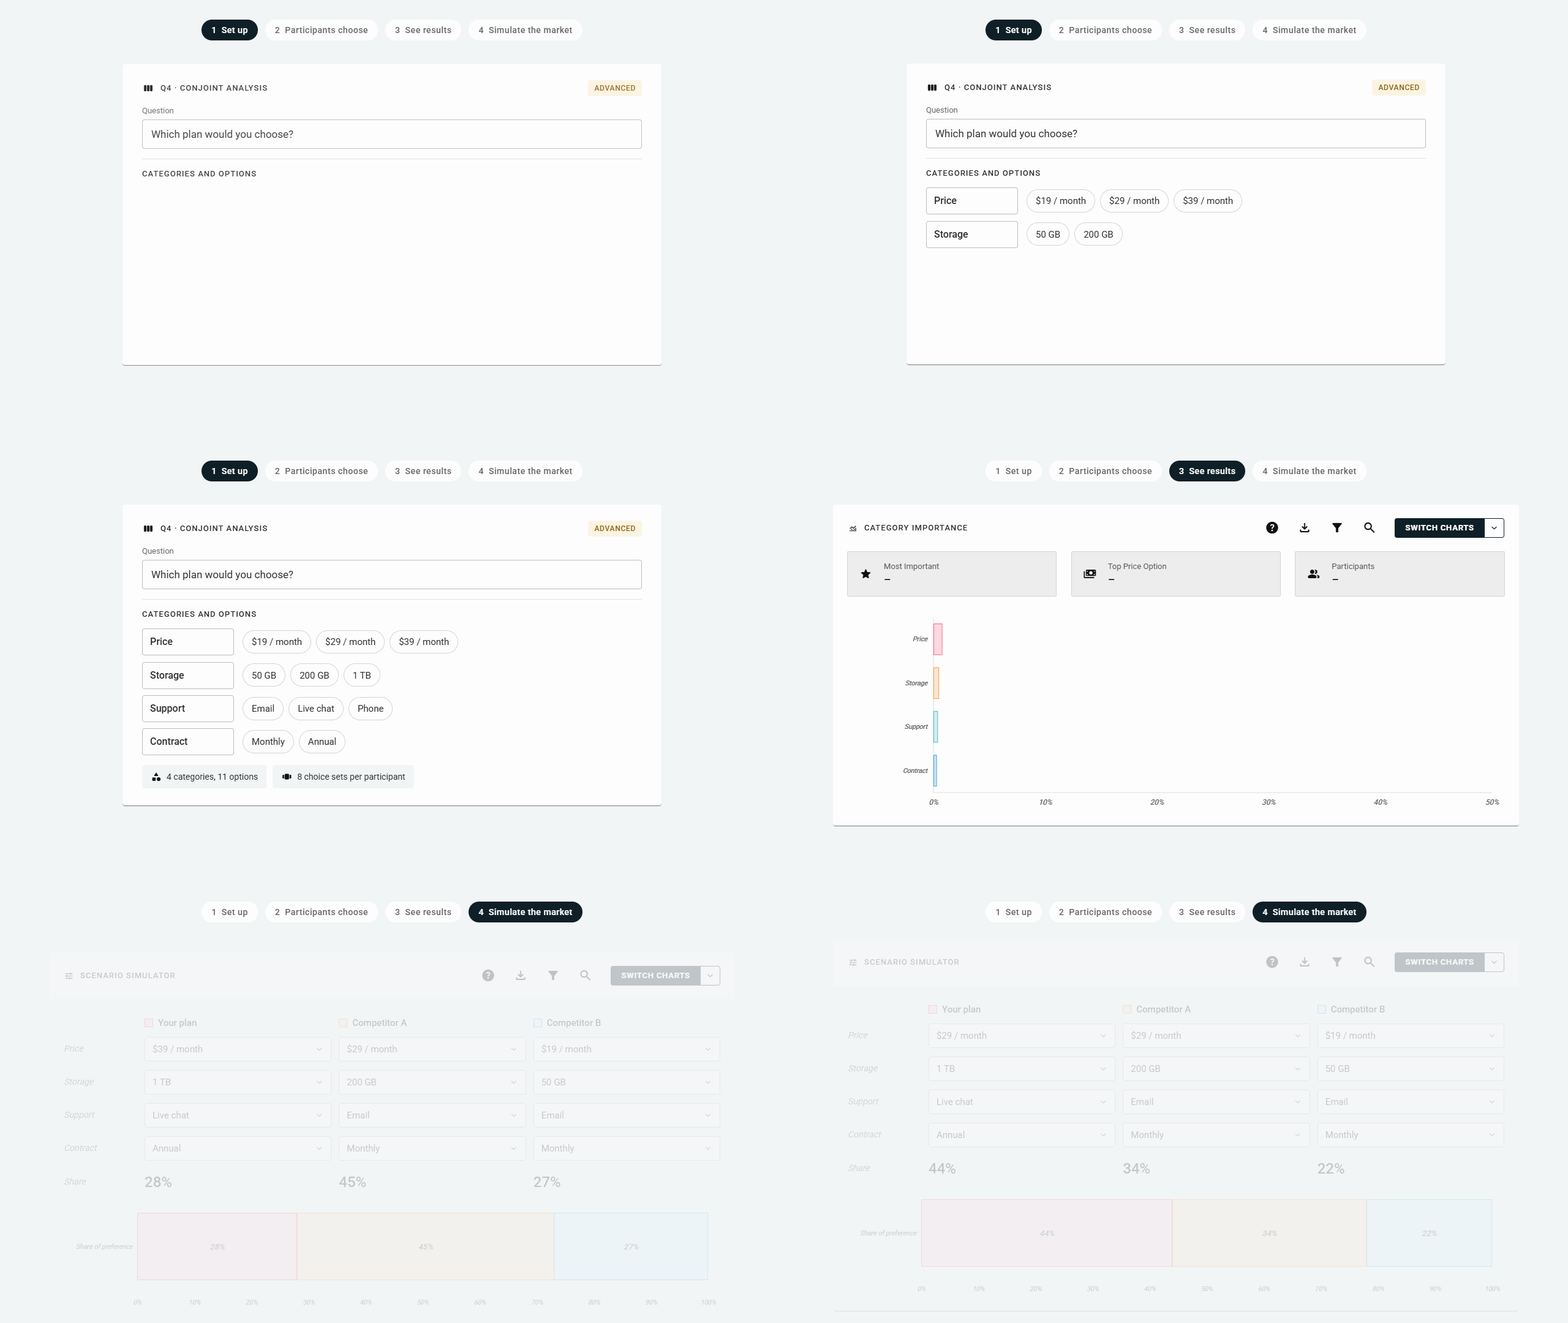
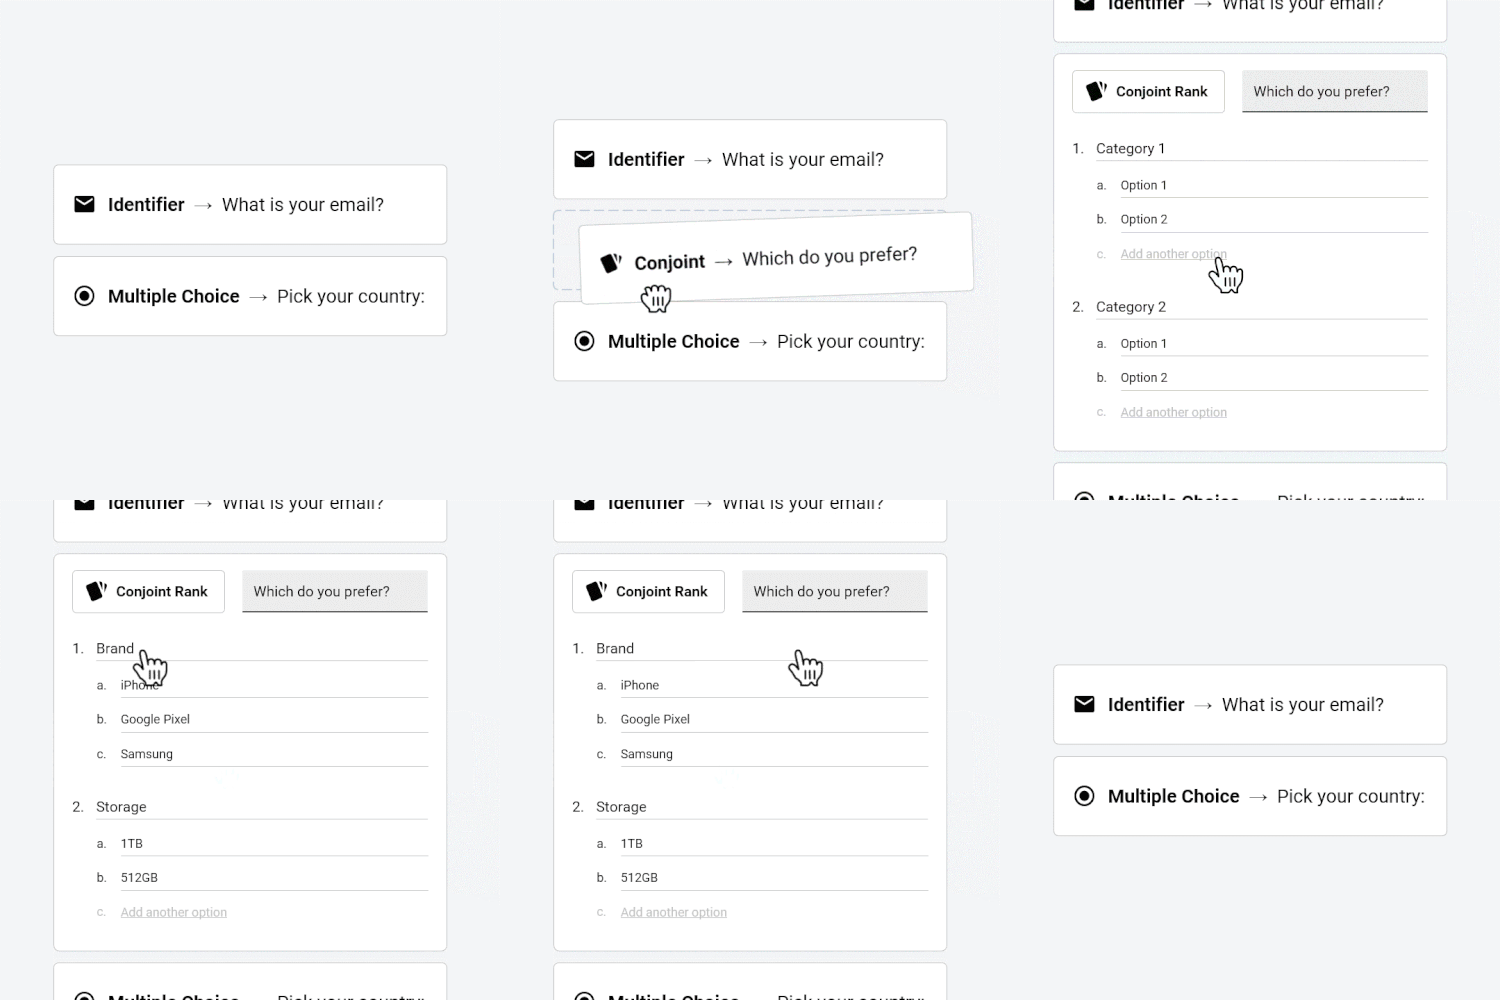
Drop a conjoint analysis section into your survey, mix with any other question type, and the calculator tells you how many participants your survey needs.
Automated results with Hierarchical Bayes
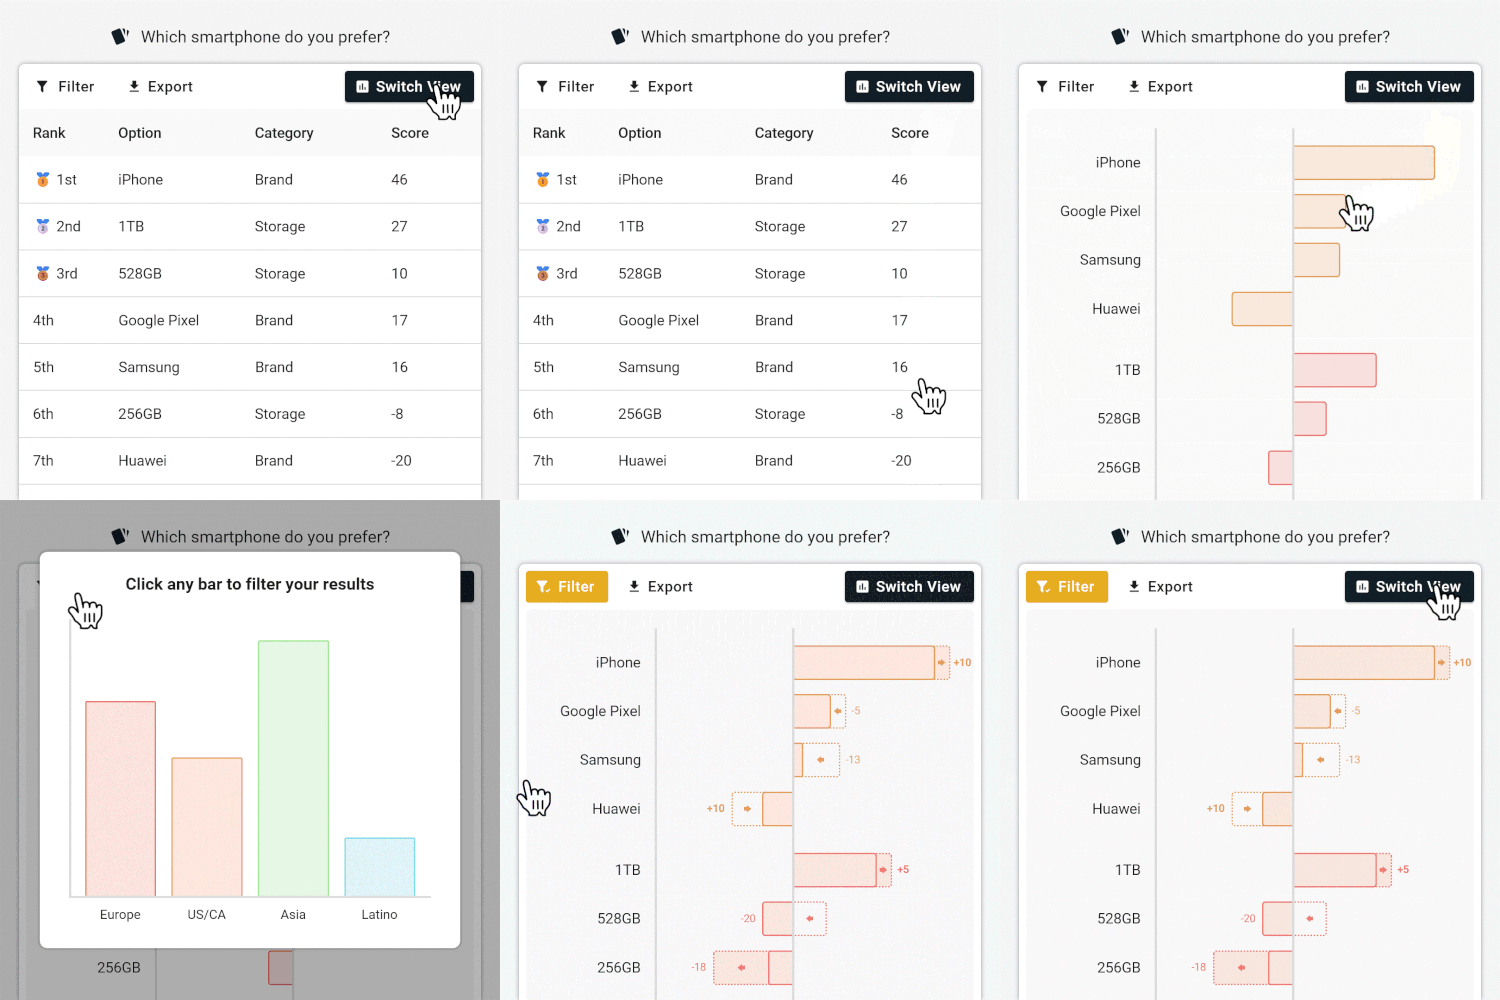
Respondent votes turn into results instantly, with part-worth utilities calculated from a Hierarchical Bayes Multinomial Logit model. Attribute importance charts sum to 100%, and every chart can be filtered in just one click.
Bring your own participants and analysis data
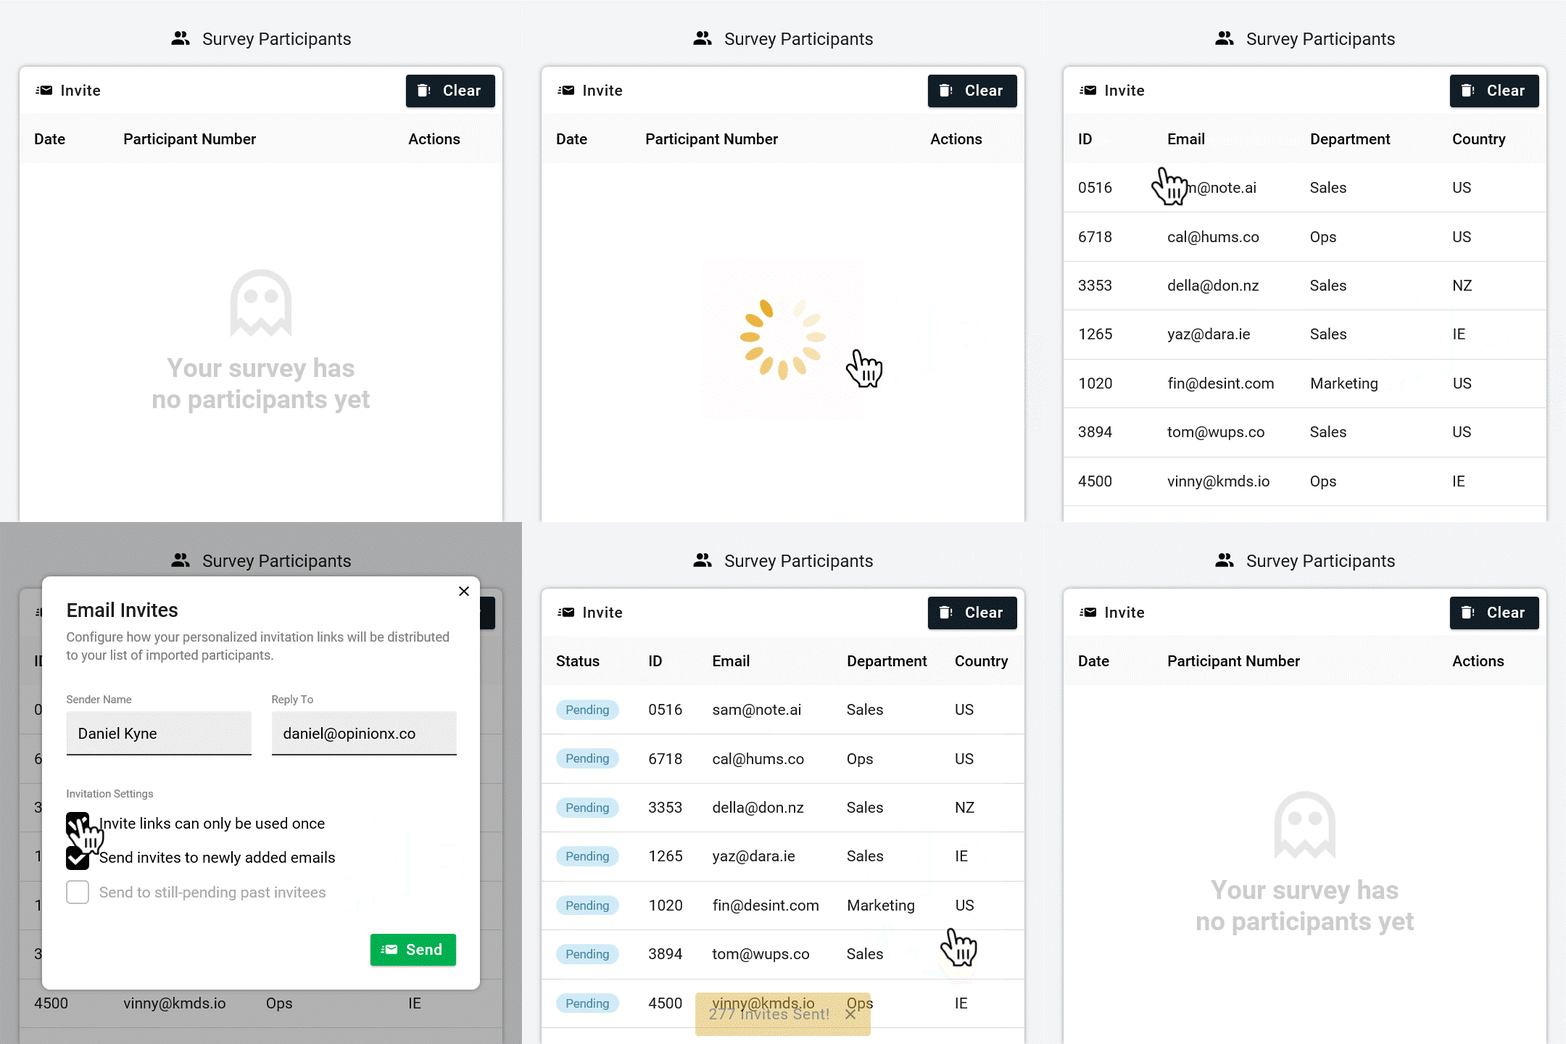
Survey your own customers or employees, attach what you already know about them (like pricing plan, seniority, or region) through hidden fields or import, and analyse your conjoint results by those fields to compare differences by group.

Keep unrealistic profiles out of the survey
Profile Logic sets which options can't appear together to prevent unrealistic combinations. Add a custom "none of the above" button for Rejection Rate analysis that shows what makes people walk away.
Test a conjoint survey
👇 Vote through the interactive demo and view the live results afterwards 👇
All the conjoint reports you need, generated automatically from your survey results
Easily switch between a range of charts, with automated price analysis, interactive simulator, and marginal willingness-to-pay analysis available on every OpinionX pricing plan.

Preference Chart
Category importance as percentages summing to 100, plus every option's relative score colour-coded by category. The default view.

Ranked Concepts
Every possible combination of options, ranked by preference score, so the strongest bundle sits in one row instead of being a guess.

Scenario Simulator
Build a set of competing profiles and forecast the share, revenue and churn each would take, using each respondent's own utilities.

Marginal Willingness To Pay
How much more a customer would pay to change one thing about a baseline offer, such as $150 to go from 256GB to 512GB.
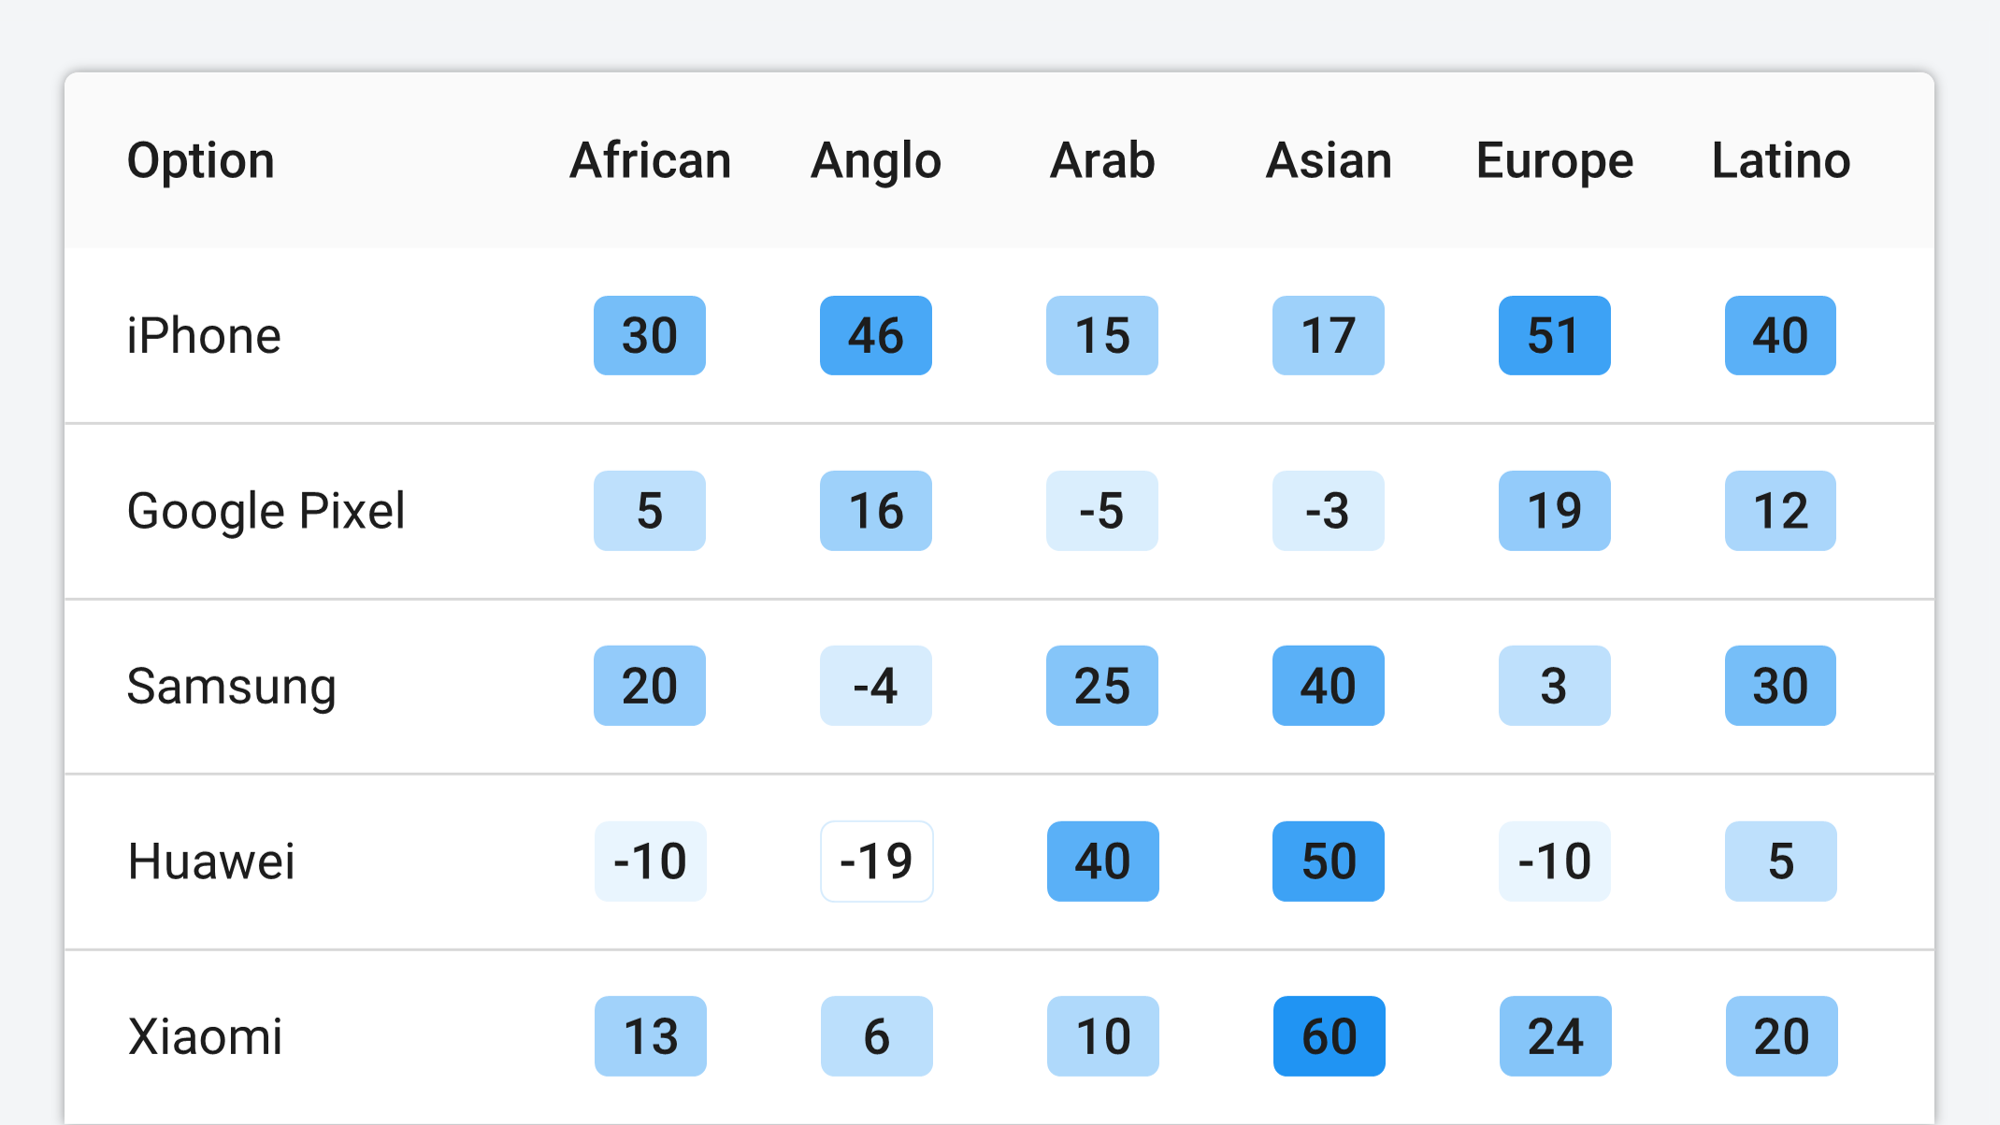
Conjoint Crosstabs
Every segment against every option in one heatmap table, so two customer groups' trade-offs sit side by side.

Cluster Analysis
K-means groups participants by how they voted, then shows what each cluster weights most.
Ready to run your first conjoint study?
Also built in

Partial completions keep the votes of anyone who quits mid-survey, viewable on their own.
Learn more ➡️

Live export to Google Sheets, so your own models run off the raw vote data as it arrives.
Learn more ➡️

Every profile set stacks cleanly on a phone screen, where most of your participants will be.
Advanced conjoint, included in every plan
✓ 25 participants per survey
✓ Unlimited surveys
✓ Unlimited researcher seats
✓ Full analysis & exports
✓ Unlimited participants per survey
✓ Unlimited researcher seats
✓ Advanced analysis & data enrichment
✓ Custom exports
✓ SAML SSO & MFA
✓ Private team folders
✓ White-labelling
✓ Procurement & prepaid experts
Learn more about Conjoint Analysis
FAQ
-
With a Hierarchical Bayes Multinomial Logit model. Each respondent's choices are modelled with multinomial logit, and a population-level prior pulls individual estimates toward the group mean, more so for people who answered fewer sets. The posterior is sampled by MCMC and the mean becomes each person's part-worth utilities.
-
The built-in calculator uses N = (O × E) ÷ (P × S): options in your largest category, times target exposures, divided by profiles per set times sets per participant. Exposures are fixed at 160, 240 or 400 for the calculator's "minimum", "safe" and "robust" settings, so you get the number before sending anything.
-
Yes. Conjoint Rank is a block, so a survey can carry a screener, a MaxDiff, a Van Westendorp question and a conjoint in one flow, with one results page and one set of segments across all of them. Several platforms allow one advanced method per survey; OpinionX doesn't limit it.
Run your first conjoint study today
Pilot all conjoint analysis features and all analysis features with a free account.