
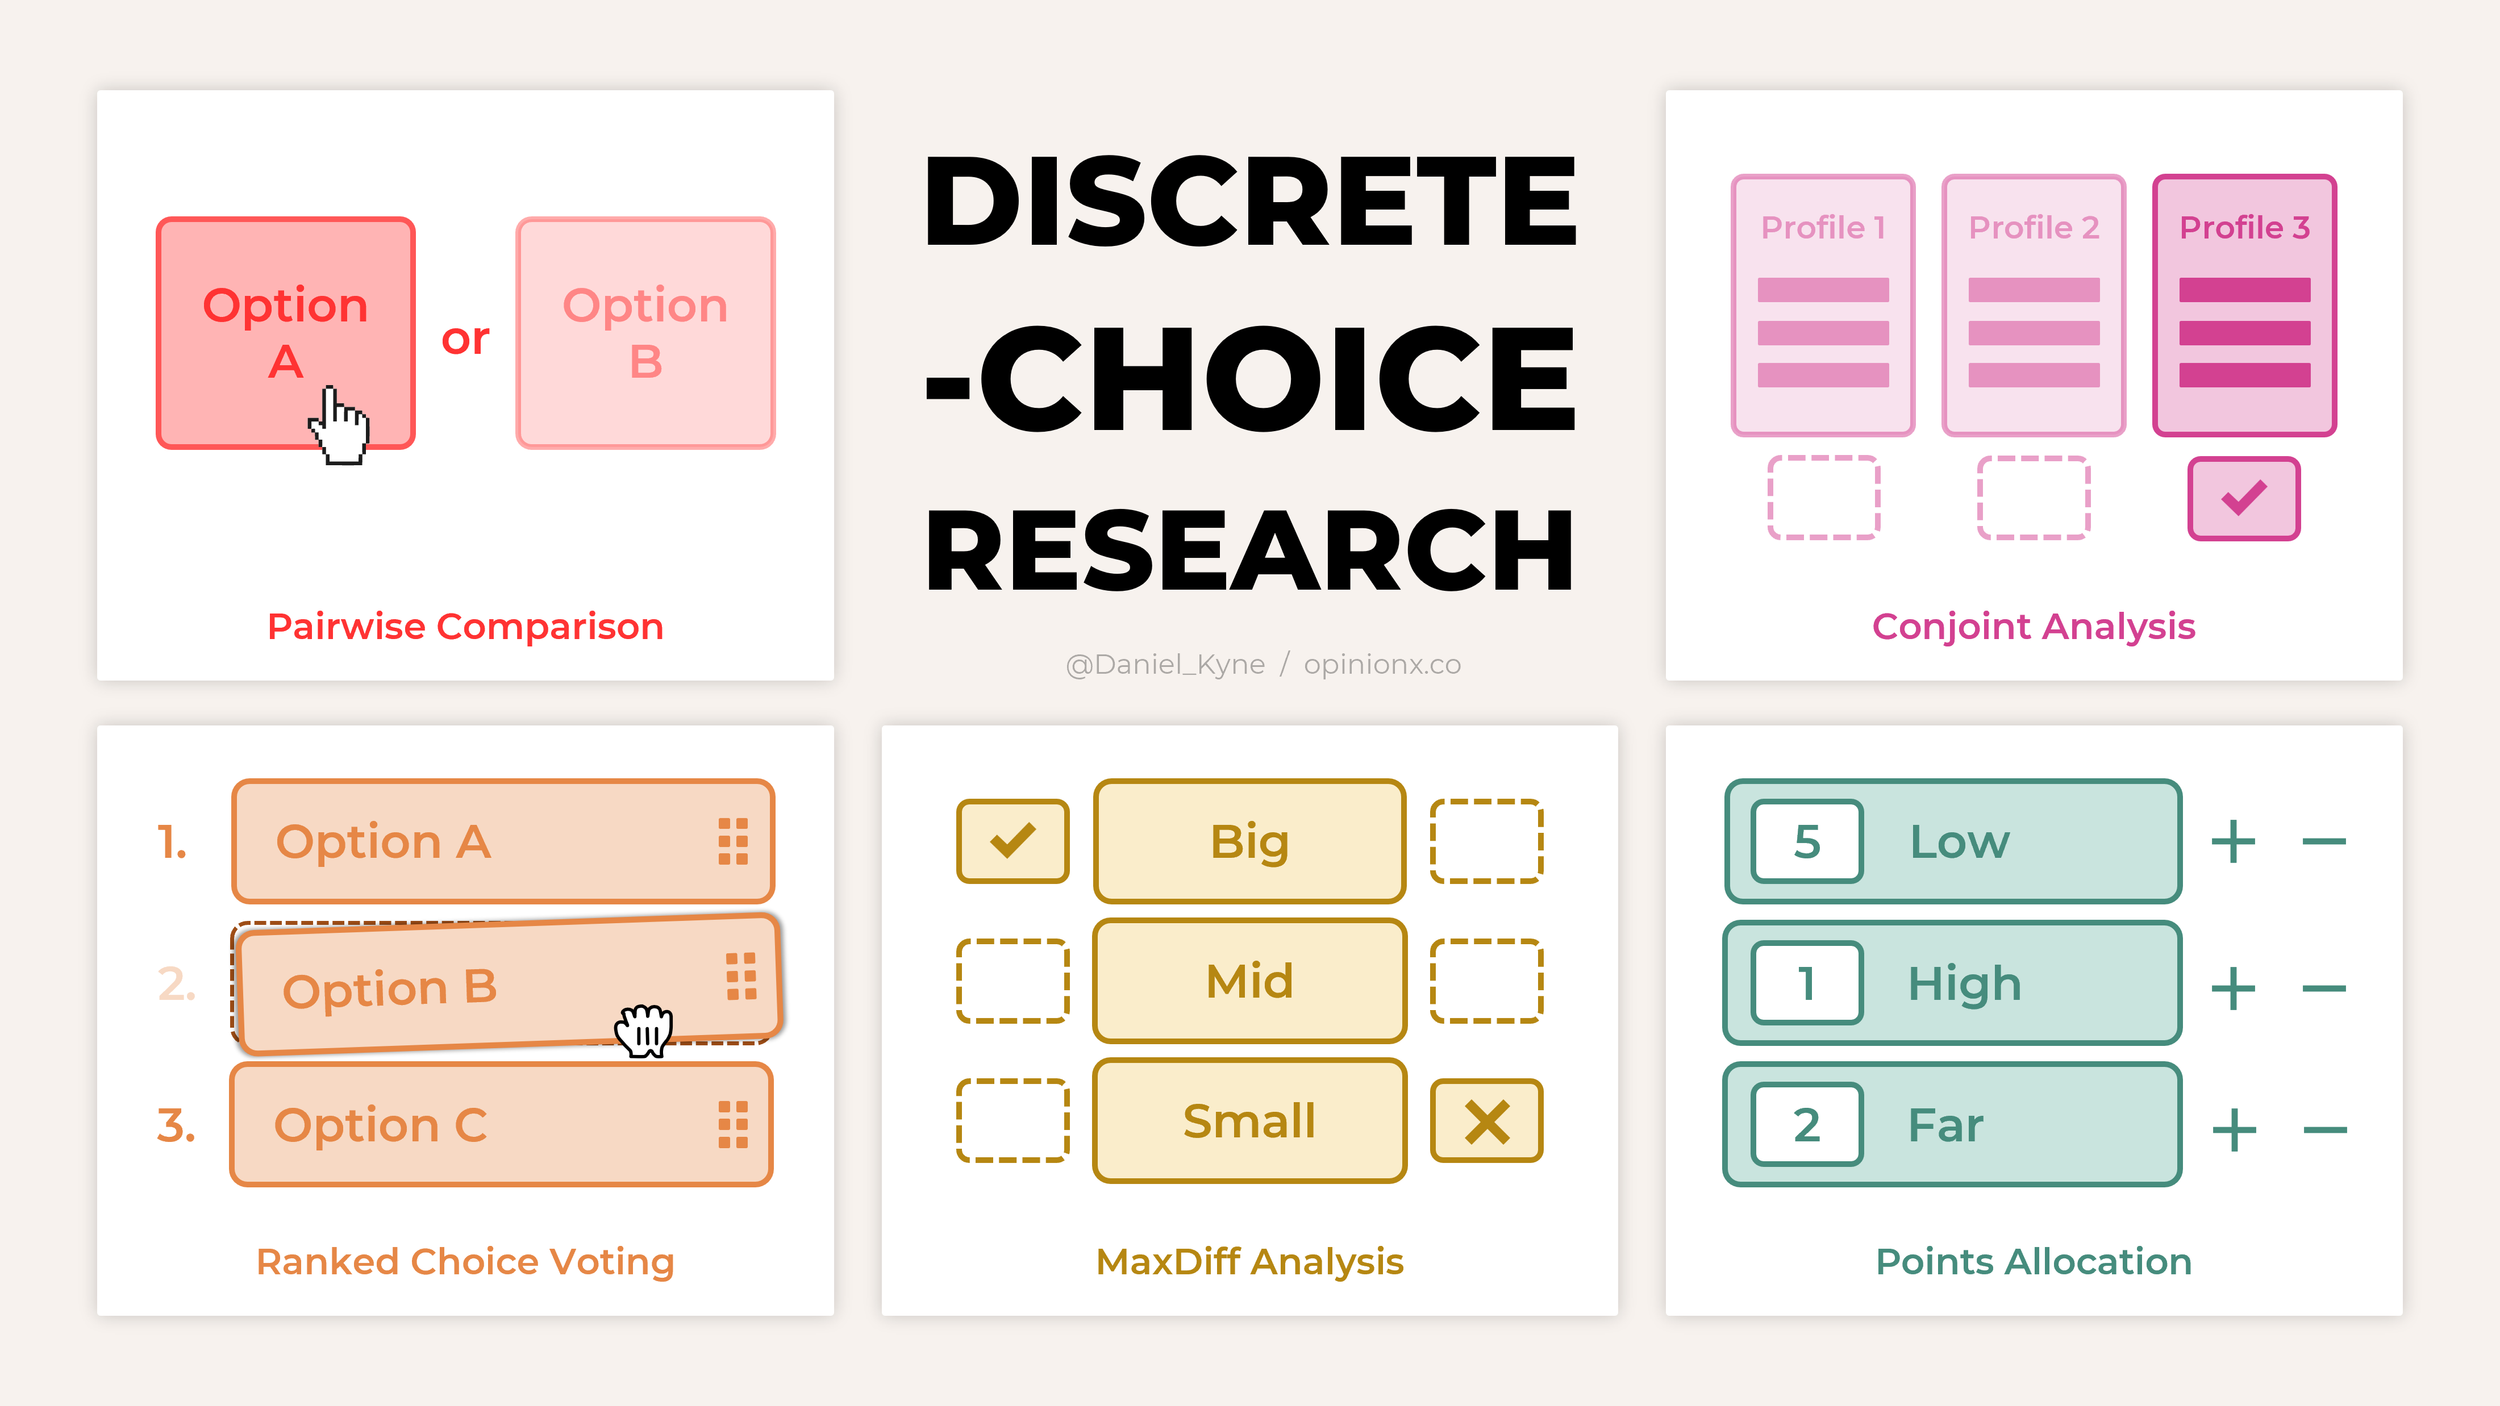
“A discrete choice model is any survey method that asks people to compare options and pick between them, then uses those decisions to estimate what they actually value. Conjoint analysis is one type, not the whole category. This guide covers five formats, when each one fits, and how to pick between them.”
Large technology companies use these methods for user research and pricing studies. Outside market research, most researchers have never run one.
Contents
What is a discrete choice model?
What is discrete choice modeling used for?
When to use these methods
Which survey formats count?
Which format should you choose?
Worked examples
What is a discrete choice model?
A discrete choice model is any survey method that asks people to compare a set of options and make decisions based on their personal preferences and priorities. Analysing a large number of those individual decisions lets you model how people choose and what matters most to them.
Many survey types fall under this umbrella, from simple head-to-head voting on two options at a time to formats like conjoint analysis, where participants choose between profiles made up of different combinations of attributes such as price, colour or size.
What they all share is in the name. They present lists of distinct options (discrete) for participants to pick from (choice) and use the results to estimate how people would behave in similar real-world situations (model).
The underlying statistics go back to Daniel McFadden, who won the 2000 Nobel Prize in Economics for developing the theory and methods for analyzing discrete choice. The random utility model underneath it is what makes the estimates work.
Conjoint analysis is not a synonym for the category. Conjoint is one type. This guide covers five.
What is discrete choice modeling used for?
Researchers measuring preferences often fall back on rating scale questions:
"Rate your satisfaction with ____ from 1 to 5 stars."
There's a major flaw in that approach. Rating scales let people give everything the same score, and that's one of the most common outcomes. Every option ends up looking equally important, which makes it nearly impossible to tell what people actually care about.

Central tendency bias and survey straightlining are the technical names for what goes wrong.
Choice-based methods measure preferences better because they force trade-offs. Participants compare options side by side and choose the one that best reflects what they want. That mimics real decision-making, where you weigh pros and cons and commit, instead of saying "everything matters".
When to use these methods
These methods work best when you're ranking options that have no obvious or objective score.
Ranking movies by Rotten Tomatoes rating or songs by Spotify streams is easy. The harder questions are subjective:
What product features do users care about most?
What frustrations are most painful for your customers?
What benefits do clients seek most from our services?
Those messy, nuanced questions are where these methods earn their place, because they replace a vague rating with a structured answer built from how people actually decide.
Six lenses product teams measure
Preference. What do users like most?
Pain. What problems are most frustrating?
Value. What features are worth most to users?
Risk. What concerns or worries users the most?
Friction. What barriers stop users from taking action?
Motivation. What drives users to take action?
Six research projects that use them
Customer segmentation. Understand which types of customers care most about solving specific pains, using needs-based segmentation.
Roadmap prioritisation. Plan what to build next by identifying users' top unmet needs.
Assumption testing. Validate or disprove your hypotheses about user preferences.
Value analysis. Identify which features your users perceive as most valuable.
Message testing. Find out which messages your target audience picks.
Pricing studies. Quantify which features users will pay for, and how much.
Which survey formats count?
Five formats cover almost every use.
| Format | What participants do | List length | What it reveals |
|---|---|---|---|
| Conjoint analysis | Pick a preferred profile from 2 to 5 | Multi-attribute | Which attributes matter, and which options inside them |
| MaxDiff analysis | Pick best and worst from 3 to 6 | 10+ options | A full ranking, gathered fast |
| Pairwise comparison | Pick one of two | 10 to hundreds | A full ranking, with the lightest task |
| Ranked choice voting | Order the whole list | 3 to 10 max | Collective priority order |
| Points allocation | Distribute a pool of points | 3 to 10 | Intensity of preference, not just order |
Method 1: Conjoint Analysis
Conjoint analysis fits when the options you're ranking have multiple layers of information.
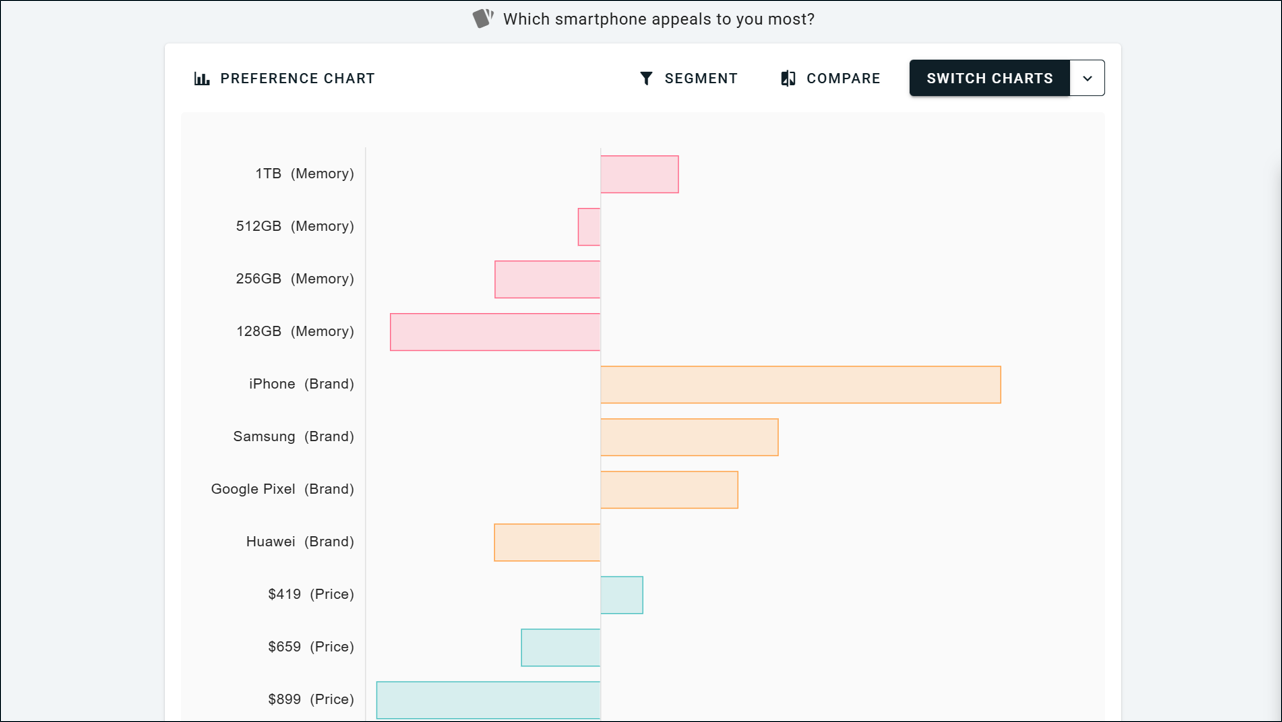
Take smartphones. Each phone has attributes like brand, storage, colour and battery life, and within each attribute there are options. iPhone, Samsung and Google Pixel are options inside the Brand attribute.
Conjoint answers two questions at once:
Which attributes influence people's decisions the most?
Which specific options within each attribute are preferred most?
How does conjoint analysis work?
Participants see sets of 2 to 5 profiles at a time, each containing one option from every attribute. They pick the profile they prefer in each round. After a few rounds there's enough data to estimate which attributes matter most and which options drive the decisions.
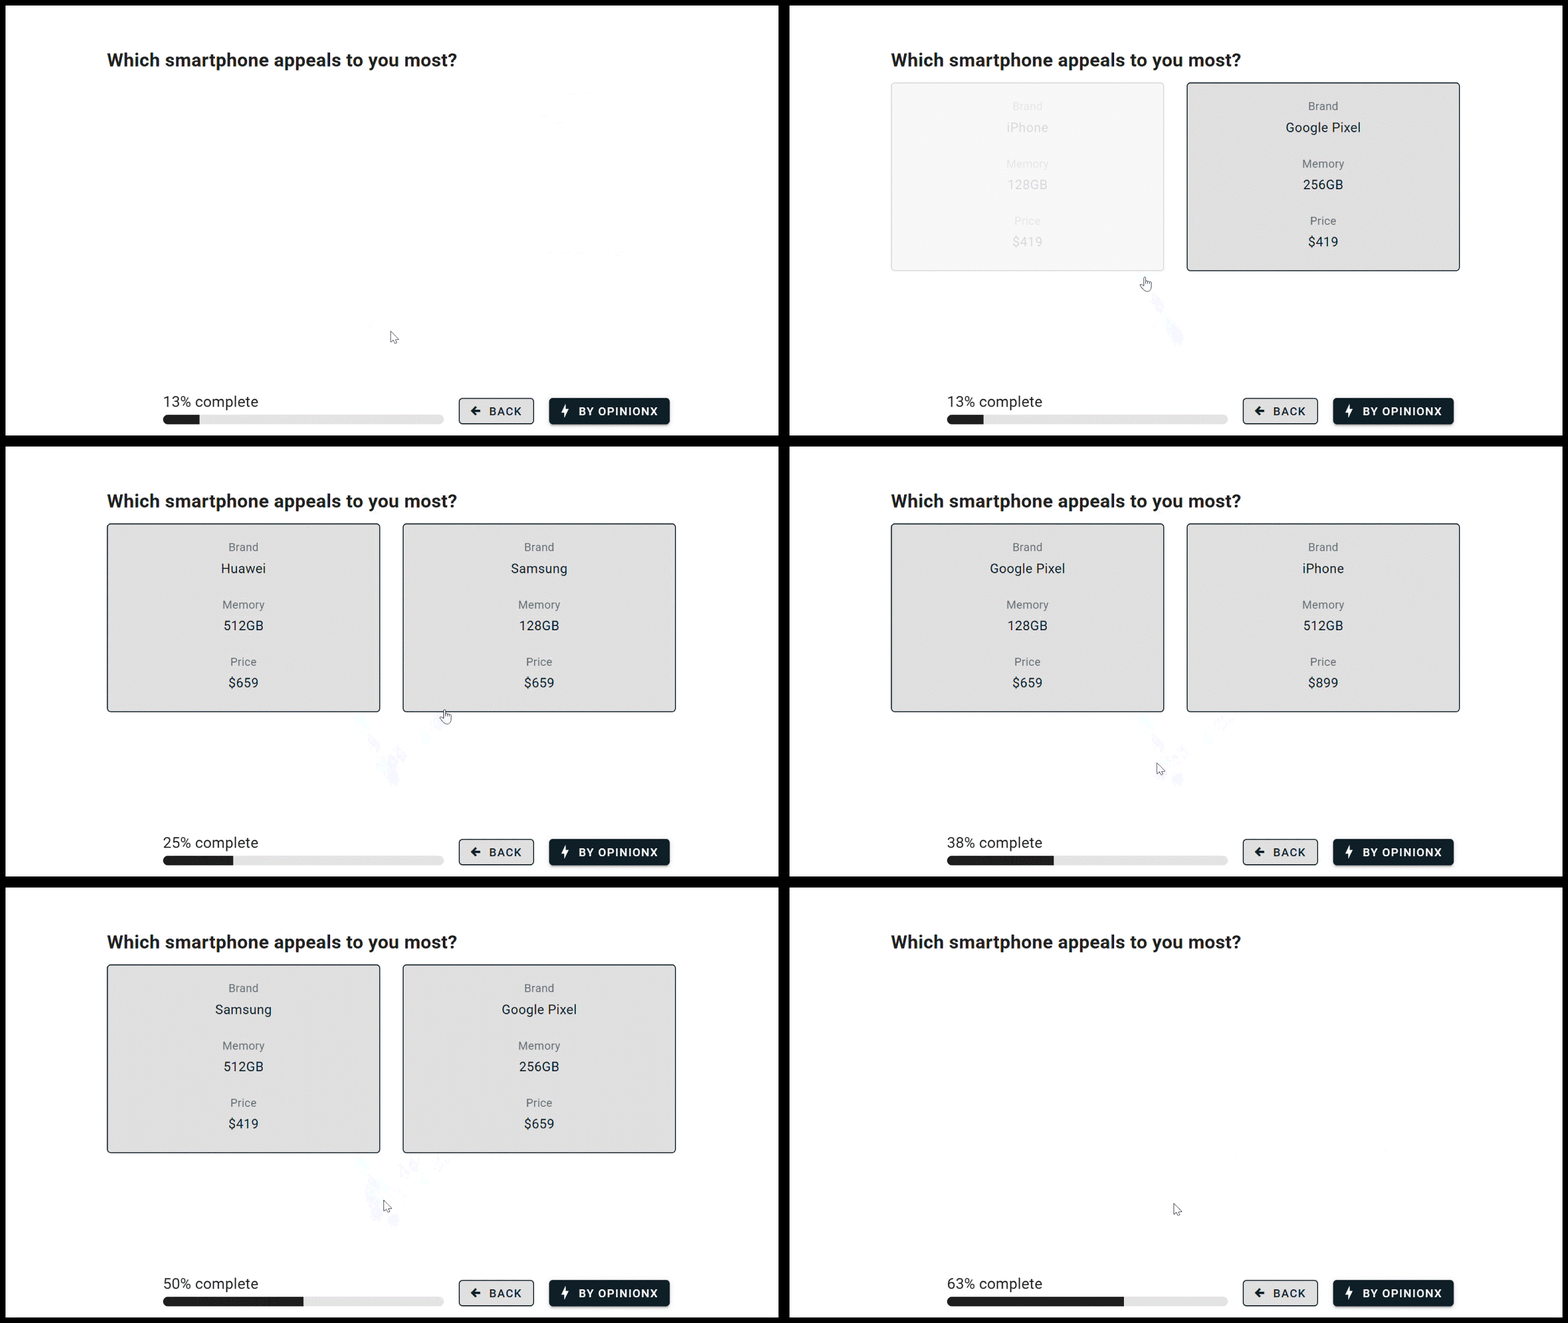
It sounds complex, and it's straightforward to set up. The screenshot below shows the survey from the example above: a set of attribute names with the options for each listed beneath.

Going deeper on conjoint:
Most conjoint tools are expensive, and the full tools breakdown covers the current figures.
On OpinionX, conjoint analysis sits on the free tier alongside every other method, capped at 25 participants per survey. Paid plans start at $900 a year and remove the cap.
Method 2: MaxDiff Analysis
MaxDiff analysis, formally best-worst scaling, shows 3 to 6 options at a time and asks participants to identify the best and worst in each set. Aggregating the responses ranks every option from highest to lowest preference.
The "best" and "worst" labels can be changed to whatever suits the study: Most and Least Liked, Top and Bottom Priority, Love and Hate.
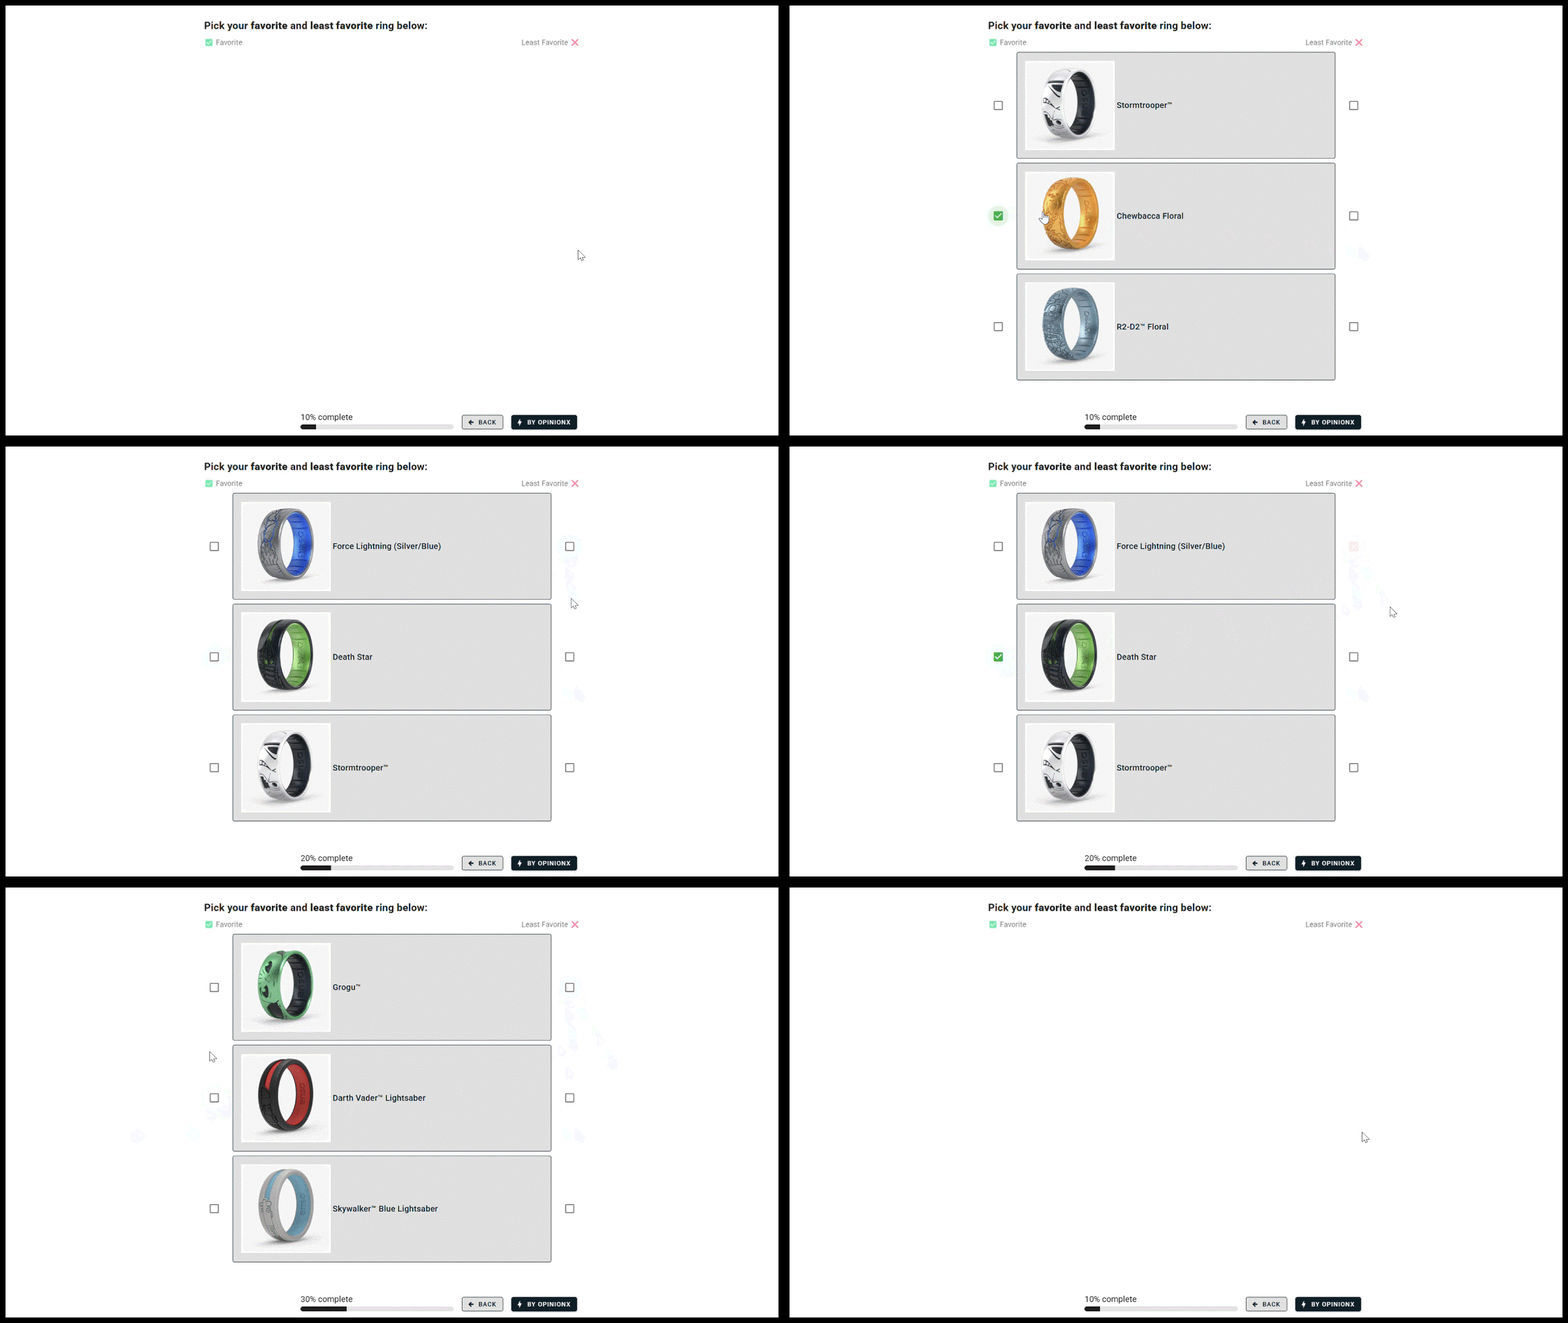
MaxDiff handles long lists well by breaking them into manageable chunks. Product teams use it to involve customers in voting when prioritising features or problem statements.

MaxDiff is straightforward to run and has a reputation as an advanced research method, so it tends to be priced accordingly. Our comparison of MaxDiff tools covers what the alternatives charge and which of them let you test before buying.
Method 3: Pairwise Comparison
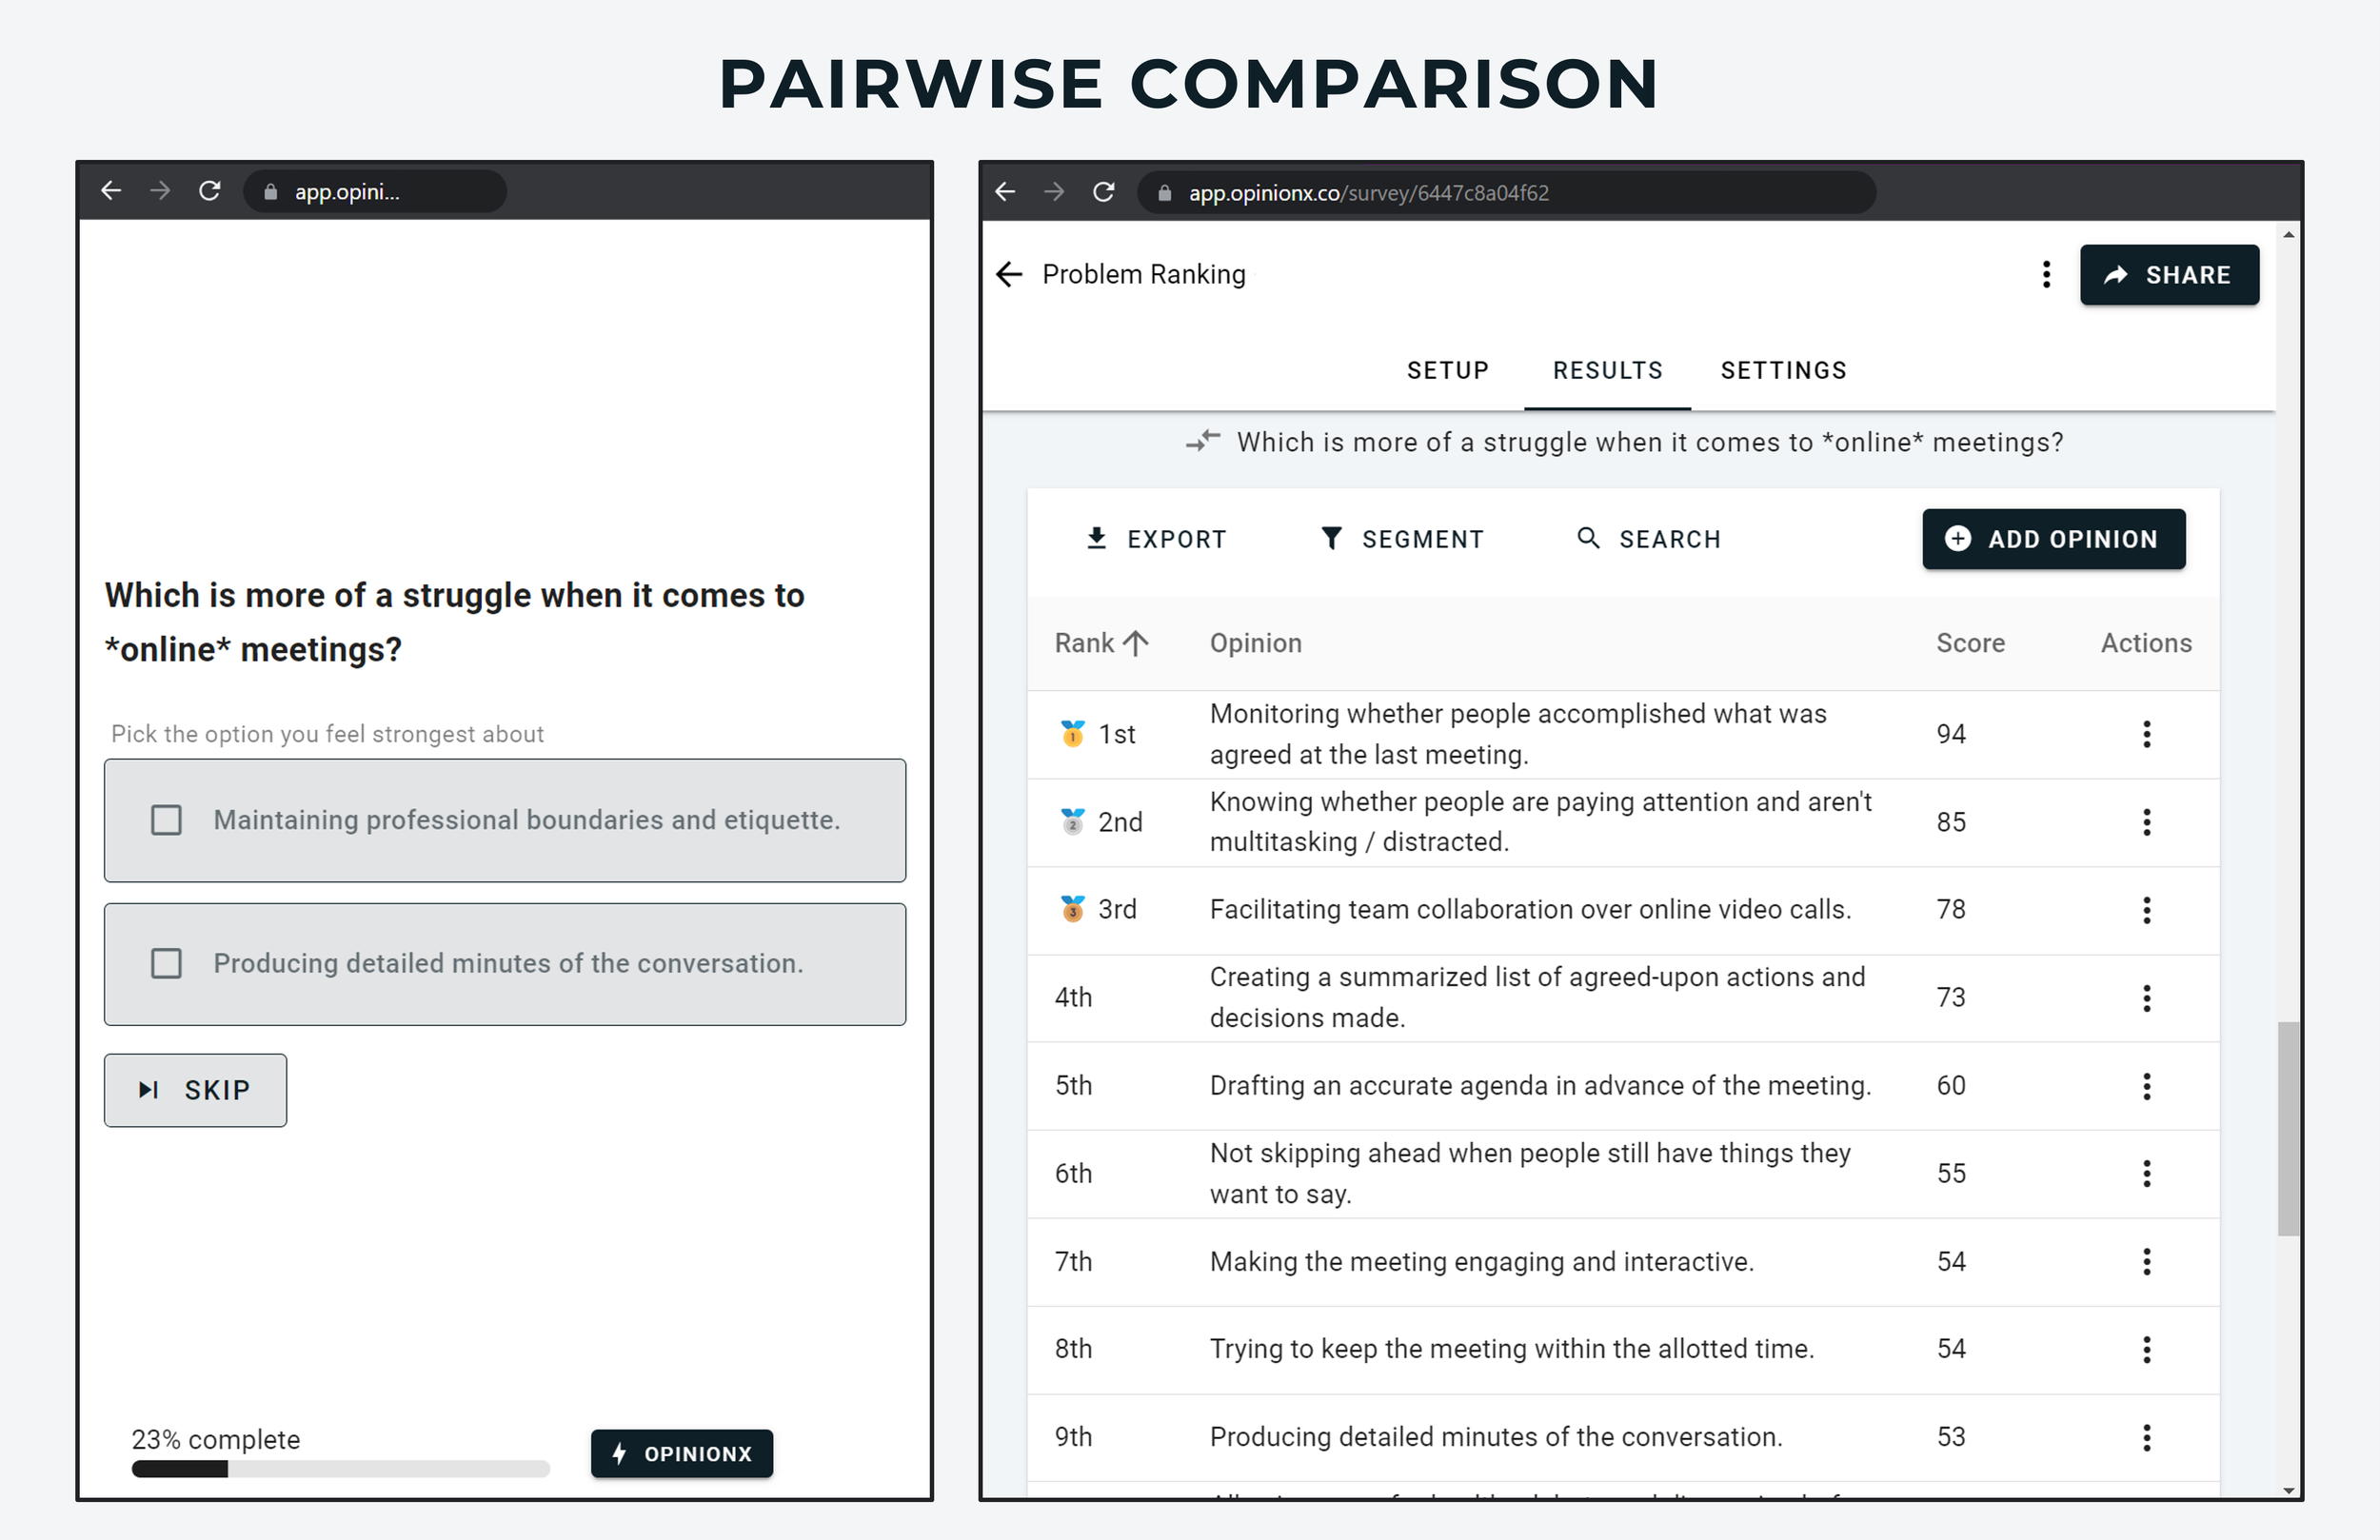
Pairwise comparison is the simplest discrete choice method. Participants compare two options at a time and choose the one they prefer.
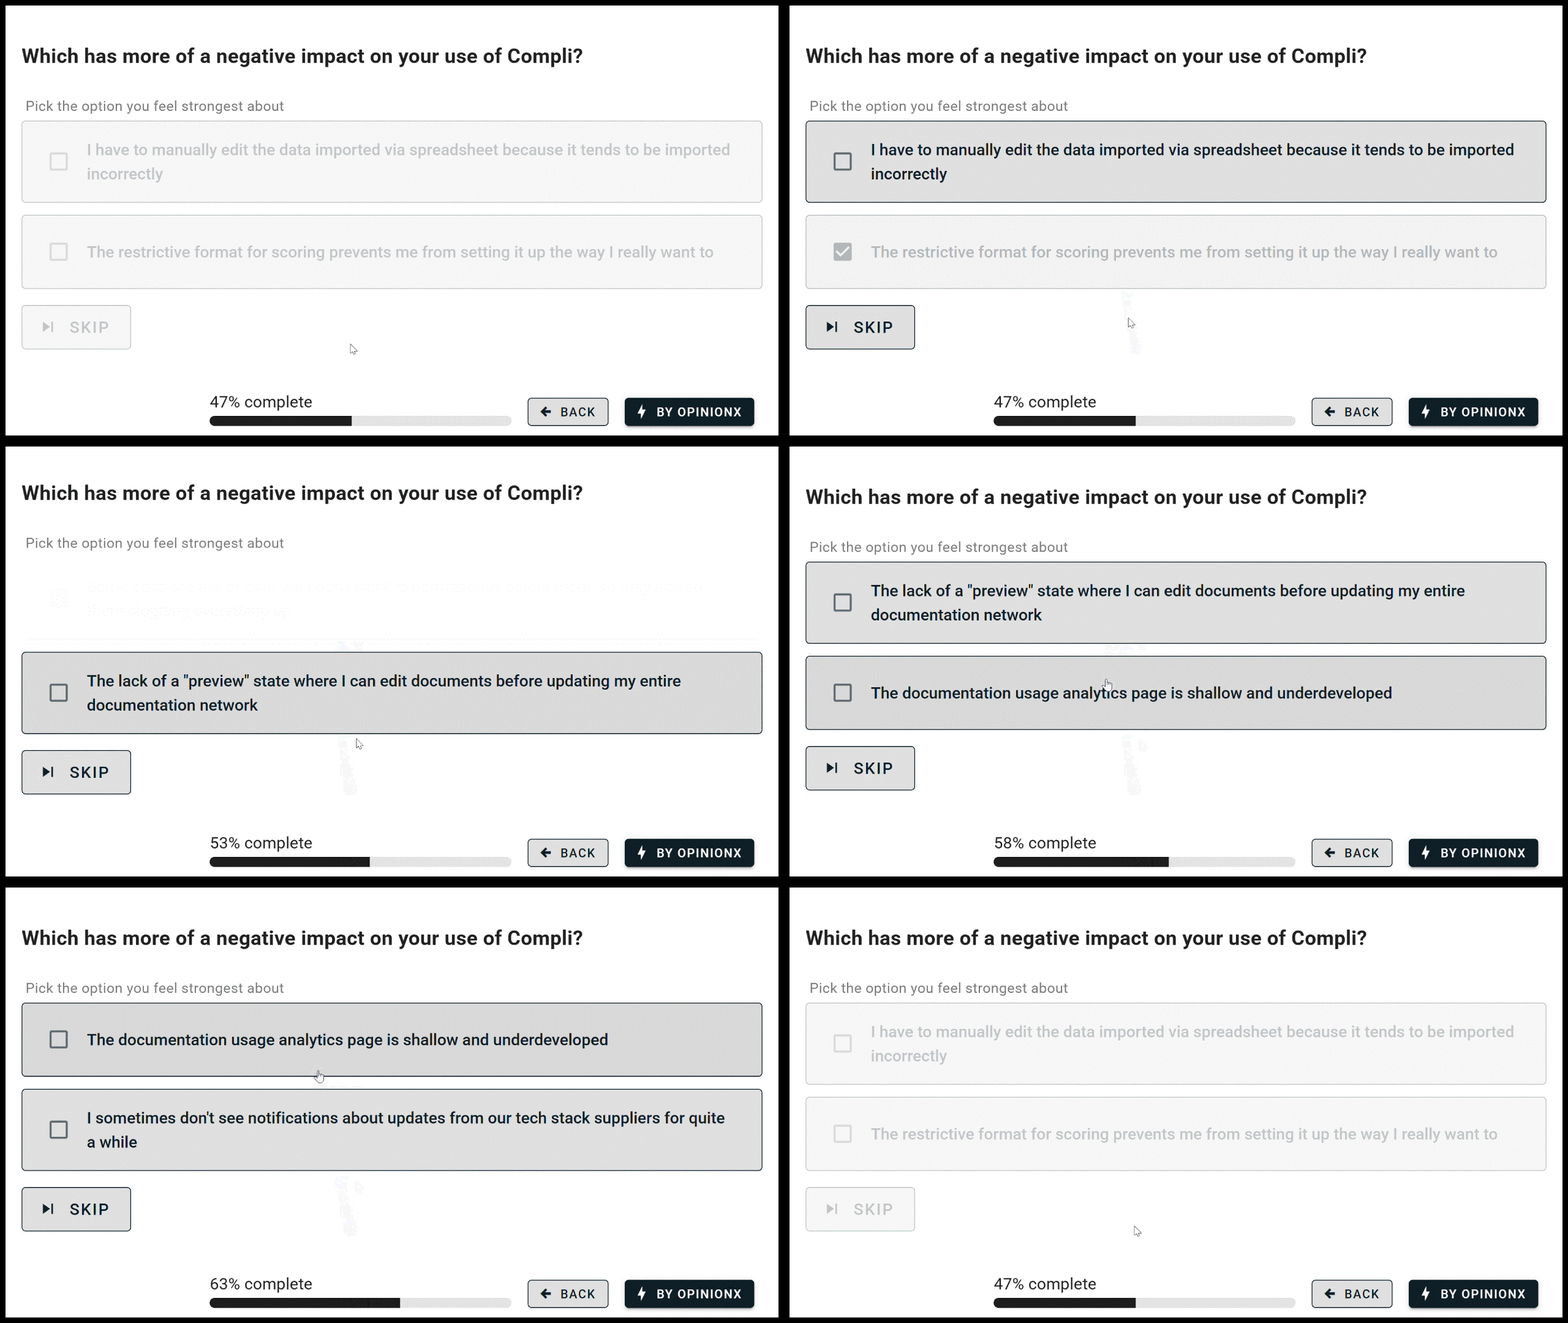
The binary format is fast and scales to long lists. It suits any situation where drag-and-drop voting or rating scales would be too long or overwhelming.
Results are analysed using a win rate, meaning the percentage of pairings each option won. The formal model behind it is the Bradley-Terry model, published in 1952.
Method 4: Ranked Choice Voting
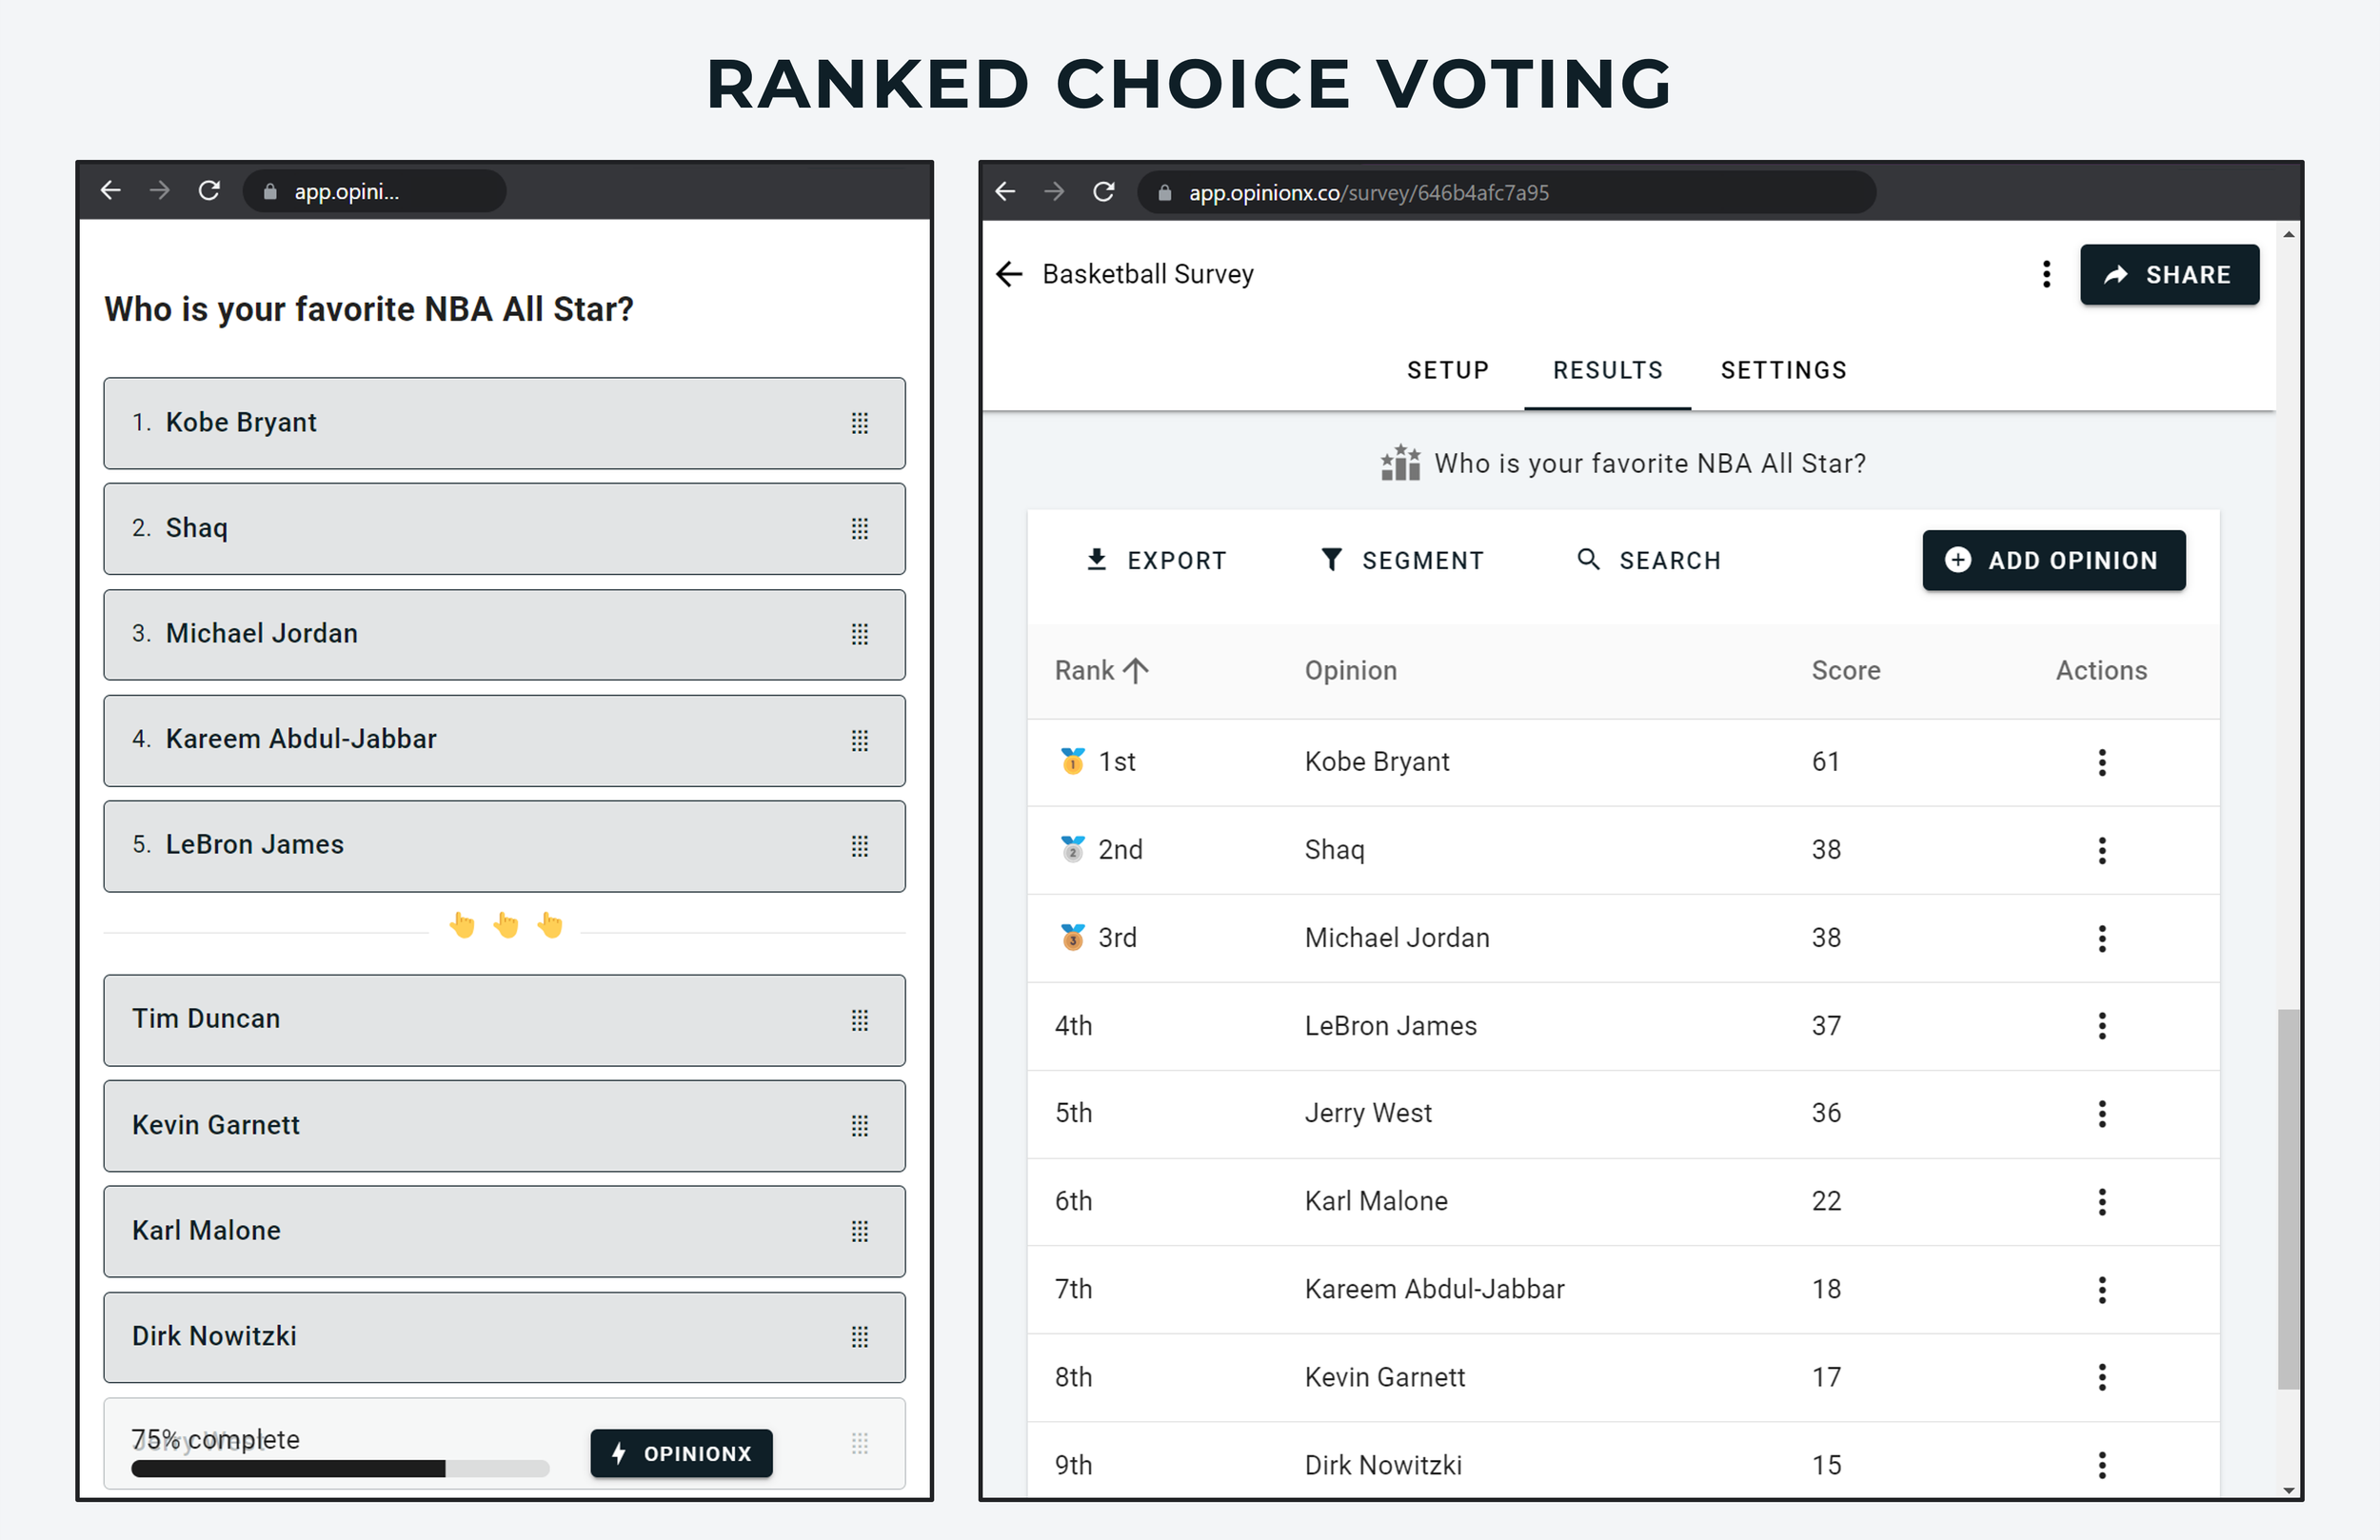
The best-known format for ranking preferences, and the one most people have met through ranked-choice elections. Participants rank the full list in order of personal preference.
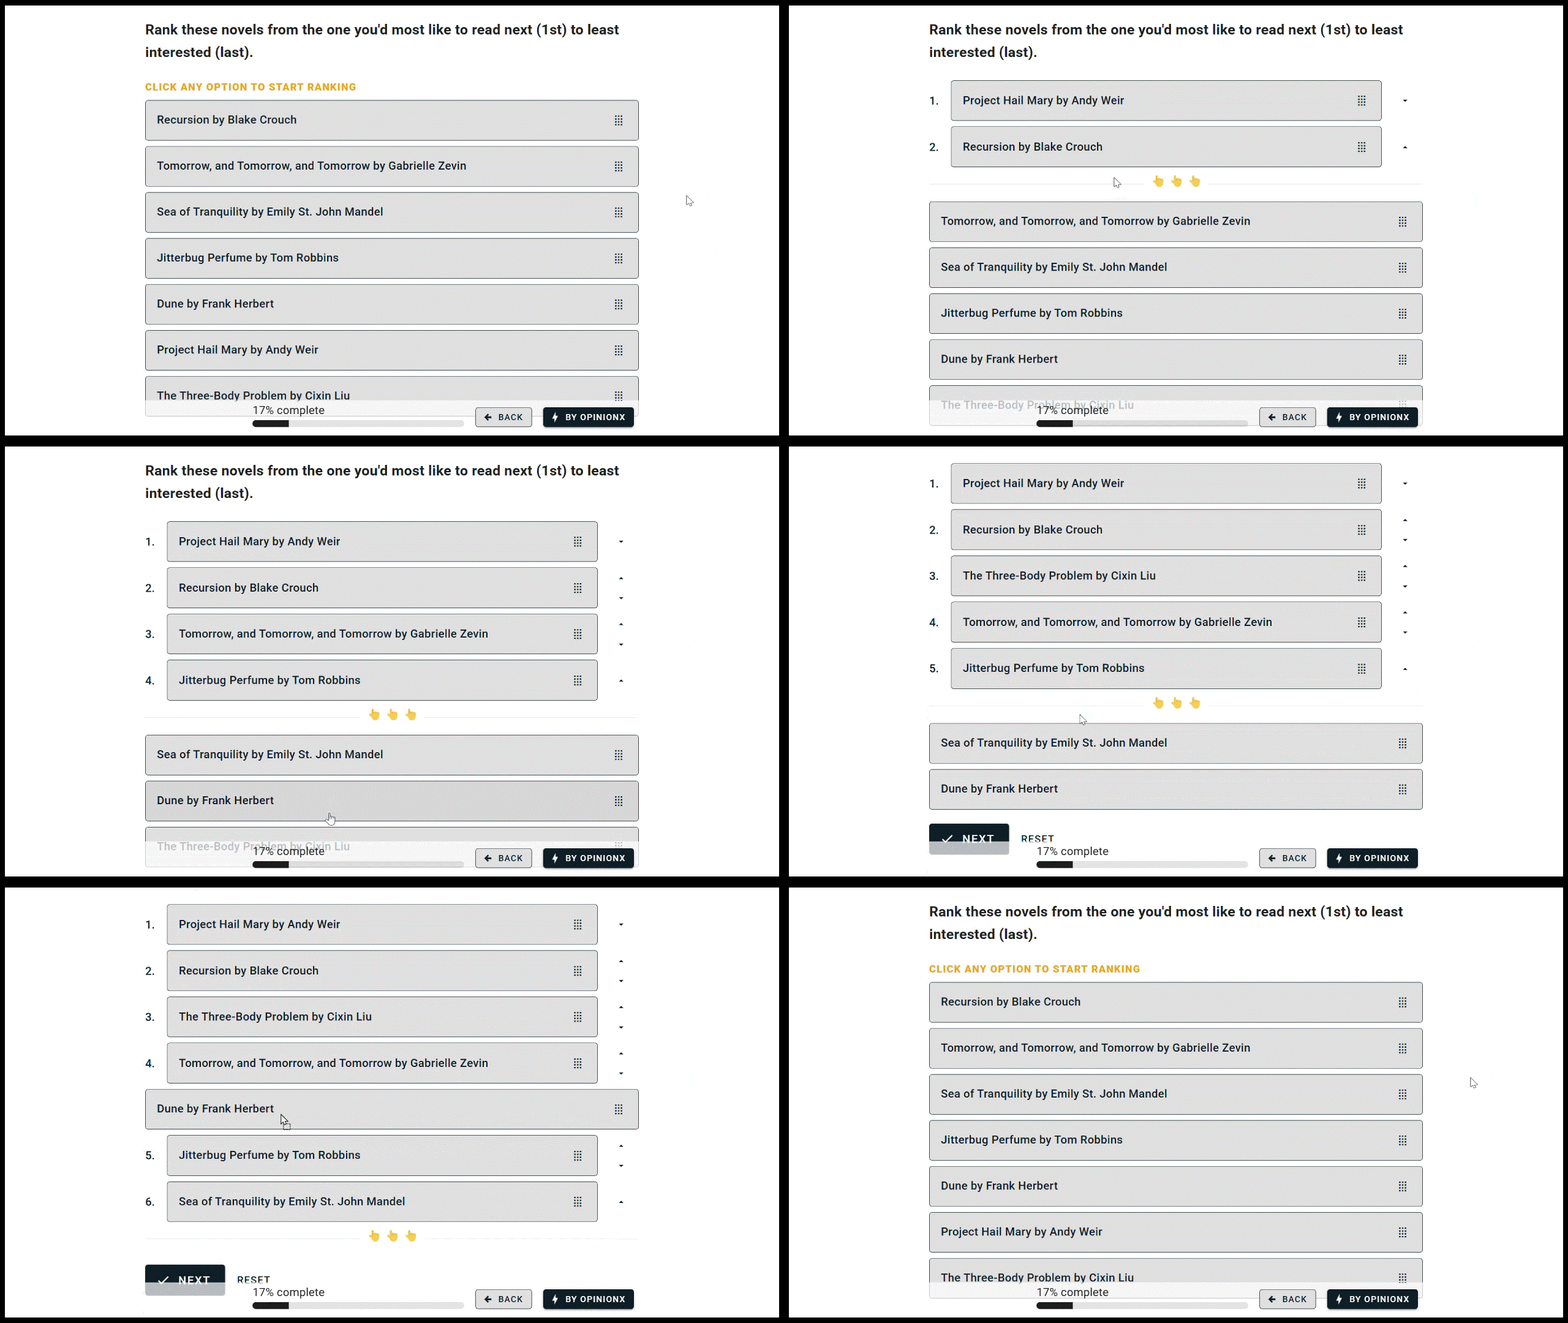
Only use it if your list has no more than 10 options, and ideally 3 to 6. Longer lists are hard to order in one go, especially on phones, and produce more junk voting.
Ranked choice voting is available on OpinionX as the "Order Rank" question type.
Method 5: Points Allocation
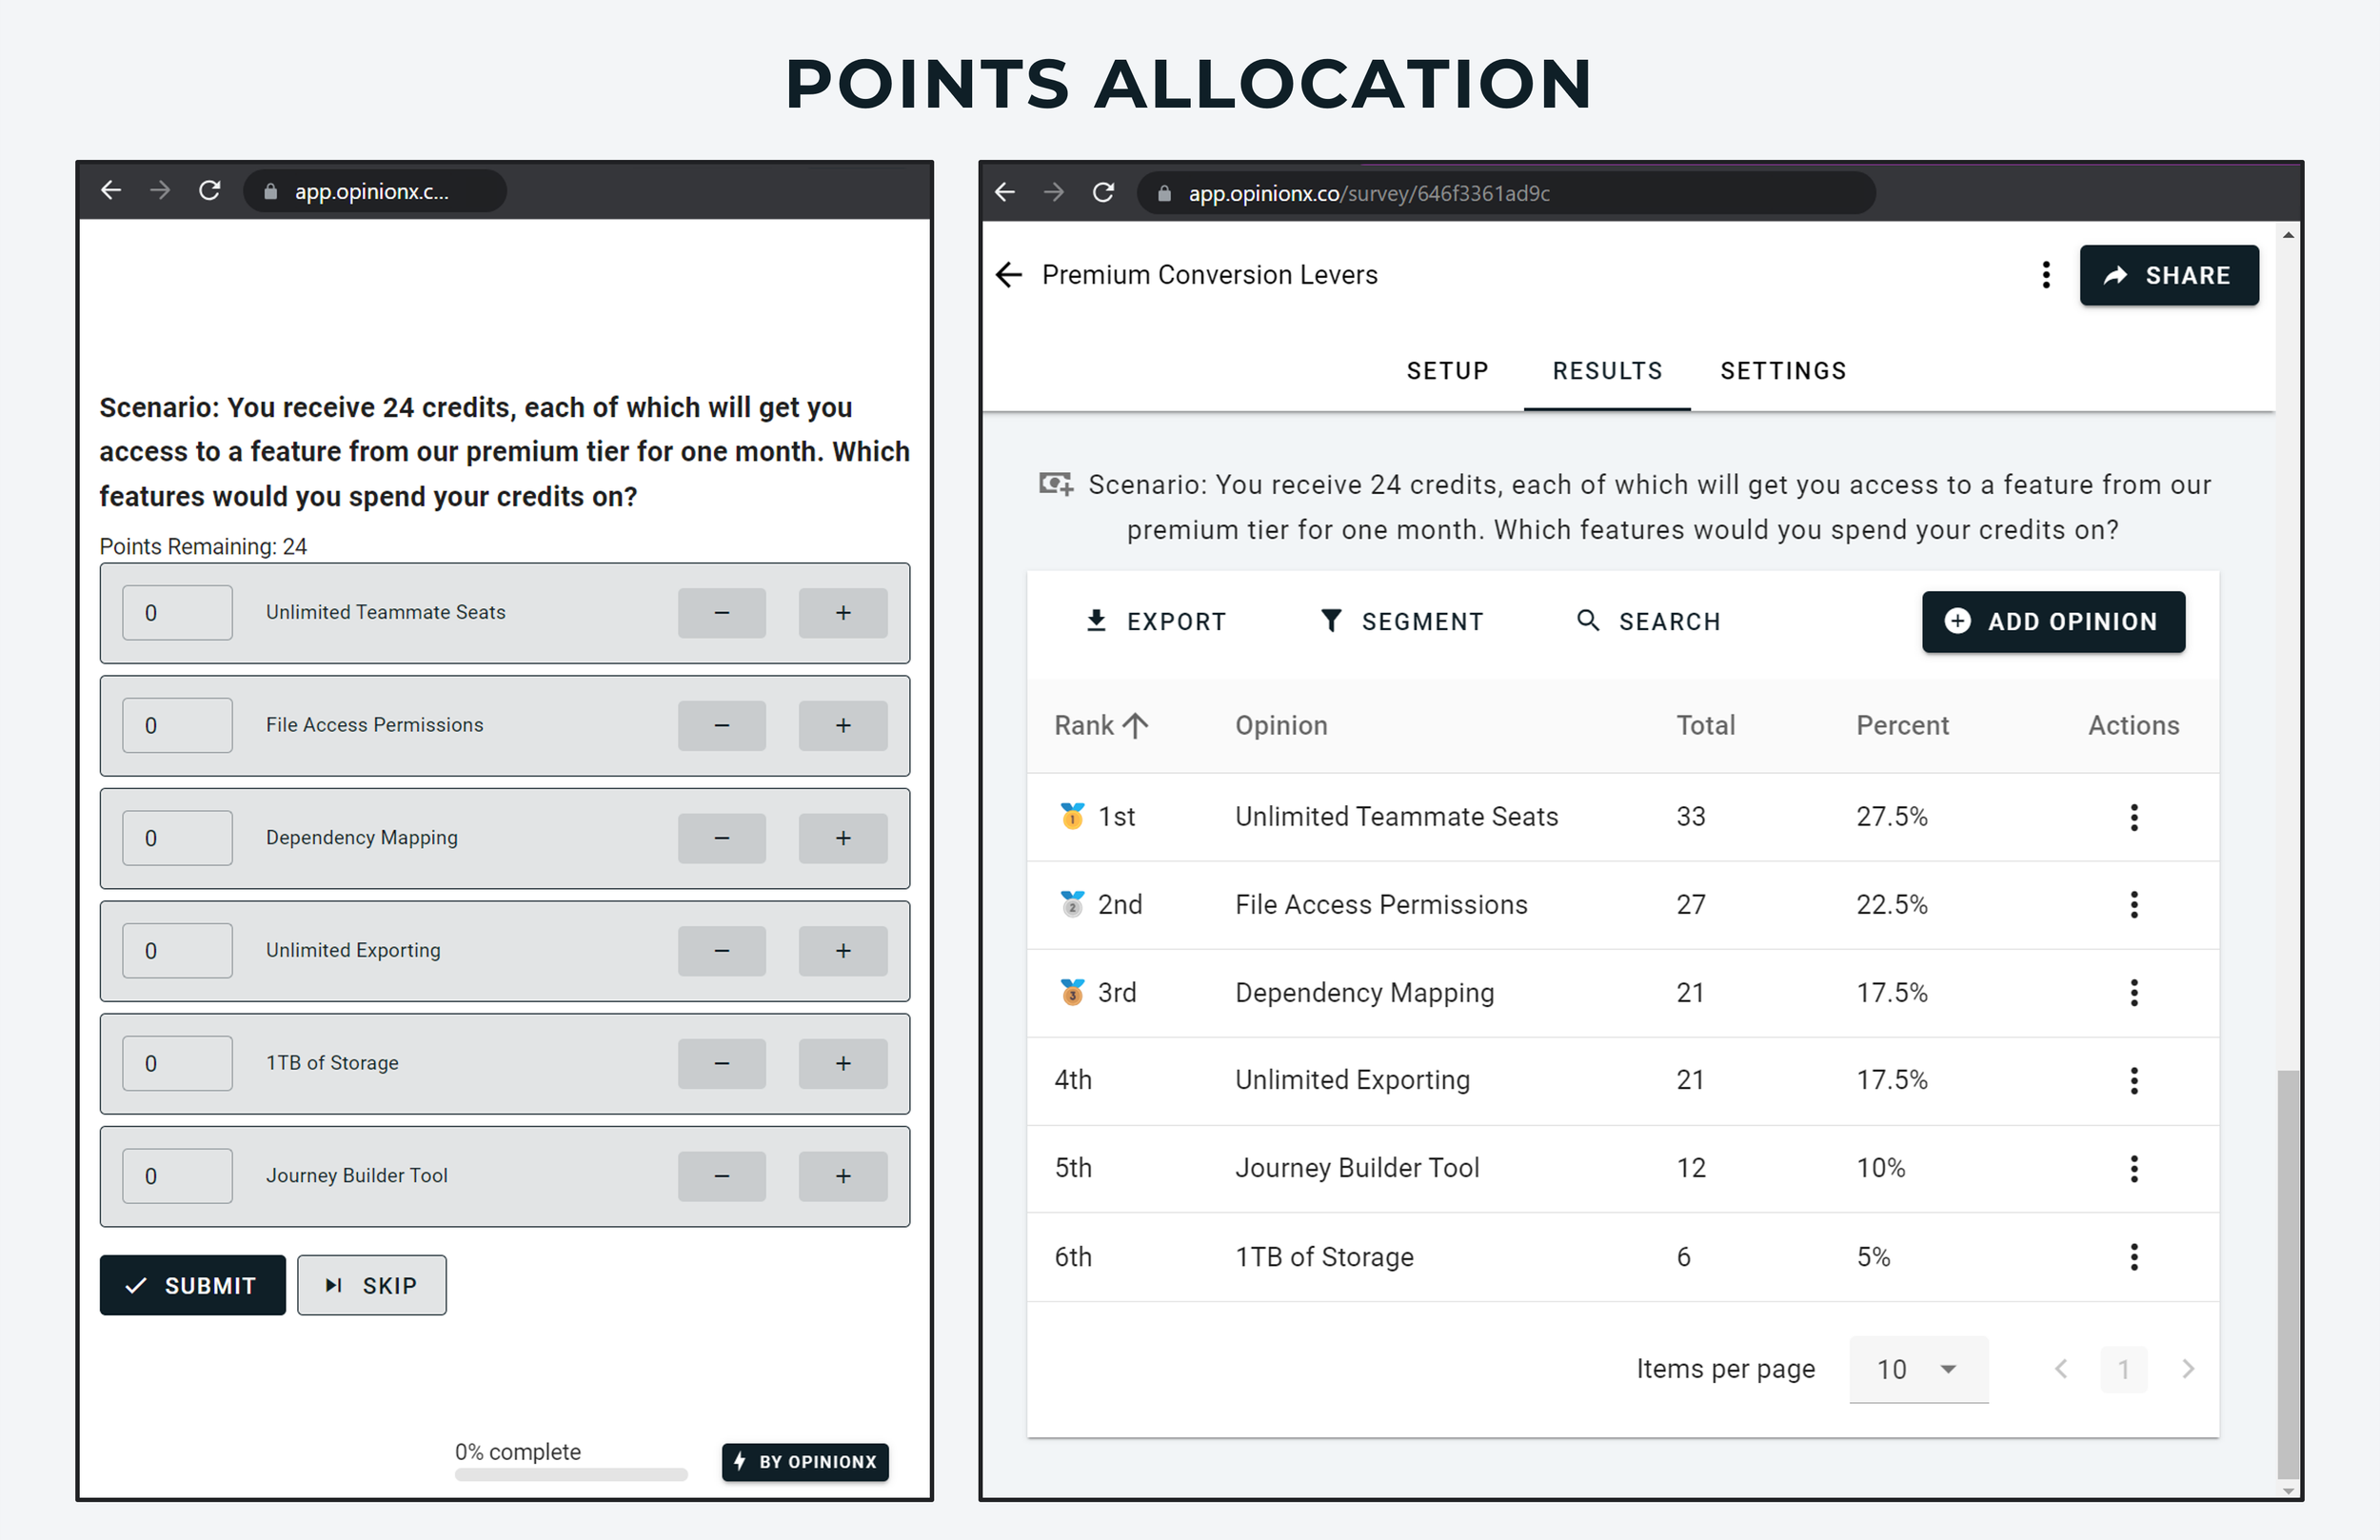
Points allocation gives each participant a pool of points to distribute across the list however they want. It suits budget allocation studies and any situation where you're exploring trade-offs between priorities.

Where ranked choice voting captures the order of preferences, points allocation captures the intensity.
Instead of ranking ice cream flavours Chocolate first, Vanilla second and Strawberry third, I could give 9 of my 10 points to Chocolate, 1 to Vanilla and 0 to Strawberry. That distribution says far more about how much each option matters to me than the order alone.
"Points Rank" is available on OpinionX with a custom number of points and as many options in the voting list as you want.
Which Discrete Choice Model should I choose for my ranking survey?
The five formats fall into three categories.
| Your situation | Use this |
|---|---|
| 3 to 6 options, you need the order | Ranked choice voting |
| 3 to 6 options, you need how strongly people feel | Points allocation |
| 10+ options, complex or wordy | Pairwise comparison |
| 10+ options, small participant pool | MaxDiff analysis |
| Categories that each contain their own options | Conjoint analysis, the only option |
Full list ranking
With only 3 to 6 options, points allocation and ranked choice voting are easiest. Points allocation shows the magnitude of a preference, where ranked choice voting only gives you the order.
Sampling exercises
For a longer list of 10+, MaxDiff and pairwise comparison are the strongest choices, and they're largely interchangeable.
If your options are complex or wordy, pairwise comparison keeps the task lighter for the participant. If you need a lot of data from a smaller pool of people, MaxDiff collects it faster by showing 3 to 6 options per screen instead of two.
Multi-variable scenarios
When you need to rank categories as well as the options inside each category, conjoint analysis is the only method that works.
Pricing plans for survey tools are a good example. Each plan offers the same feature list with different allowances: surveys per month (1, 10, unlimited), researcher seats (1, 3, 5, unlimited), participants per survey (100, 500, unlimited). Conjoint is the only way to rank those categories and their options in one survey.
Worked examples
Customer problem stack ranking
This guide exists because of what these methods did for us directly.
In early 2021, six months after launching OpinionX, we lost our only paying customer. We had interviewed 150+ people trying to work out what problem the startup should solve and clearly weren't making progress.
So we ran a pairwise comparison survey. We wrote a list of 45 problem statements and sent it to target customers we found in Slack communities.
Within two hours we could see that the problem statement we had built the whole website and product around ranked dead last. Five of the top seven problems were ones our MVP could already handle, so we pivoted everything onto those instead. Within a week of that survey we had our first paying customers.
The full account is in Customer Problem Stack Ranking.
Psychographic customer segmentation at Glofox
Thousands of gyms worldwide use Glofox to schedule classes, manage memberships, track attendance and automate payments, including both family studios and national franchises.
Francisco Ribeiro, a product manager at Glofox, was working on a new feature during the summer of 2021 and had already run user interviews to understand the need it would address. The problem was that no clear pattern emerged.
One customer would complain about not being able to track member engagement. The next would say engagement tracking was fine, and their real challenge was knowing whether members were churning.
Francisco ran a choice-based survey to measure which needs his customers felt most strongly about. By the end of that week he had found the cause of the confusion: the size of the customer's business determined the highest-ranked problem.
Using pairwise comparison, he split participants into groups by the size of their gym operations and read the ranked results separately for each segment. He then calculated the bottom-line financial impact of each segment's highest-ranked problem to decide which to solve first. That gave him data behind his roadmap prioritisation and a rationale he could explain to his team.
The full write-up is in how Glofox used OpinionX for needs-based segmentation.
Frequently asked questions
What is a discrete choice model in simple terms?
Any survey that shows people a set of options and asks them to pick between them, then uses the pattern of those picks to estimate what they value. The name describes the mechanism: distinct options (discrete), a forced pick (choice), and an estimate of real-world behaviour built from the results (model).
Is conjoint analysis the same as discrete choice modeling?
No. Conjoint analysis is one type of discrete choice model, the one that handles multiple attributes at once. MaxDiff, pairwise comparison, ranked choice voting and points allocation all belong to the same family, and none of them are conjoint.
Why use one instead of a rating scale?
Rating scales let people score everything the same, so nothing separates and the result is unusable for ranking. These formats make people give one thing up to get another, which is what happens whenever somebody actually decides something.
Which format is best for a long list?
Pairwise comparison or MaxDiff. Pairwise shows two options at a time, which keeps the task light when options are complex. MaxDiff shows 3 to 6, which gathers data faster when your participant pool is small.
What is the difference between points allocation and ranked choice voting?
Ranked choice voting captures the order of someone's preferences. Points allocation captures how strongly they hold them. Ranking chocolate first tells you less than seeing someone give it 9 of their 10 points.
All five methods in this guide are available on OpinionX, along with unlimited surveys, unlimited questions and unlimited researcher seats. The free tier is capped at 25 participants per survey, which is enough to run a full study and read the results. Paid plans start at $900 a year and remove the cap.
Over 42,000 researchers and product people get one method breakdown like this each week in The Full-Stack Researcher.