
Central Tendency Bias in Surveys (And How To Avoid It)
Central Tendency Bias occurs when survey respondents consistently select the middle option on rating scales or matrix grid questions. When these responses are aggregated together with genuine votes, it drags everything towards a neutral middle ground that obscures what people actually care about.
Most articles on this topic focus on surface-level fixes like rewriting questions, adjusting scale labels, or removing straightlined data after the fact. What they rarely address is the underlying issue — some survey formats simply encourage central tendency bias and nothing you do can reliably prevent it.
The good news is there are alternative question types that make central straightlining like this impossible; most people just don’t know about them!
In this guide, I’ll explain why central tendency bias happens, which commonly used survey methods are most vulnerable to it, and which alternative approaches produce clearer insights. I’ll also share real examples of these solutions in practice, and why they work where rating scales and matrix grids fail.

— — —
What Causes Central Tendency Bias in Surveys?
Central tendency bias occurs when respondents avoid the extreme ends of a scale and repeatedly select middle options instead.
This behavior is often a form of straightlining, and it doesn’t happen for just one single reason. In practice, it emerges from a combination of human psychology and the way surveys are designed.
Psychological Factors
Social Desirability → A reluctance to appear too negative, too enthusiastic, or overly opinionated.
Uncertainty → When respondents don’t feel qualified to judge something, the middle feels like the safest choice.
Cultural Norms → In some cultures, moderation is valued and extreme responses are socially discouraged.
Indifference → Unengaged respondents who want to finish quickly default to the path of least effort.

Survey Design Factors
Grid Overload → Large matrix grids increase cognitive load and lead to respondent fatigue.
Ambiguity → Vague or abstract wording pushes people toward neutral “safe” answers.
Scale Length → As scales get longer, respondents become less willing to choose the extremes.
Added Friction → In some surveys, extreme responses trigger follow-up questions, making middle options an easy way to avoid extra work.
Irrelevance → When “Not applicable” isn’t available, the middle option becomes a stand-in for “I don’t know.”
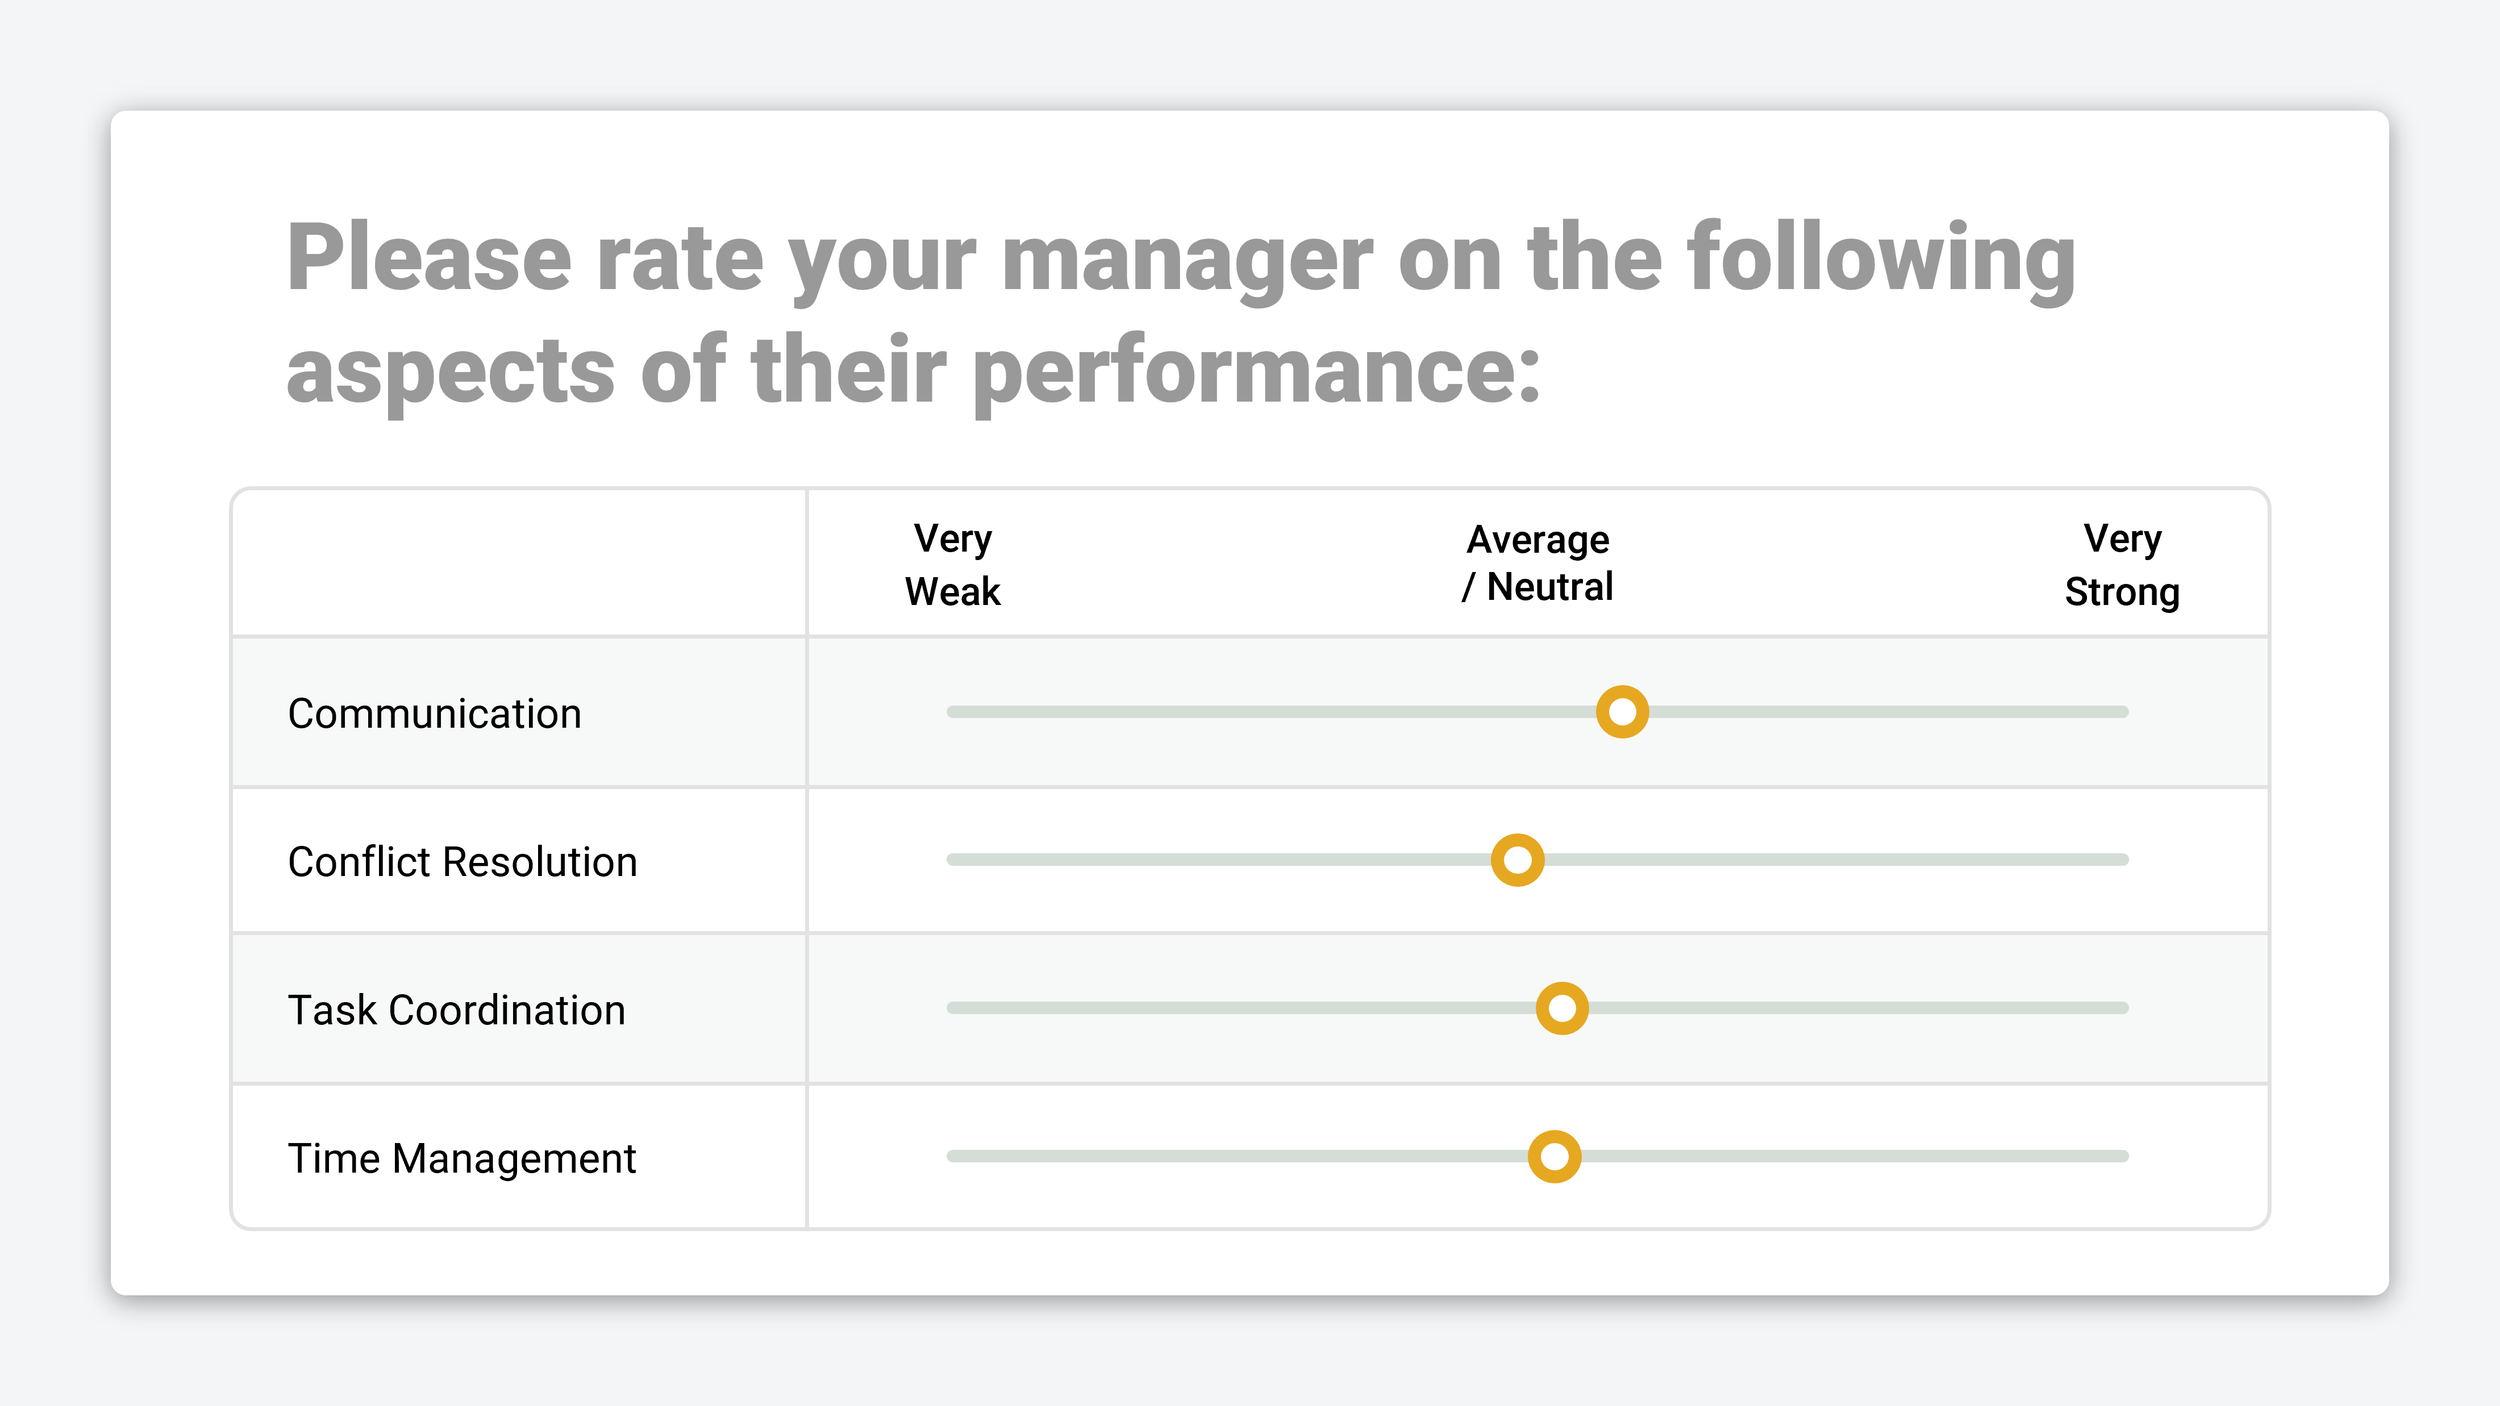
Some design issues can be reduced with clearer wording or better layout. But many causes of central tendency bias are structural issues that are baked into formats like rating scales and matrix grids.
Because of this, central tendency bias can’t be reliably “designed away.” The only dependable solution is to stop using question formats that enable straightlining and instead adopt methods that force respondents to make comparisons and reveal their real priorities.
— — —
Researchers Are Abandoning Matrix Grids
Matrix grid usage has been declining for years. 43% of online surveys in 2015 included matrix questions. By 2020, that figure had fallen to 19% and has remained largely unchanged since.

This shift closely mirrors changes in how surveys are completed. In 2025, 67% of OpinionX surveys were completed on mobile devices, where matrix grids are notoriously difficult to use on a small phone screen. Scrolling, pinching, and zooming increase friction, fatigue, and the likelihood of central tendency bias — all of which directly harm data quality.
While matrix grids may appear efficient from a researcher’s perspective, they often degrade the respondent experience. The trade-off is lower engagement, higher error rates, and results that look clean but fail to capture meaningful preferences.
— — —
4 Survey Methods That Eliminate Central Tendency Bias
To avoid central tendency bias, it’s not enough to tweak existing question formats. You need survey methods that are designed around how people actually make decisions.
When choosing an alternative to rating scales or matrix grids, there are three essential criteria:
Good mobile usability → Respondents shouldn’t need to pinch, zoom, or scroll in multiple directions just to understand the question.
Preferences require comparison → Meaningful insight only emerges when respondents are forced to compare options, consider trade-offs, and choose between them.
One question per screen → Presenting cognitively demanding tasks one at a time improves response quality, especially for low-motivation or low-attention respondents.
So which survey methods meet these criteria as a solid replacement for matrix grid questions?
— — —
Ranked Choice Voting example from OpinionX
1. Ranked Choice Voting 🥇🥈🥉
Ranked Choice Voting presents respondents with a list of options and asks them to rank them from highest to lowest preference.
While it doesn’t fully meet the “one question per screen” criteria, ranked choice works best for short list of between 3 and 10 items. Crucially, it forces explicit comparison, making central tendency bias impossible, unlike rating scales and matrix grid questions.
Pairwise comparison survey example from OpinionX
2. Pairwise Comparison 🆚
In pairwise comparison, respondents are shown a series of head-to-head choices randomly drawn from your full list of options.
This voting method is really flexible and can measure things like relative preference, importance, satisfaction, concern, and more depending on how the question is framed. Pairwise comparison meets all three criteria perfectly — it enforces comparison, breaks complexity into simple decisions, and works especially well on mobile phones.
MaxDiff survey example from OpinionX
3. MaxDiff Analysis ⬆️/⬇️
MaxDiff Analysis presents respondents with 3-6 options at a time in a series of sets and each time asks them to choose the best and worst option in the set. Like pairwise comparison, these sets are randomly compiled from your full list of options.
Like pairwise comparison, MaxDiff is a choice-based method that can be adapted to many contexts like most/least important, highest/lowest priority, etc. Unlike matrix grids, which have declined in usage of 56% from 2015, interest in MaxDiff is growing rapidly — Google searches for MaxDiff are 526% higher today than they were in 2015.
Conjoint survey example from OpinionX
4. Conjoint Analysis 📋
Conjoint analysis is designed for situations where options belong to different categories and must be evaluated together.
For example, when choosing a streaming service, people might consider things like:
Brand: Netflix, Disney+, HBO…
Price: $11.99/month, $17.99/month, $18.49/month…
Features: ads, resolution, seats, downloadable content…
It measures which categories matter most (eg. price vs brand) and also which options within each category are preferred (eg. Netflix vs Disney+).
Conjoint analysis is commonly used to answer research questions like:
Which features are perceived as most valuable?
How sensitive are customers to price changes?
Which combination of features is most appealing?
What product configuration would outperform competitors?
This makes conjoint analysis especially powerful for product and pricing research, enabling teams to run zero-fidelity experiments and test new combinations before even building anything.
— — —
The New Methods on the Block ✨
Beyond ranked choice voting, methods like pairwise comparison and maxdiff analysis were typically considered “advanced market research” — often locked away from most researchers in expensive, complex platforms. But that’s no longer the case!
OpinionX makes these methods easy to use, mobile-optimized, and accessible to modern product teams. Hundreds of product research teams use OpinionX to measure user needs, uncover differences across customer segments, and model the trade-offs in real-world purchase decisions.
Move beyond Central Tendency Bias and start using advanced survey methods that produce both better data for you and a better survey experience for your research participants:
↑
All of the survey methods covered in this guide are available for free on OpinionX
— — —
Did you enjoy this case study? Tens of thousands of Product Managers, UX Researchers, and Startup Founders subscribe to our newsletter The Full-Stack Researcher for actionable user research advice:
About The Author:
Daniel Kyne is the Founder & CEO of OpinionX, the platform for advanced market research surveys. Hundreds of the world’s top product teams use OpinionX to measure their customers needs, map customer segments, and model purchase decisions — all in one easy-to-use survey platform.
→ Try OpinionX for free today