
Gabor Granger Method for Pricing Surveys (Example & Tools)
Simon-Kucher is the world’s leading expert on all things pricing -- they’re the driving force behind the pricing strategy of hundreds of market-leading companies, including category champs like Intel and LinkedIn.
When it comes to pricing studies, the three key methods in Simon-Kucher’s toolkit are:
Gabor Granger
This guide covers everything you need to know about the Gabor-Granger Method -- what it is, how it works, analyzing its results, how it compares to other pricing study methods, real interactive examples, and ready-to-go templates.
Let’s jump in…

What is the Gabor-Granger Method?
Gabor Granger is a survey that measures the optimal price for a product or service.
It works by showing customers a series of hypothetical prices and asking them if they would buy the product at this price or not. If they say yes to one price, then a higher price is shown. If they say no, a lower price is shown. The survey searches for the inflection point for each participant -- ie. the price point where they switch from saying yes to saying no, or vice versa.
By merging these together this voting data for a large group of respondents, you can calculate (1) the percentage of target customers who would consider buying your product at each price point, (2) the total revenue that would be generate at each price point, and (3) the optimal price point that results in the highest potential revenue.
How does a Gabor Granger survey work?
A Gabor Granger survey typically starts with an overview of the product or service so the respondent understands the product they must consider purchasing. The respondent is first asked if they would purchase this product “if it were available at a reasonable price” -- if they vote no, they’re marked as not interested and they skip past the remainder of the Gabor Granger questions.
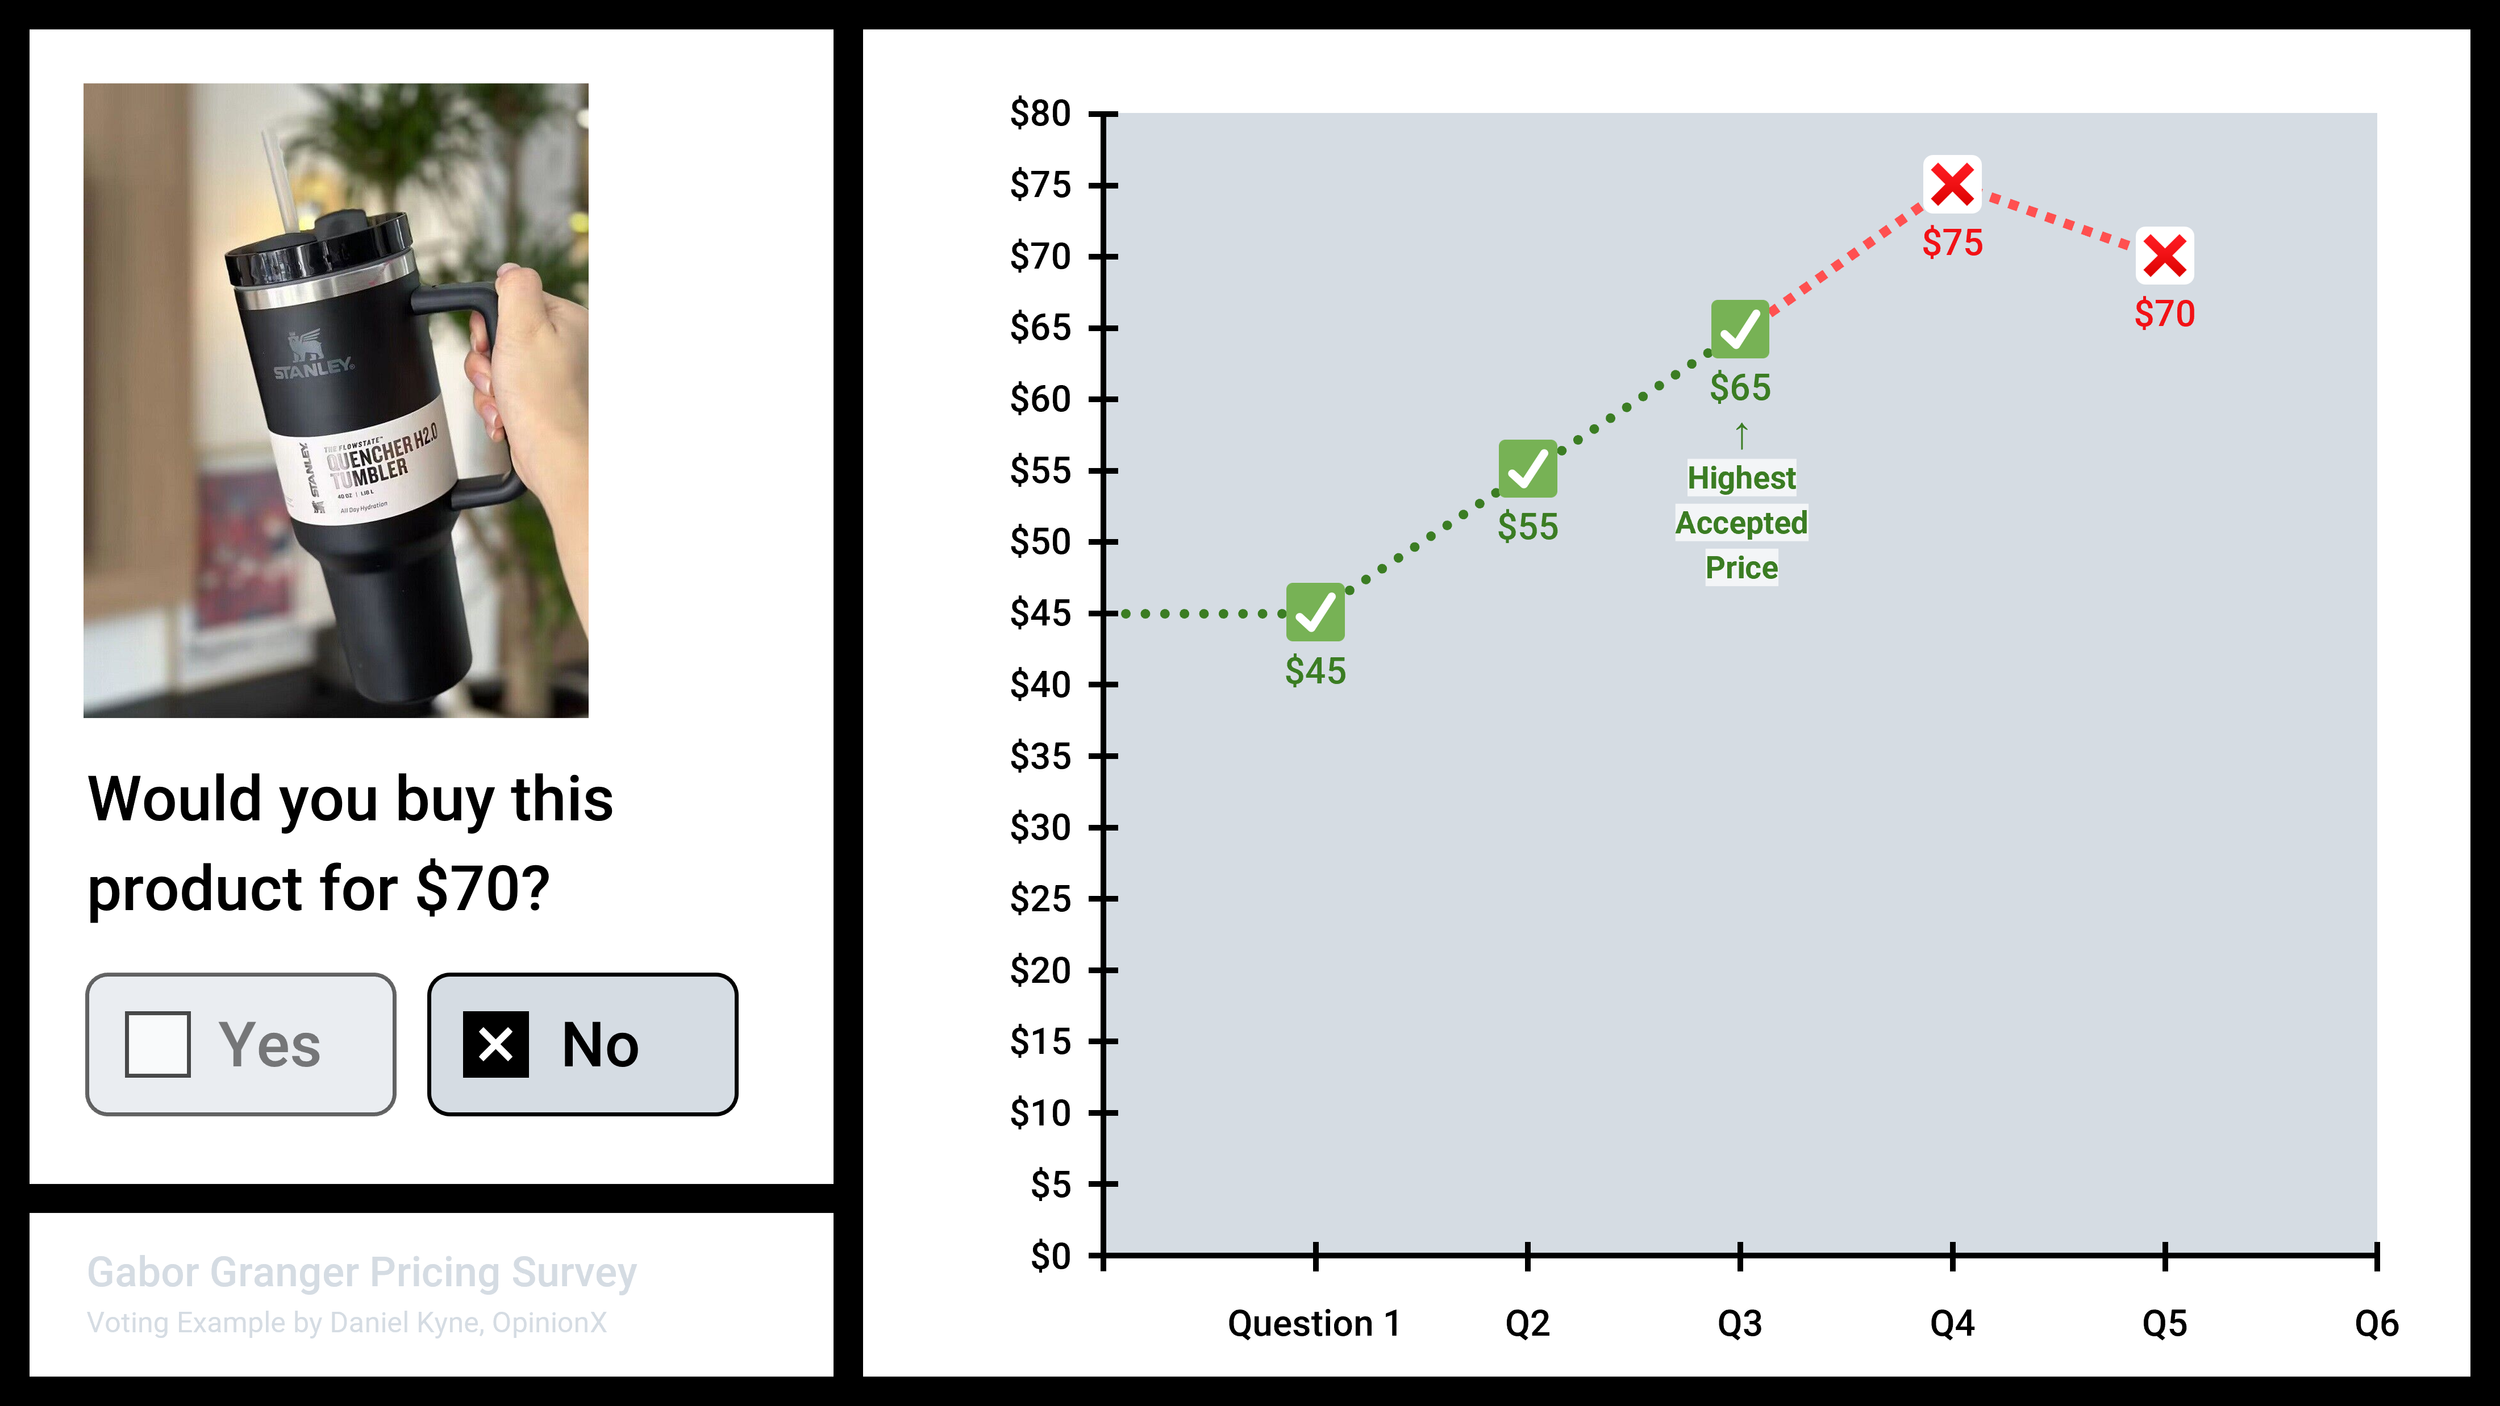
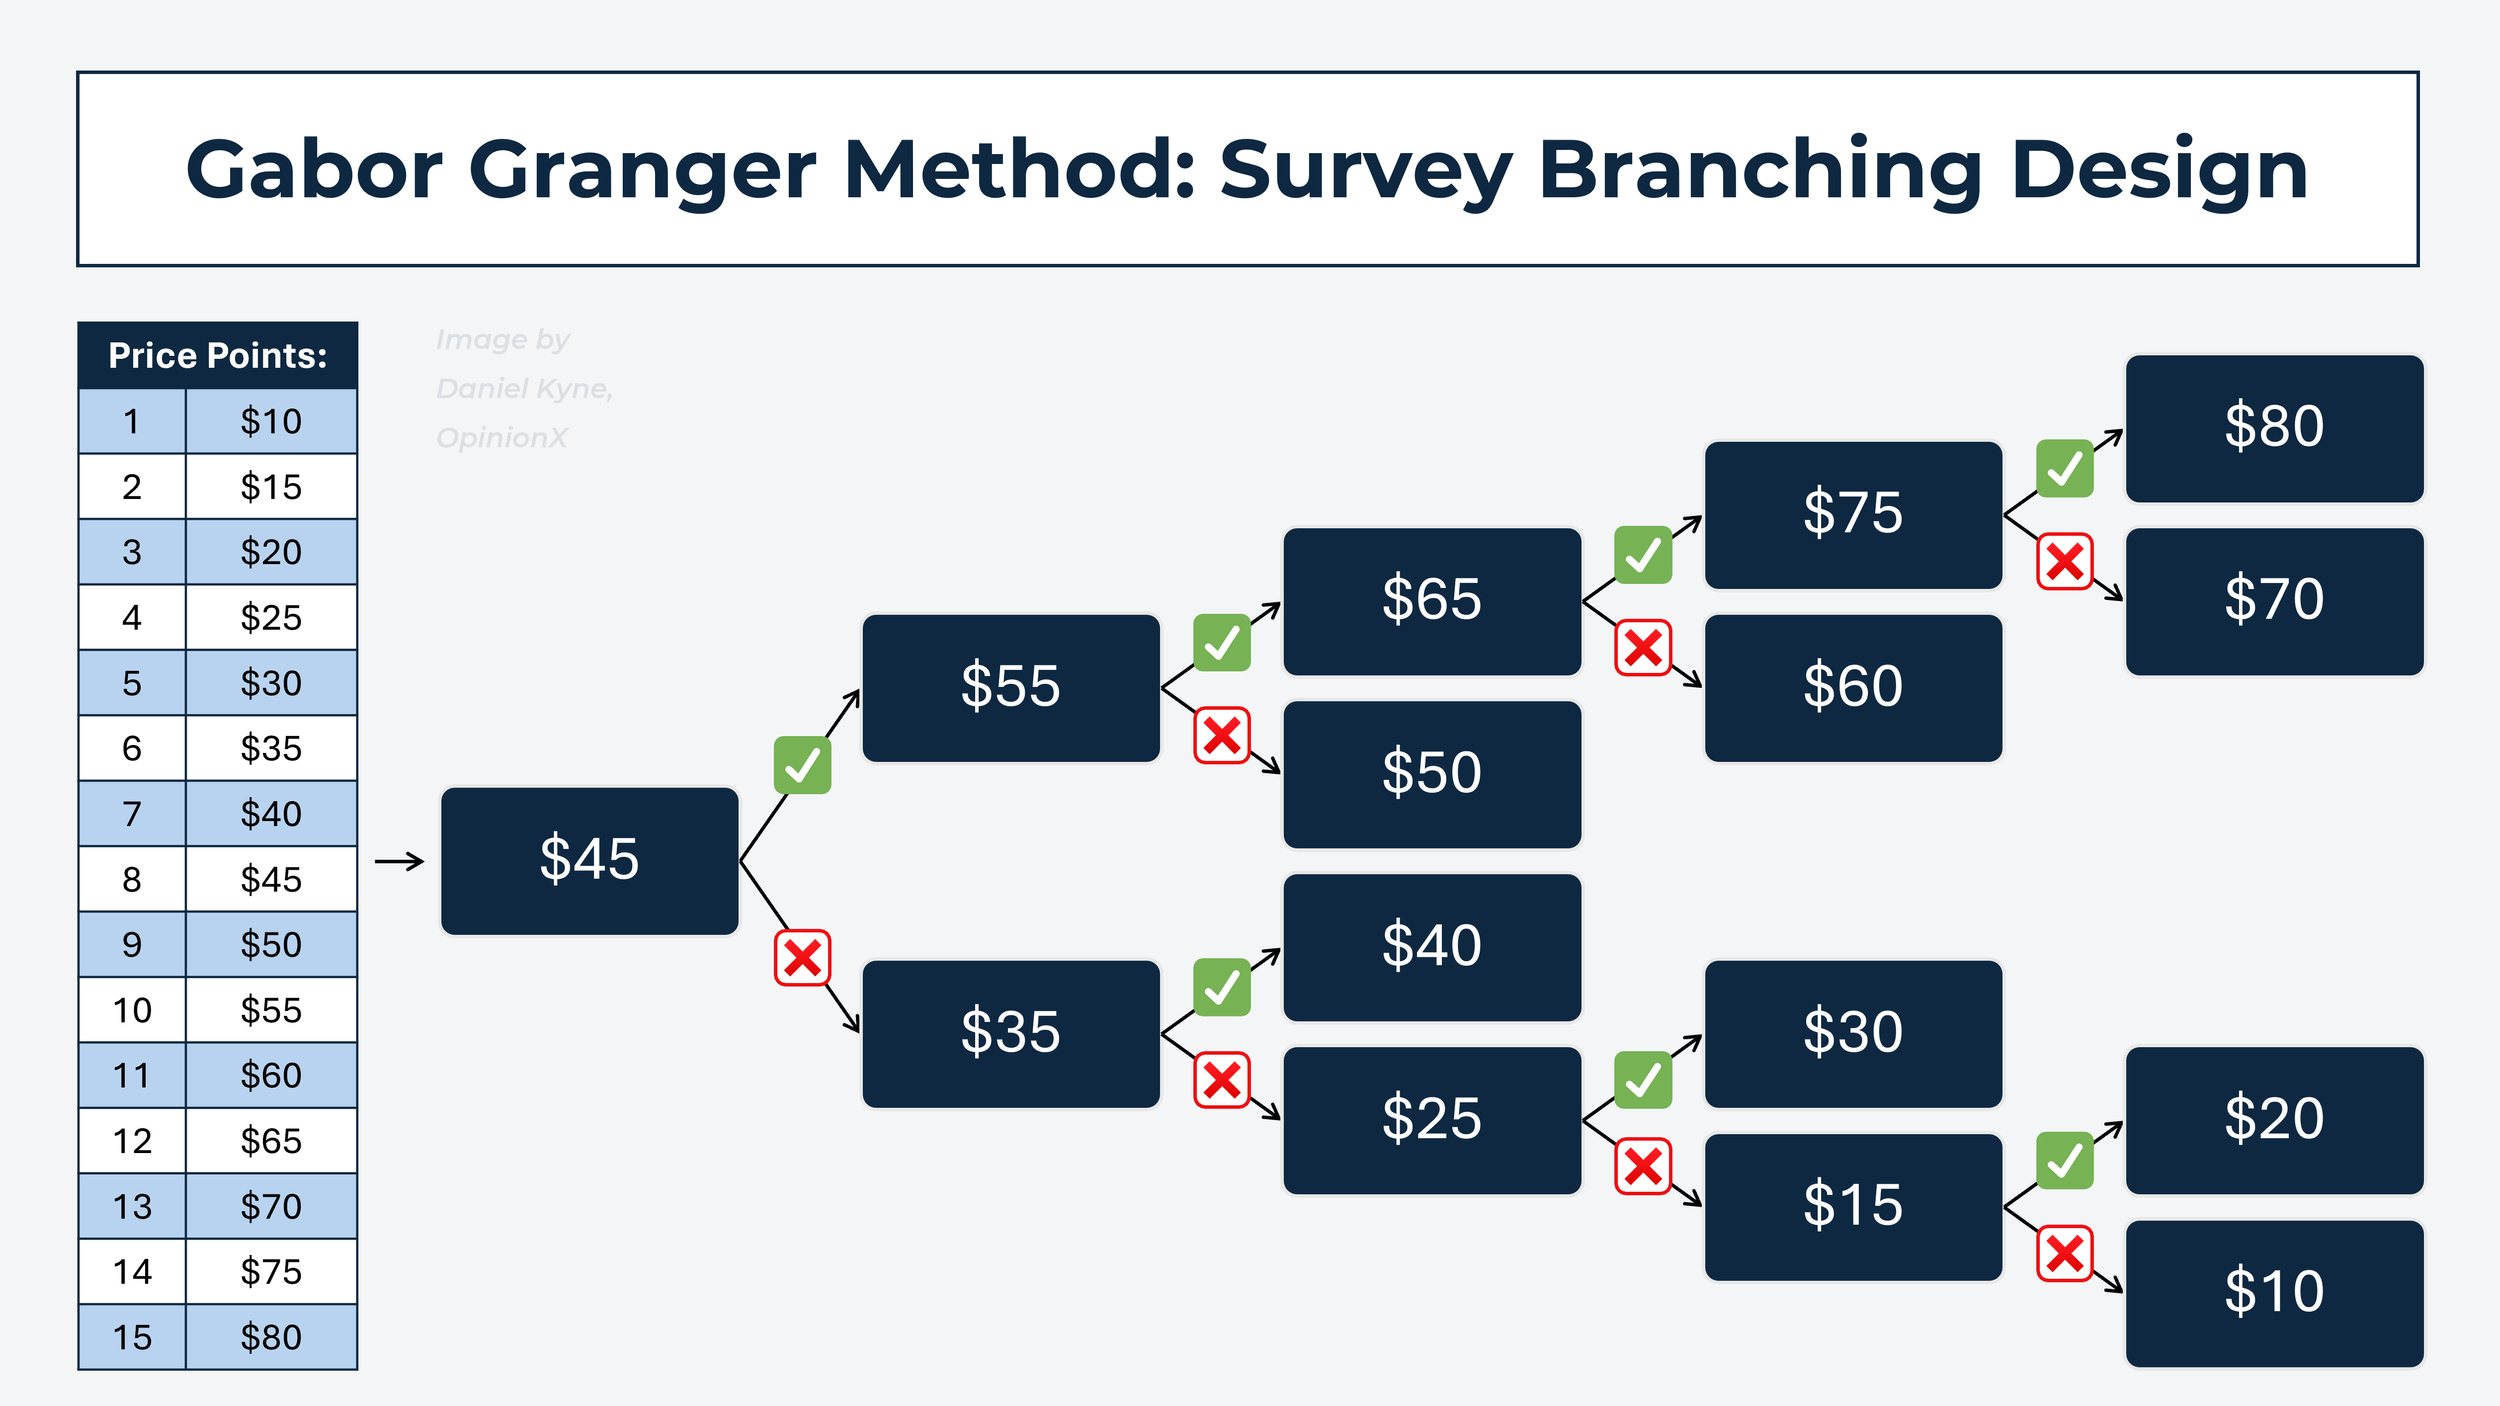
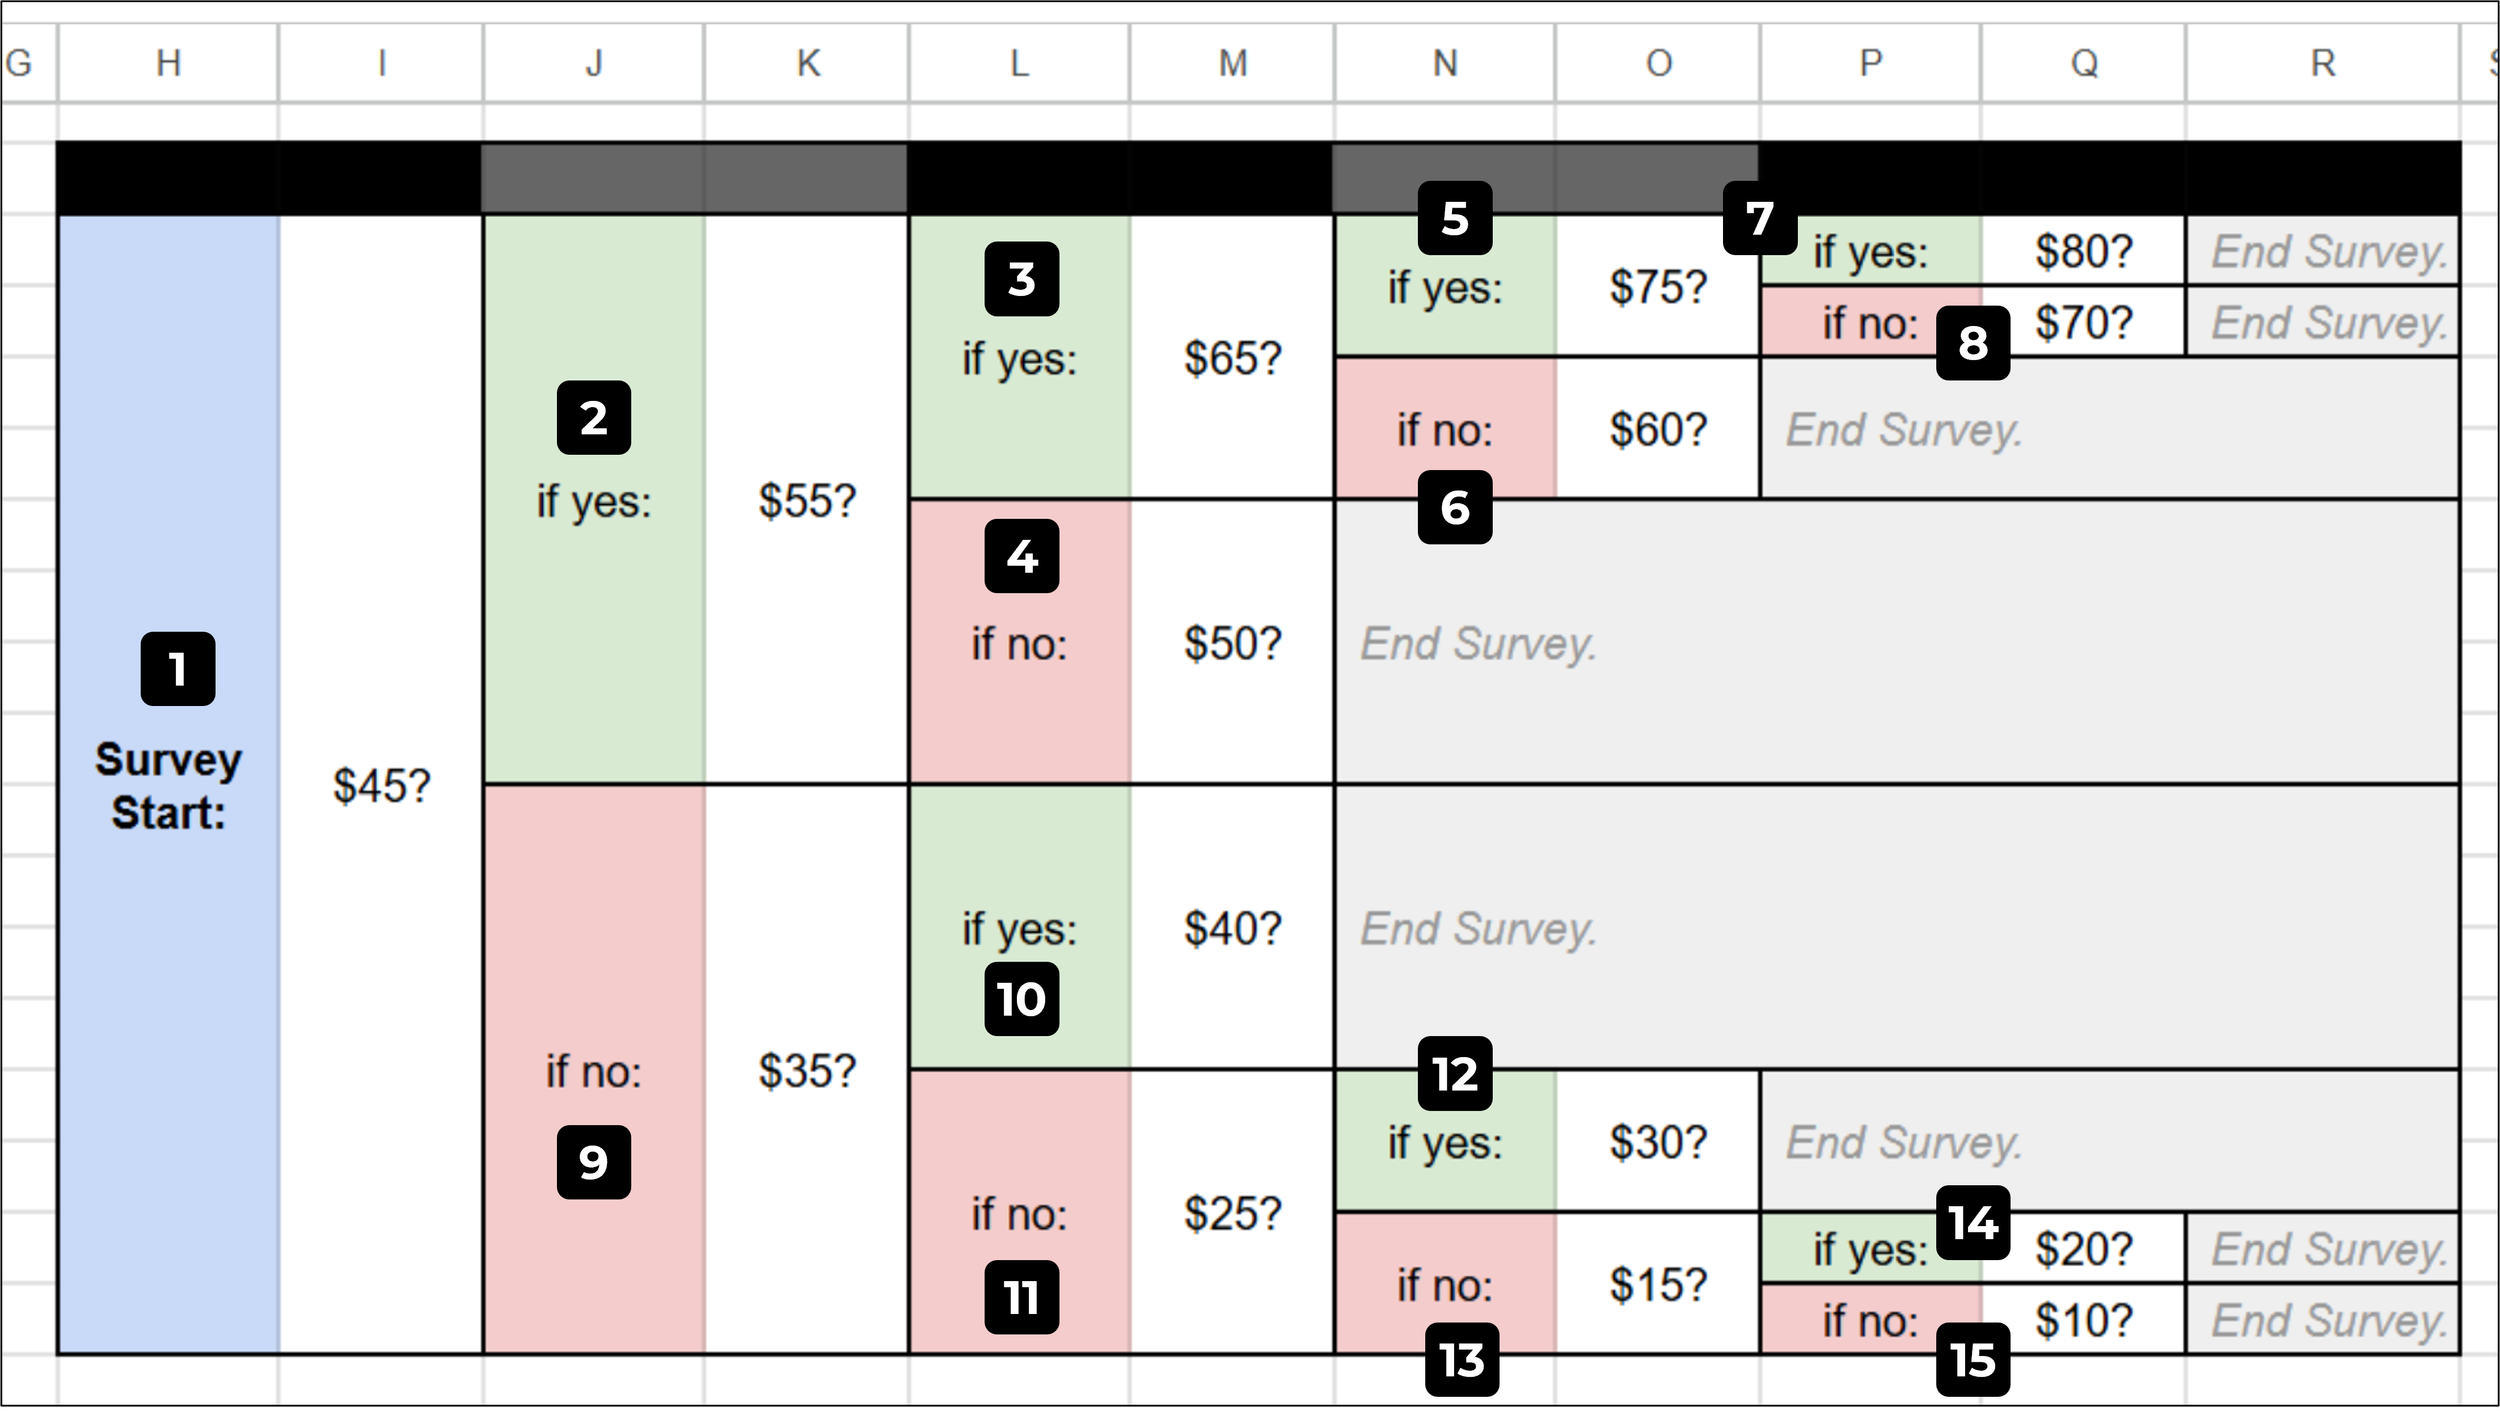
Interested potential customers who voted yes continue onto the Gabor Granger voting section of the survey, where they are shown the product at various prices and asked if they would purchase it:

In the example above, the first price shown for the Stanley Cup is $45. Because the respondent voted yes, they are subsequently asked the same question at increasing price points ($55, $65). Once they vote no to a price ($75), then one final question is shown that uses the midpoint between the previous no ($75) and the highest price they said yes to ($65), which in this case is $70.
The highest price that receives a yes vote is considered the respondent’s highest accepted price:
Alternatively, if the respondent votes no on the first price point shown, then the survey will show decreasing prices until they vote yes to buy the product, like this:
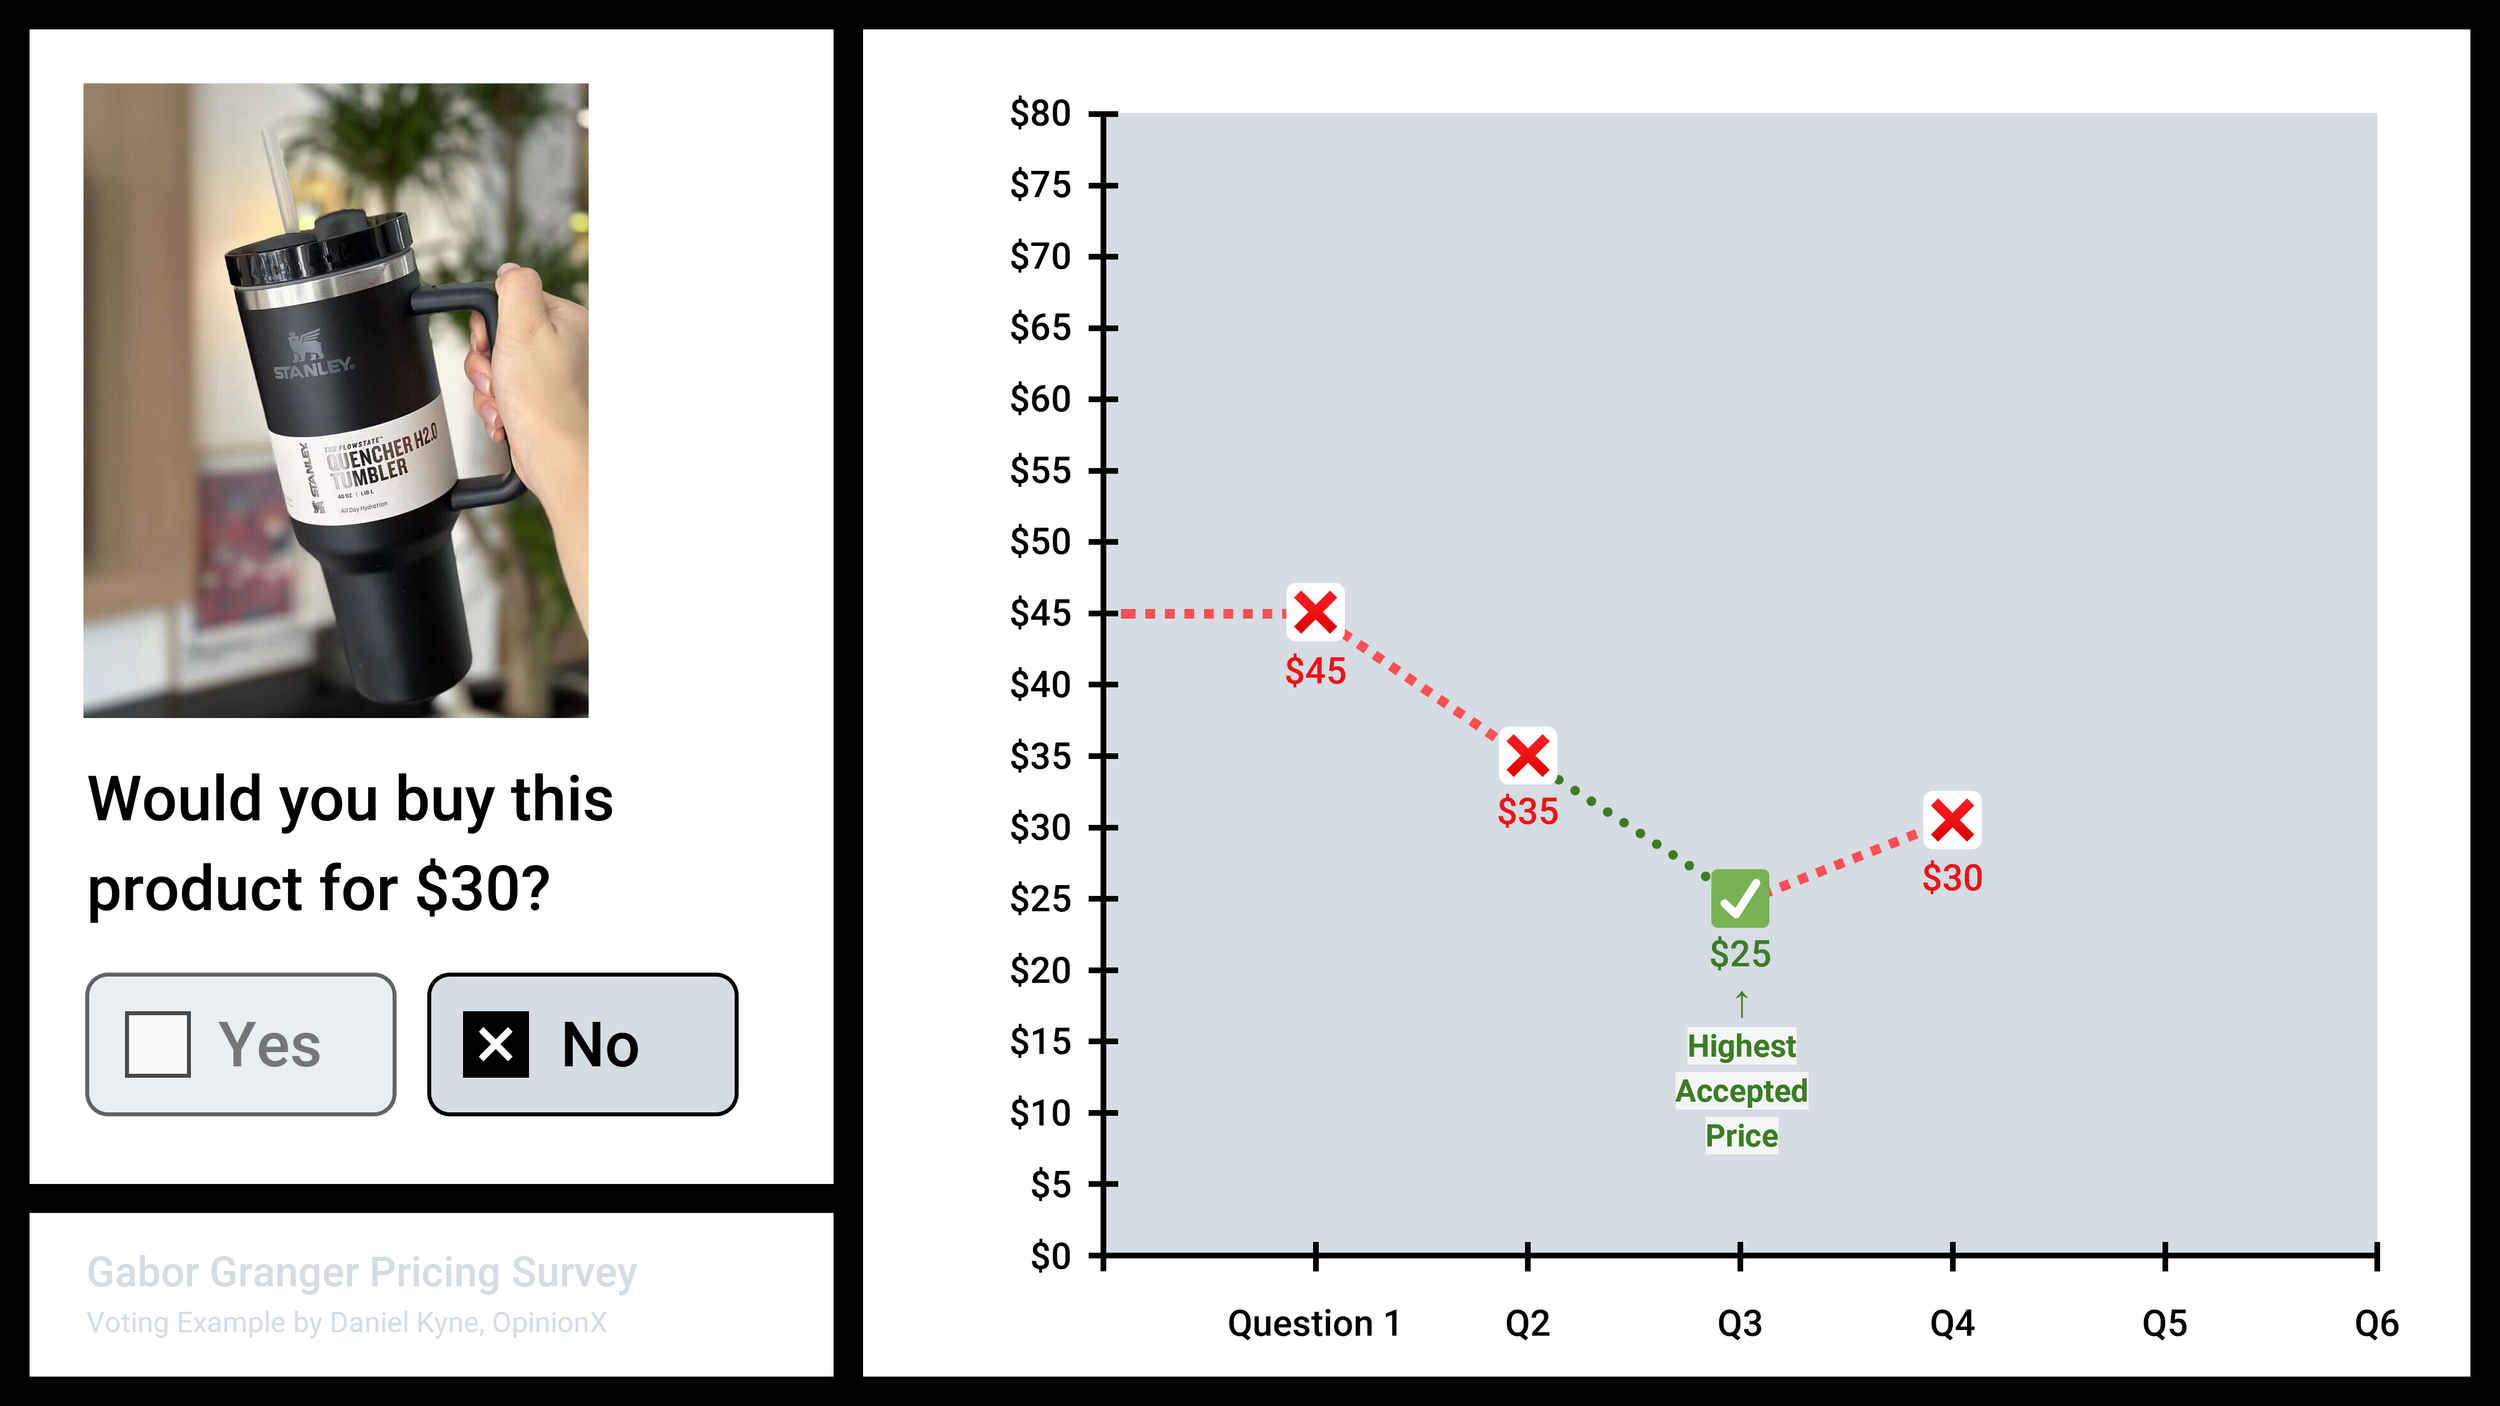
The simple principle in a Gabor Granger survey is that the highest price someone voted yes on is considered their highest accepted price, ie. the most they are willing to pay for this product.
How does Gabor Granger data turn into Optimal Price?
So we’ve covered how a Gabor Granger survey finds each individual respondent’s highest accepted price, but how does this data turn into an optimal price recommendation for the product overall?
Start by putting everyone’s highest accepted prices together to find:
Not Interested → What percentage of respondents said no to the qualifying question, “Would you buy this product if it were available at a reasonable price?”.
All Rejected → What percentage of people said they would be interested in the product but proceeded to vote no to every price point, demonstrating extremely high price sensitivity.
No Ceiling → What percentage of respondents voted yes to every single price point, even the highest price you included in the survey, showing a very high willingness to pay.
Add these three percentages to the top of your chart, like this:
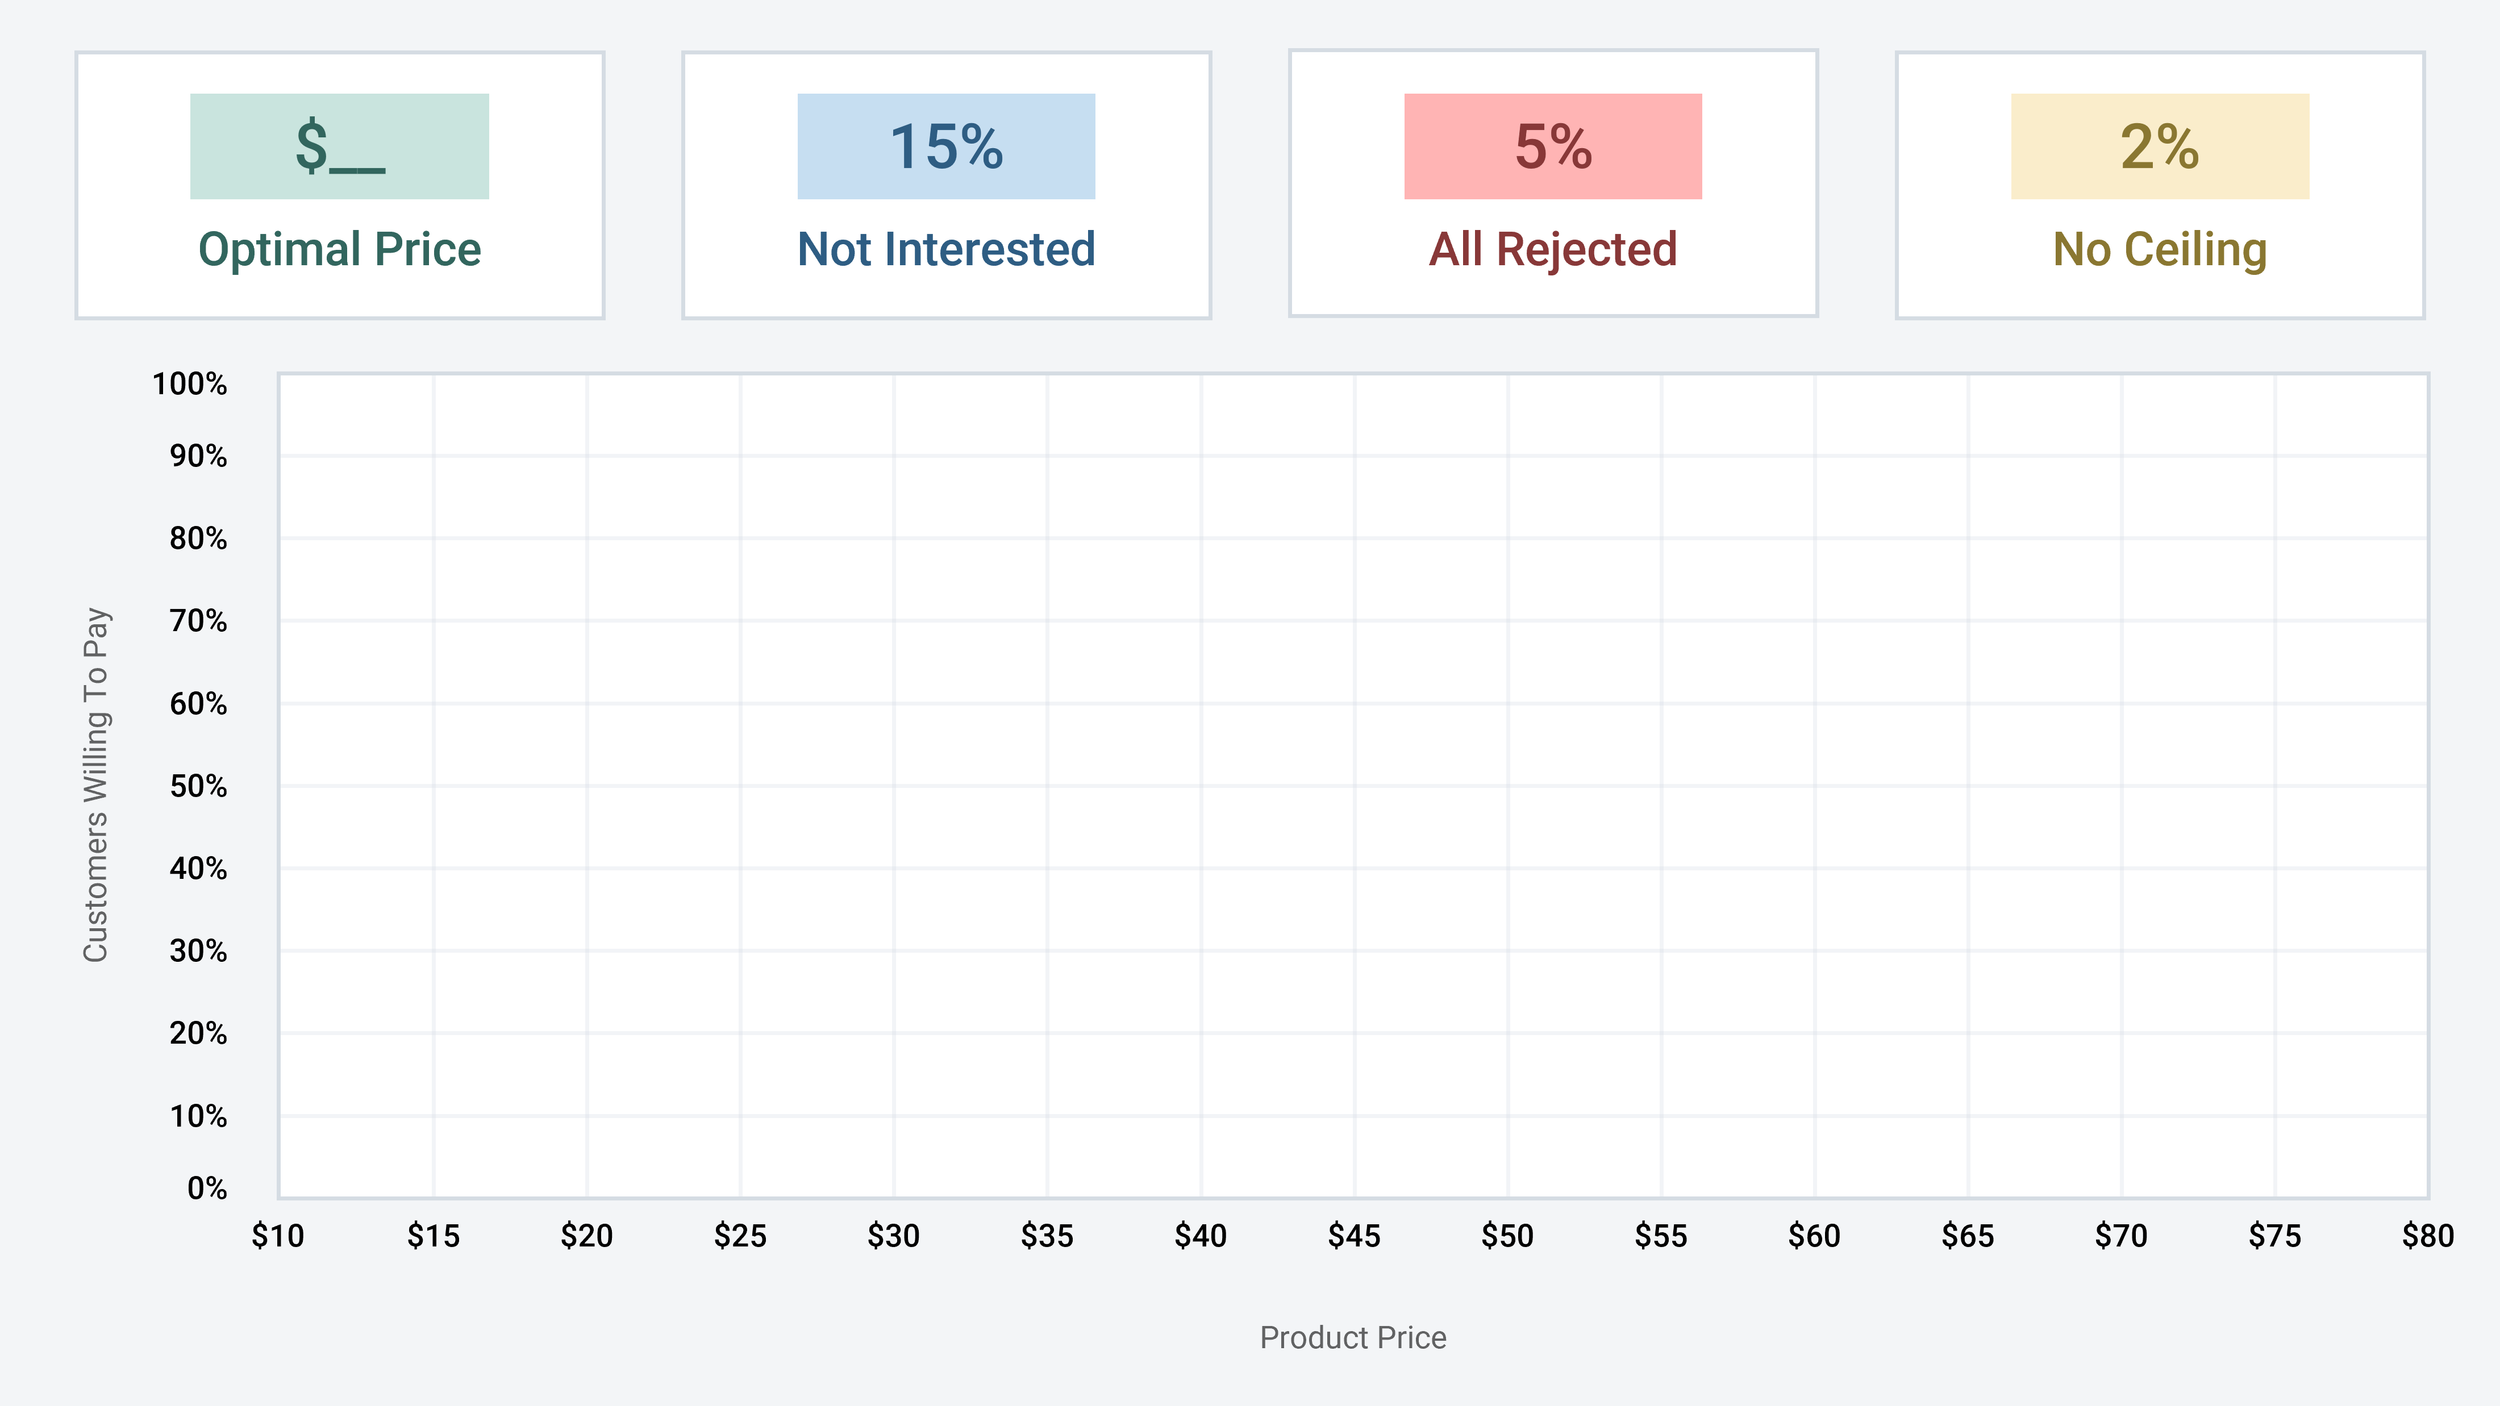
Next, plot a line for “Customers Willing To Pay” -- ie. the percentage of customers that said they would buy the product at each specific price point (I explain in the analysis section of this guide how to find these numbers from your survey results).
We’ll start with our lowest price point, in our case $10, and check what percentage of respondents said yes to prices of $10 or higher. For our survey, 83% of respondents voted yes to this, so we’ll add a dot at $10, 83%. If we repeat this at each price point, we’ll get a full chart like this:

Next, we will calculate Projected Revenue -- the amount of revenue we would generate from this product at each price point if we had 1000 potential customers considering buying it.
To calculate Projected Revenue for our range of price points, we first need to multiply 1000 customers by the percentage interested at each price. For example at $60, we multiply 1000 x 0.29 (because 29 percent of people said they’d buy the product at $60), which gives us 290 prospective customers. If each of these bought the product at $60 (290 x $60), we would generate $17,400.

To find the Optimal Price that will maximize revenue generation for this product, look for the highest point on the Projected Revenue curve, which in this case is at $45 on the x-axis:
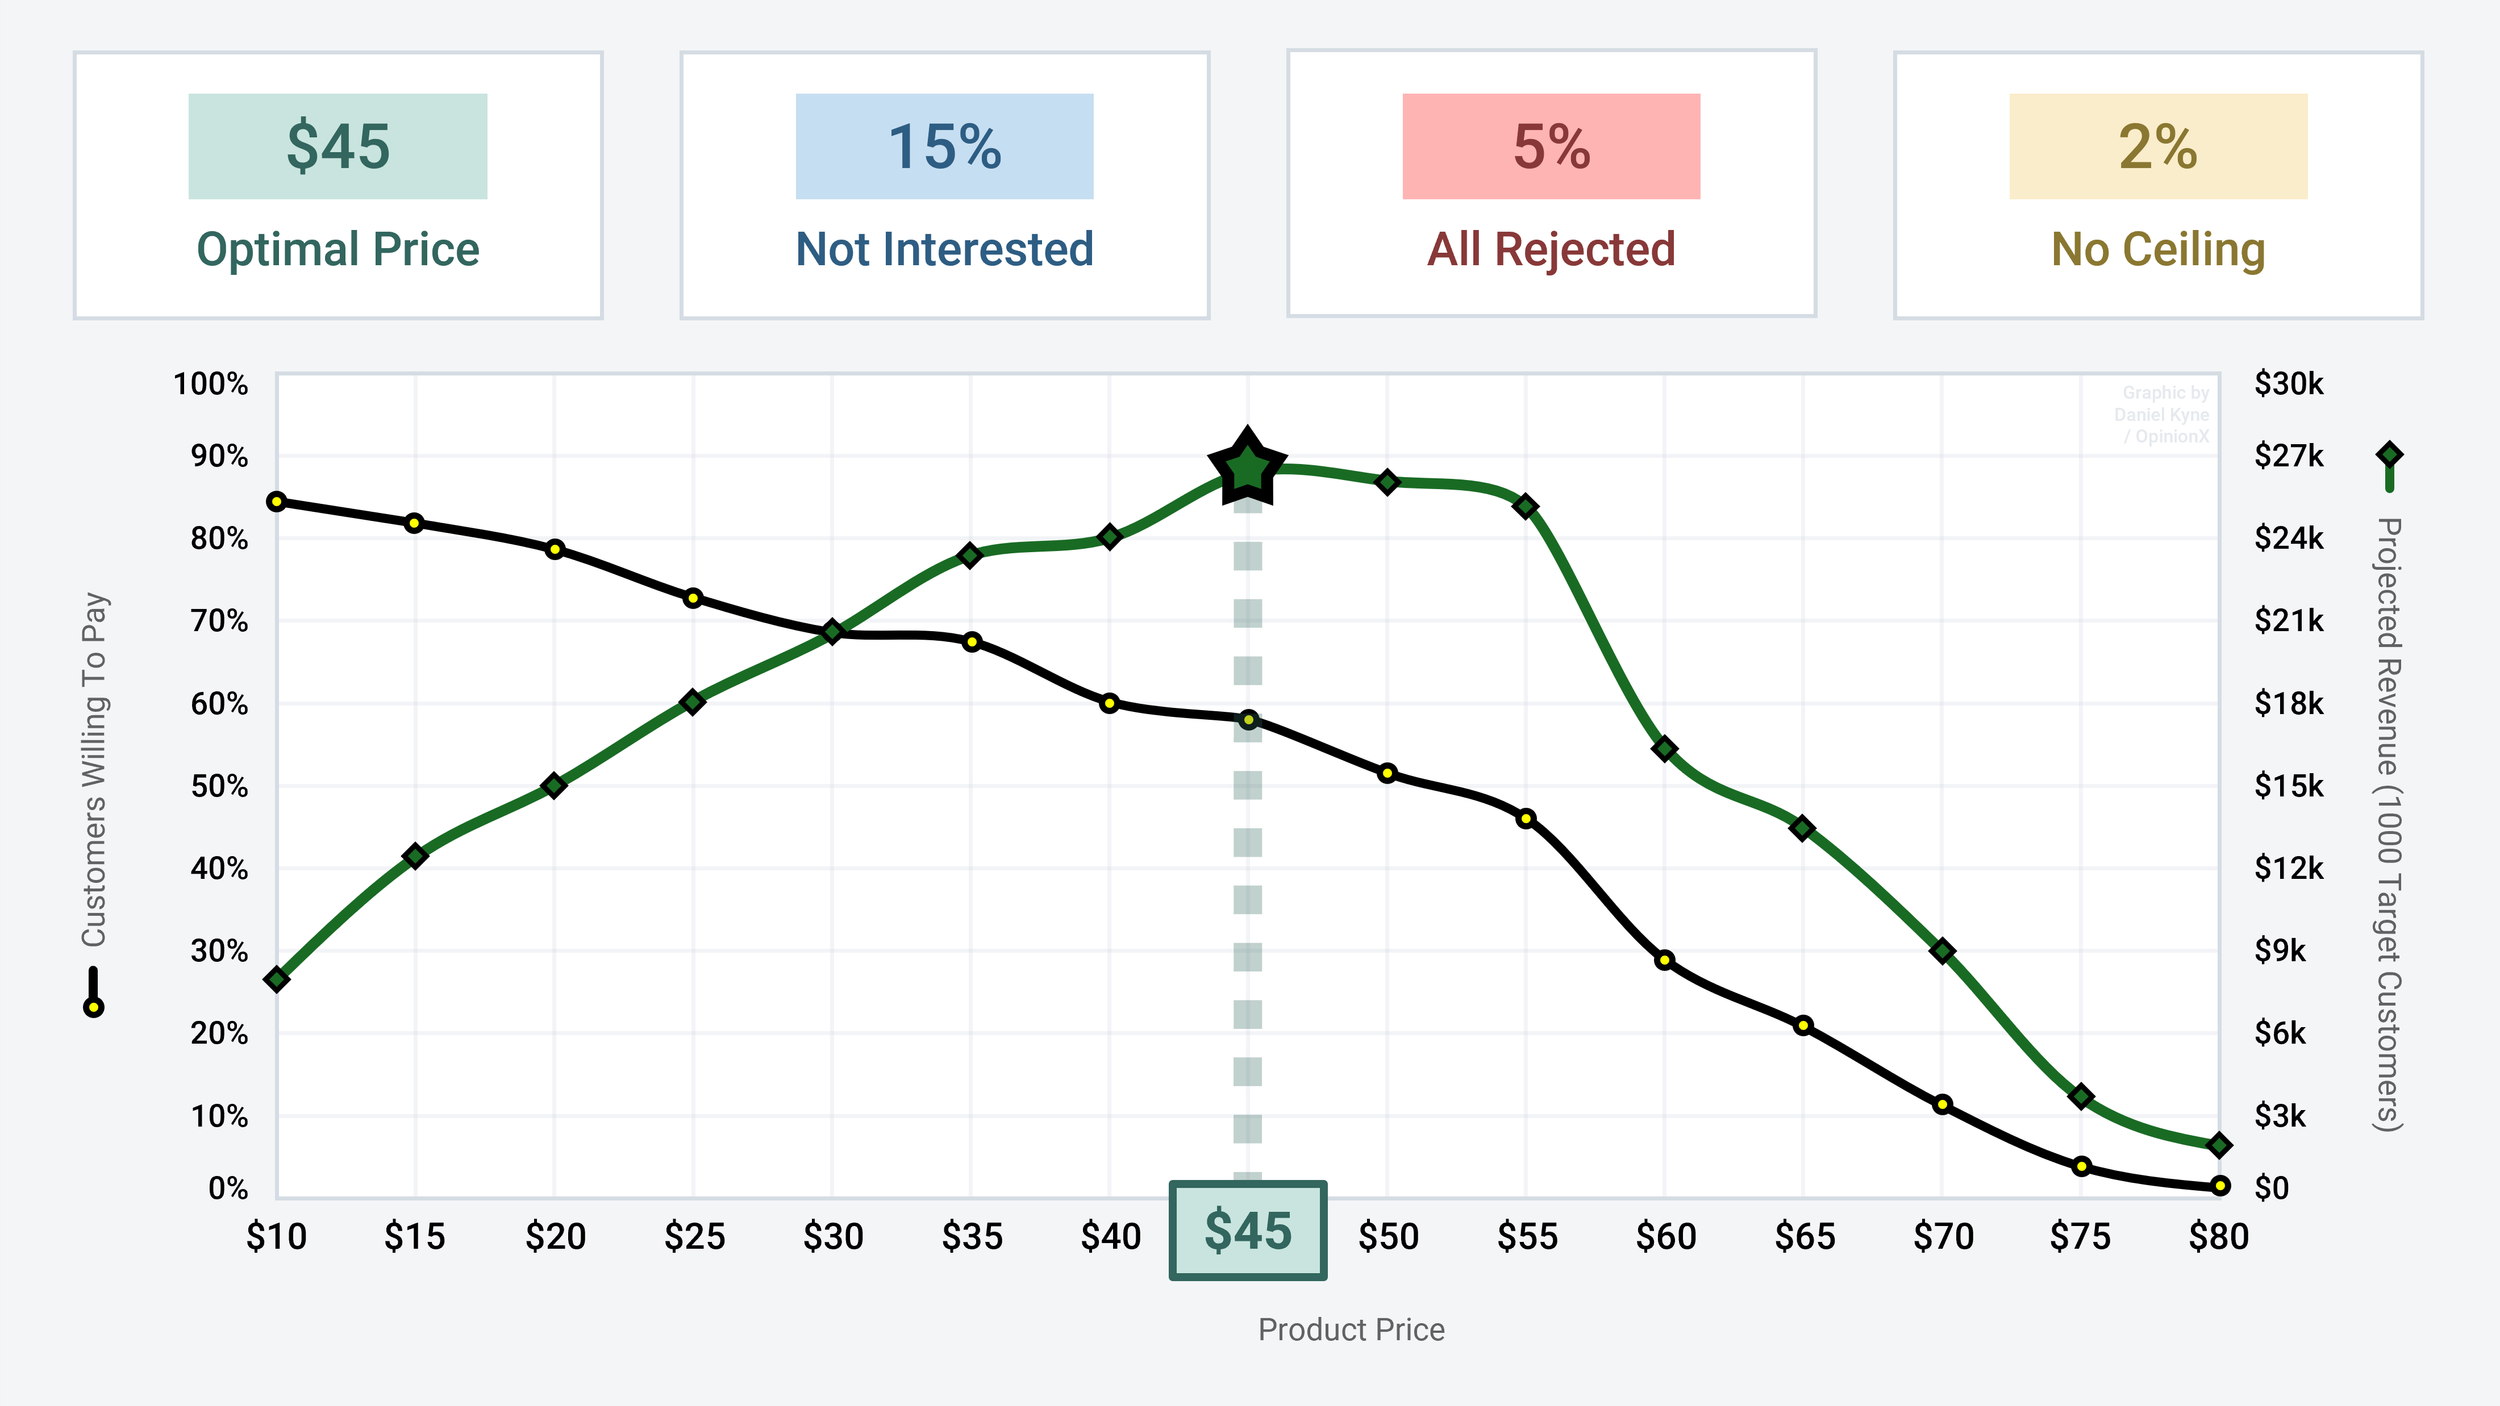
The outcome of a Gabor Granger Method survey is to find the balance between the revenue generated at various potential prices and the percentage of customers that will consider purchasing the product at each price point. The Optimal Point is where these two numbers result in the largest financial outcome overall.
How to set up a Gabor Granger survey?
There is no advanced math or AI going on under the hood of a Gabor Granger survey. In fact, it’s actually quite a simple survey to set up -- and I’ve even created some resources below to help automate the trickier parts of the process for you :)
i. What structure does a Gabor Granger survey follow?
Gabor Granger surveys work like a flow chart -- each decision leads to a specific follow-up question, branching out like a decision tree:
This linear flow means it’s relatively straightforward to set up a Gabor Granger survey in most survey tools (including OpinionX, where you can create branching surveys like this for free with unlimited respondents).
Some tips that will make your Gabor Granger survey a lot easier to set up:
Fifteen Prices -- Including 15 price points in your Gabor Granger survey keeps the format uniform, like in the flow chart example above. This ensures between 3 to 5 questions for every participant, keeping the survey concise and neat.
Consistent Price Gaps -- In the flow chart picture, there’s a consistent $5 gap between each of the fifteen price points. Keep the step change consistent like this to ensure a smooth survey experience for participants and a much easier analysis process for yourself later on.
Start At The Midpoint -- Use the middle price point (8th in your list of fifteen prices) as the starting question. While some guides will suggest a dynamic approach that is much more complex, using the middle price maintains the uniform nature of your Gabor Granger survey and makes the branching logic a lot easier to configure.
ii. How do you pick the price points for a Gabor Granger survey?
This part can be tricky, so I’ve created a spreadsheet template to help automate this for you!
On the spreadsheet template, all you have to do is…
1. Pick a Floor Price -- the lowest possible price you could consider selling your product for.
2. Pick a Ceiling Price -- the highest price that will be shown in the survey.
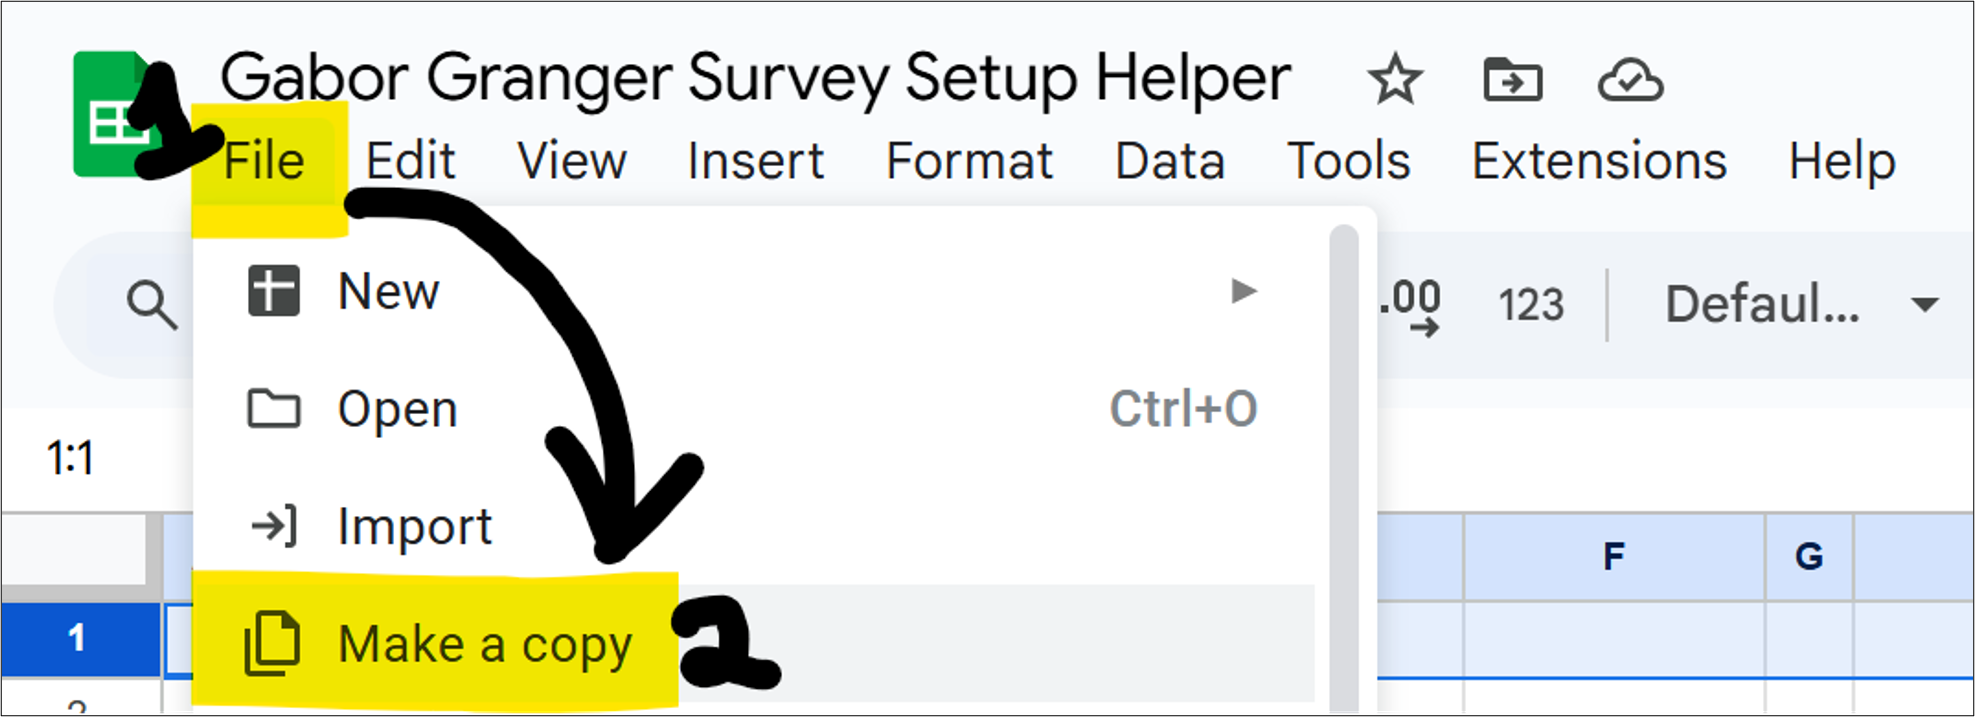
^ You’ll see a little table on the spreadsheet called “Suggested Ceiling Prices”. This uses your Floor Price to suggest a range of potential Ceiling Prices that will produce normal numbers like $75 or $72.50 instead of weird long decimals like $74.214666… As shown in the GIF above, just type the equals character (=) into the Ceiling Price cell and click the most suitable option from the Suggested Ceiling Prices list, or type your own.
Once you complete these two steps, the spreadsheet will create 15 “survey prices” and fill in the flowchart with the structure of your survey branches. Access the spreadsheet template here. Click ‘File’ → ‘Make a copy’ to edit the spreadsheet (do not request editing access to the template).
iii. How to turn your Gabor Granger spreadsheet template into a survey?
First of all, every price question is a Multiple Choice block with two options -- Yes and No.
Branching logic is the feature that lets you send survey participants to different follow-up questions based on their answers. Many survey tools require a linear survey flow (ie. you can’t use branching to send someone backwards in the survey).
To set this up on my OpinionX survey, this is the order of questions I added to my survey prior to adding branching logic:
Below is an example of what this ends up looking like on OpinionX once I added branching logic:

I created a Gabor Granger survey on OpinionX that you can test out as a survey participant here. To create a copy of this survey with all the branching already configured, go to OpinionX’s Sample Survey Gallery (requires a free account), open the Gabor Granger survey, and click ‘Duplicate’ in the top-right corner. Then just edit the prices to match your own requirements.
How do you analyze Gabor Granger survey results?
Once you’ve got your survey launched to participants, it’s time to figure out how to turn response data for a Gabor Granger survey into a chart like this:
After running my own Gabor Granger survey, I exported the results to Google Sheets (open the tab named “Sheet1” on this example to see how the raw survey data looks). Then I created a separate tab to run my analysis.
On my analysis tab, I used spreadsheet formulas to find all the prices each participant voted yes to buying. I used this new table to pull out the highest acceptable price for each person in the MAX column at the end. Here’s how this looked:
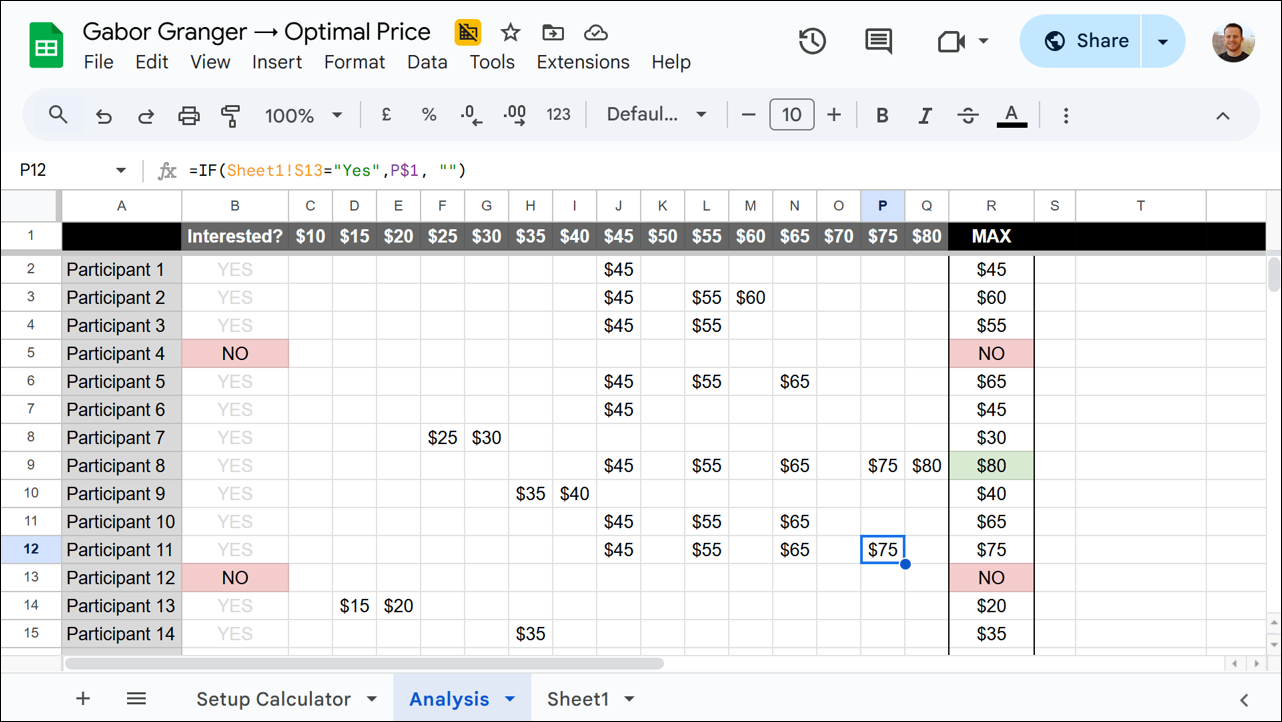
“$0” people said they would be interested but proceeded to vote no on every price. ”NO” people said they wouldn’t be interested even at a reasonable price.
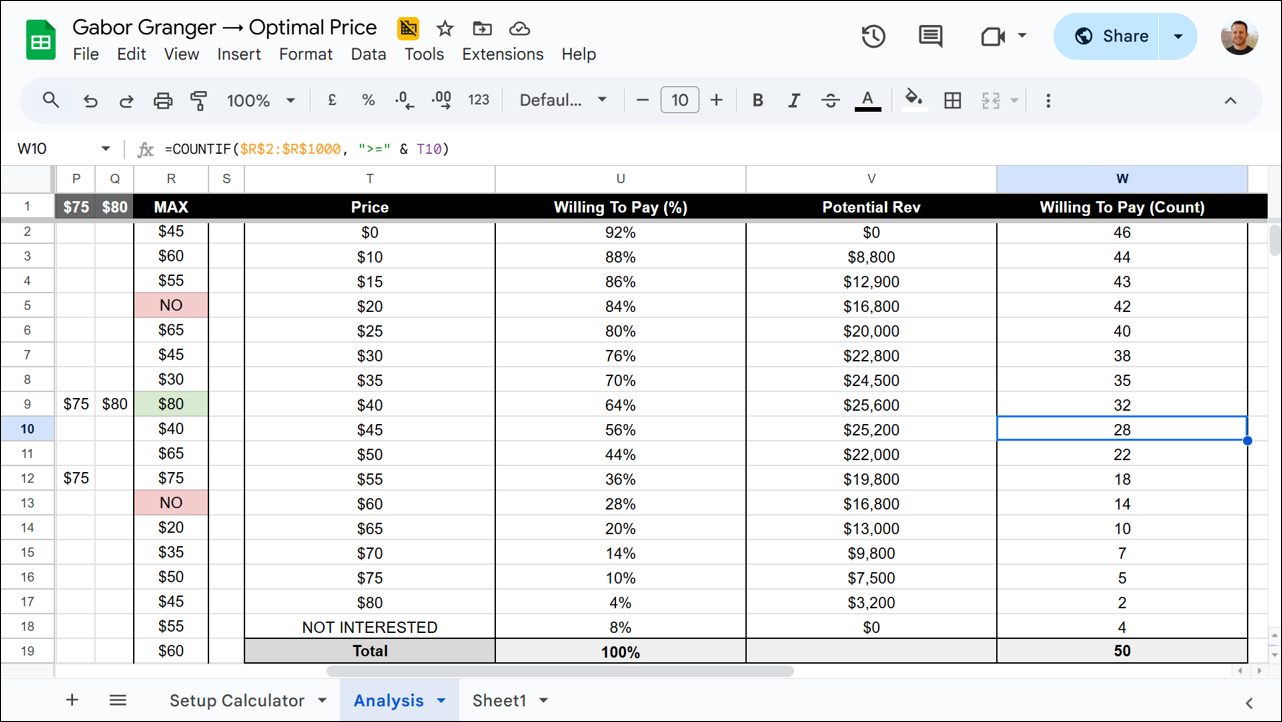
Next, I made a summary table that:
A. Counted how many people would be willing to buy the product at each price. To do this, I looked at whether each participant’s highest acceptable price was greater than or equal to the price point in question. This is shown as Willing To Pay (Count) on the screenshot below.
B. Then I turned this count into a percentage by dividing it by the total number of participants who completed the survey, which is shown as Willing To Pay (%).
C. To find which price point would create the highest Potential Revenue, I created a hypothetical scenario where 1000 potential customers were considering buying the product. In each case, I multiplied 1000 people by the percentage of people willing to buy the product at a price point (eg. at $45, a total of 56% said they’d buy the product, so 1000 x 0.56, which gives us 560 interested customers). Then I multiply this by the product’s price (560 x $45 = $25,200).
Here’s how all this looks on Google Sheets:
The final step is to turn this table into a Line Chart, like in the example below:

The tricky part of this is adding two separate vertical axes, one for Willing To Pay % and one for Potential Revenue. To do this, go to Chart Editor → Customize → Series, click the dropdown that says ‘Apply to all series’ and choose Potential Revenue, and then change ‘Axis’ to ‘Right axis’.

And that’s all you need! As you can see in the example above, the Optimal Price (star) is the value on the x-axis that corresponds to the highest point on the Potential Revenue curve (red), which in this case is $40.
When should you use a Gabor Granger Method survey?
Gabor Granger is a flexible price sensitivity test that’s useful in a range of different product research scenarios…
1. Market Expansion: You’re adding a new sales region, broadening your targeting to include a type of customer, or aiming to establish a new use case -- in each of these cases, you must reassess fundamental assumptions that you may be carrying over from your existing market position. Testing whether this new market has a considerably higher or lower willingness to pay will significantly affect the success of your expansion efforts.
2. Testing Add-Ons: When you have a feature that only a small segment of your customer base uses and considers important, you should consider spinning this feature out as a potential add-on. What you have to figure out is whether this group is price sensitive and perceives the add-on to be valuable enough to purchase at an additional cost.
3. Price Increases: In a 2024 survey from Chargebee, 73% of subscription companies said they were preparing price increases for their products. If you’re considering something similar, you’d better be sure that you’re moving towards an optimal price rather than increasing ARPU at the expense of gross revenue.
4. Optimizing Pricing: You’ve been adding new features to the product for well over a year, but you’ve never taken a step back to assess how much value customers perceive your paid plans to be worth today. Gabor Granger can be a useful yardstick in measuring changes in perceived product value over time.
5. MVP Validation: You’re working on a new feature, but you don’t know whether customers will perceive it as a commercial addition -- ie. something they would pay for or perceive as a value increase to the overall product. Gabor Granger is a quick way to commercially validate prototypes before backing them with more resources for development or launch.
6. New Product: You’ve already built an entire new product and now you need to figure out how much to charge people for it. When you’re staring at a blank page like this, Gabor Granger can give you an indicator for rough prices to consider and, even more useful, to find the customer segments with the highest optimal price (which is why you should pick a survey platform with segmentation capabilities).
What are the best tools for Gabor-Granger surveys?
You can run a Gabor Granger survey on most survey platforms. Here’s a checklist of required and recommended features…
Required: Multiple Choice Questions, Branching Logic, and Data Exporting.
Recommended:
Segmentation -- to find the customer segments with the highest optimal price.
Conjoint Analysis -- to compare marginal willingness to pay for different features/attributes.
Van Westendorp -- an alternative approach to test price sensitivity and calculate optimal price.
Flexible Survey Builder -- the ability to add other questions alongside the Gabor Granger section.
OpinionX is a survey platform built specifically for product research. Unlimited surveys, unlimited participants, and unlimited researcher seats mean that with OpinionX you can run a pricing study today, measure user needs tomorrow, and compare segmented customer preferences next week -- all on one research platform.
How does Gabor Granger compare to Van Westendorp or Conjoint Analysis?
Gabor Granger is a price sensitivity test. There are two other survey methods that similarly provide price sensitivity data…
Van Westendorp: Similar to the Gabor Granger Method, both in function and that it has a weird name, a Van Westendorp survey asks people about their price preferences towards a specific product. Rather than show price options, it asks four open-ended questions for participants to respond to with a price: at what price would this product be too cheap to consider, a great bargain, expensive but still within consideration, and too expensive to even consider? The answers to these four questions are used to calculate the optimal price at which the lowest number of people said the product is either Too Cheap or Too Expensive.

Conjoint Analysis: This is a more advanced survey and is available on fewer survey tools (OpinionX is the only platform that offers free conjoint analysis surveys). Conjoint Analysis shows participants different variations of a product and asks them to choose their preferred version. By analyzing which versions they choose, conjoint analysis identifies which attributes are most important to customers. Conjoint analysis can be used for many types of pricing studies, whether looking at marginal willingness to pay (how much someone would pay to upgrade one specific feature) or a price sensitivity test (looking at the range in importance within the price attribute across different customer segments).
How we can help with your pricing research
Our Research Platform: Run price sensitivity tests on OpinionX’s free research platform, which is used by thousands of companies globally.
Our Research Agency: Our experts can design and run a pricing optimization project for you, incorporating methods like Gabor Granger to help you achieve increased ARPU and conversion rates with data-driven recommendations.
Ready-To-Go Templates for Gabor Granger Surveys
I’ve got you covered for all three key resources:
i. Gabor-Granger Setup Calculator
The “Setup Calculator” tab on this spreadsheet helps you pick 15 price points, shows you which order they should appear in, and maps the logic for branching participants between questions.
ii. Gabor-Granger Survey Template
I created a sample Gabor-Granger survey you can try as a participant here (no login needed). If you want to spin this off to edit as your own survey, where you can replace the images and prices with your own product, just create a free OpinionX account and hit “Duplicate” on this Gabor Granger Sample Survey (login required).
iii. Gabor-Granger Analysis Template
The “Data Analysis” tab on this spreadsheet will help you turn your Gabor Granger survey data into an Optimal Price chart automatically. It will require a bit of editing of the formulas, but you can use my example data to match things up, and it’ll work smoother if you use OpinionX’s integration with Google Sheets as your data will be formatted the same way as mine was.
If you don’t want to use any of that, here’s an old-fashioned copy/paste template you can use on any survey tool of your choosing…
Copy/Paste Gabor-Granger Method Template
Qualifier Question: Would you purchase this product if it were available for a reasonable price?
▢ Yes → Go to $45
▢ No → Go to (Finish Page)
Q1. Would you purchase this product for $45?
▢ Yes → Go to $55
▢ No → Go to $35
Q2. Would you purchase this product for $55?
▢ Yes → Go to $65
▢ No → Go to $50
Q3. Would you purchase this product for $65?
▢ Yes → Go to $75
▢ No → Go to $60
Q4. Would you purchase this product for $50?
▢ Yes → Go to (Finish Page)
▢ No → Go to (Finish Page)
Q5. Would you purchase this product for $75?
▢ Yes → Go to $80
▢ No → Go to $70
Q6. Would you purchase this product for $60?
▢ Yes → Go to (Finish Page)
▢ No → Go to (Finish Page)
Q7. Would you purchase this product for $80?
▢ Yes → Go to (Finish Page)
▢ No → Go to (Finish Page)
Q8. Would you purchase this product for $70?
▢ Yes → Go to (Finish Page)
▢ No → Go to (Finish Page)
Q9. Would you purchase this product for $35?
▢ Yes → Go to $40
▢ No → Go to $25
Q10. Would you purchase this product for $40?
▢ Yes → Go to (Finish Page)
▢ No → Go to (Finish Page)
Q11. Would you purchase this product for $25?
▢ Yes → Go to $30
▢ No → Go to $15
Q12. Would you purchase this product for $30?
▢ Yes → Go to (Finish Page)
▢ No → Go to (Finish Page)
Q13. Would you purchase this product for $15?
▢ Yes → Go to $20
▢ No → Go to $10
Q14. Would you purchase this product for $20?
▢ Yes → Go to (Finish Page)
▢ No → Go to (Finish Page)
Q15. Would you purchase this product for $10?
▢ Yes → Go to (Finish Page)
▢ No → Go to (Finish Page)
In closing…
Gabor Granger is a powerful pricing research method that is a lot easier to run than most people think.
Use the ready-made resources from this guide to automate the selection of price points, branching structure, and analysis for your Gabor Granger surveys. Get out there and figure out your product’s optimal price -- whether you’re trying to expand to new markets, understand how customers perceive value in your product today, or identify a launch price for your latest innovation.
— Daniel
— — —
If you enjoyed this guide, consider subscribing to our newsletter:
About The Author:
Daniel Kyne is the Co-Founder of OpinionX, a survey platform that helps thousands of product research teams to better understand what matters most to their customers. OpinionX comes with a bunch of research methods, including pricing studies like conjoint analysis. Create your own Gabor Granger survey for free on OpinionX!