
Optimizing SaaS Pricing via MaxDiff & Conjoint Analysis Surveys (Case Study)
Anyone building a subscription product knows how tricky it is to get pricing right — especially when your customers have different needs at different points in the user journey.
Dogo, the world’s number one dog training application, was facing this challenge in late 2024. They had two tiers, Basic and Premium, but it wasn’t clear to users why they should upgrade or which features offered the most value. Some features were being used less than expected and others weren’t being recognized as Premium features at all, even though they were core to the product’s value.
They decided to team up with Applica (an agency that specializes in growing subscription products through experimentation) to understand which features mattered most to which users, how pricing influenced their decisions, and how Dogo’s subscription tiers could be restructured to better align their pricing with users’ core needs.
To achieve this, Applica conducted a three-part product research project — first, a MaxDiff survey to determine which value propositions resonated most with different customer segments, followed by a conjoint analysis survey to align features and price points with the needs of those key segments, and finally an A/B test to validate the effect of the changes made based on the two surveys.
The insights they uncovered through this research project delivered a 9.5% conversion rate uplift and a 13% increase in ARPU (average revenue per user) for Dogo.
This case study breaks down exactly how they achieved this — from a detailed step-by-step look at the research and analysis methods used to the specific insights they uncovered, all courtesy of the teams at Applica and Dogo who helped us put this together.

Introducing Dogo…
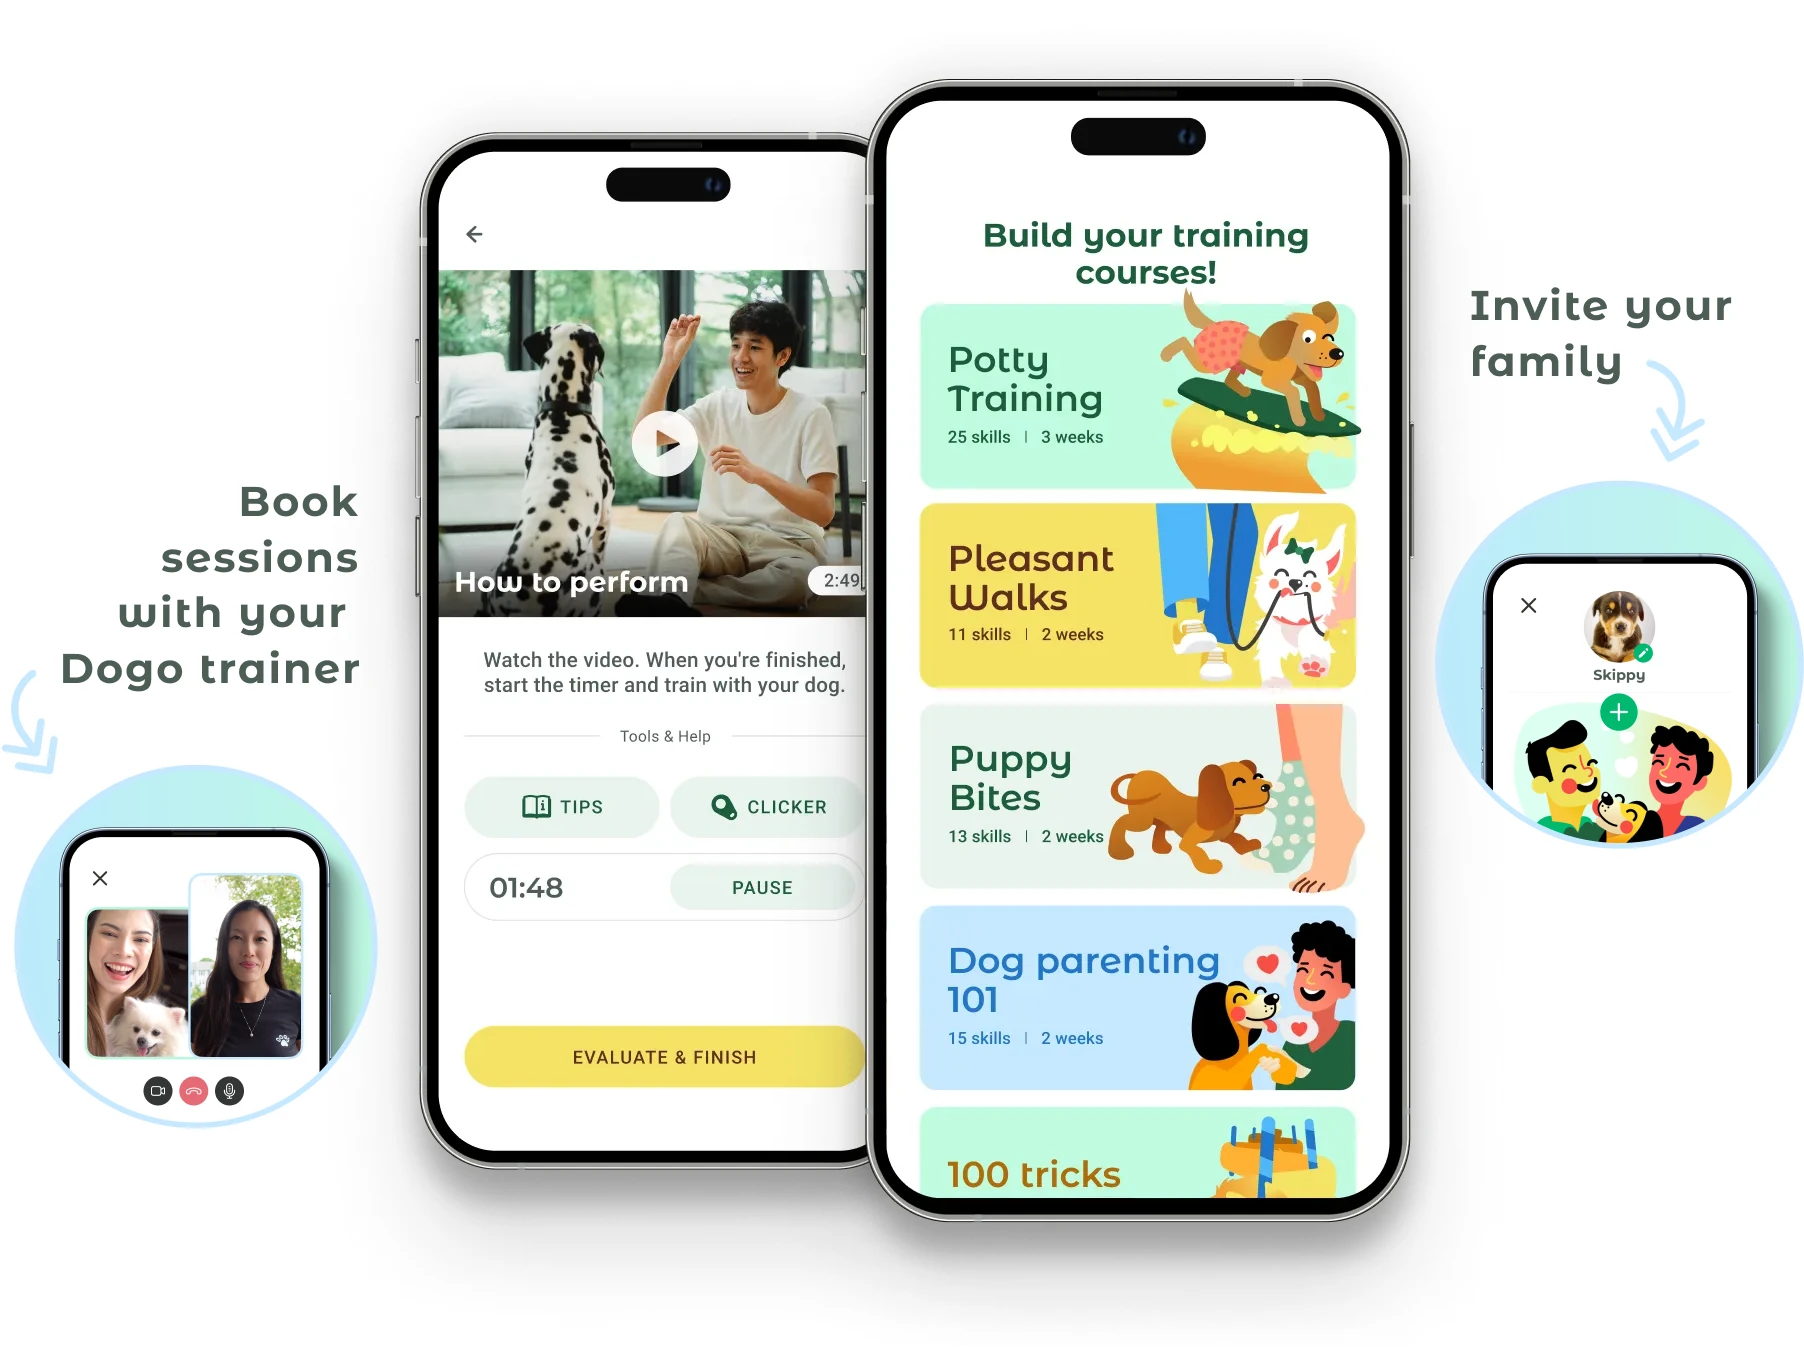
Dogo’s mobile app offers a range of solutions for dog training, from step-by-step behavior training programs and interactive games to a curated network of professional dog trainers and a global community of dog owners sharing their learnings together.
Although Dogo had already established a two-tier pricing model (Basic and Premium), they faced a number of challenges:
Complex sales messaging, squeezing every premium feature into their upgrade paywalls.
Unclear tiering, the difference between Basic and Premium was hard for users to understand.
One-size-fits-all approach, treating all users the same despite clear differences in needs.
Underutilized features on the Premium tier were not being effectively communicated.
Applica’s research objectives were clear:
Identify the most-valued features for each customer segment.
Improve paywalls with relevant messages for each user segment.
Optimize which features were included in each of the two paid plans.
Understand segment-specific price sensitivity and willingness to pay.
Part 1: Measuring User Needs By Segment
The Applica team began with a product audit to analyze the existing user experience, identify areas for messaging improvement, and define clear research objectives. Their initial focus was on the paywalls — often the first point where users encountered the product’s premium features.
They identified two key issues with the existing paywall:
Unclear Value: The paywall presented a long list of premium features, expecting users to infer the benefits of each. This led to information overload and hesitation to upgrade.
Generic Messaging: Despite millions of downloads, Dogo's paywall was a one-size-fits-all message that didn’t adapt to the differing needs of its diverse user base.
To better communicate the product’s value and deliver tailored messaging to each customer segment, the Applica team began by exploring what motivated different users to sign up for Dogo in the first place. They drafted a list of four core need-based statements that reflected common reasons why people use the app:
Quickly potty train your dog with daily steps.
Correct unwanted behavior like barking or biting.
Monitor dog health activities and get personalized advice from veterinarians.
Enhance bonding with your dog through interactive fun activities.
They initially considered using a simple survey with “5-star” rating scale questions but realized it wouldn’t give them the results they needed — after all, most dog owners would likely rate every statement as a very important 5/5 stars, making it impossible to see what truly matters most.
To get more useful data, they chose to run a MaxDiff Analysis survey instead. In a MaxDiff survey, participants are shown small sets of options (typically 3 or 4 at a time) and asked to pick the one they care about most and the one they care about least in each set. This forces survey respondents to make real trade-offs which reveals their priorities in a much clearer way.
^ Example of how voting on a MaxDiff Analysis survey works (create unlimited maxdiff surveys for free on OpinionX)
For Applica’s MaxDiff survey, each participant was shown four sets of three statements and asked to pick the most and least important in each set. This allowed the team to identify which needs were consistently a higher priority to their users.
The early results showed a clear overall winner: “Monitor dog health.” But rather than stop there and immediately start redesigning Dogo’s pricing model around this finding, the Applica team decided to dig deeper…
The Dogo team had long believed that the value a customer gets from their product depends heavily on their dog’s age — after all, puppy owners face very different training challenges compared to those with adult dogs. So Applica had included a simple follow-up question in the MaxDiff survey, asking whether each respondent owned a puppy or an adult dog.
When they filtered the MaxDiff results by age group, a vital insight emerged; while monitoring dog health ranked highest overall, it wasn’t the top priority for puppy owners. That group overwhelmingly prioritized potty training. And even better — when looking only at adult dog owners, interest in health monitoring was even stronger than the overall average.
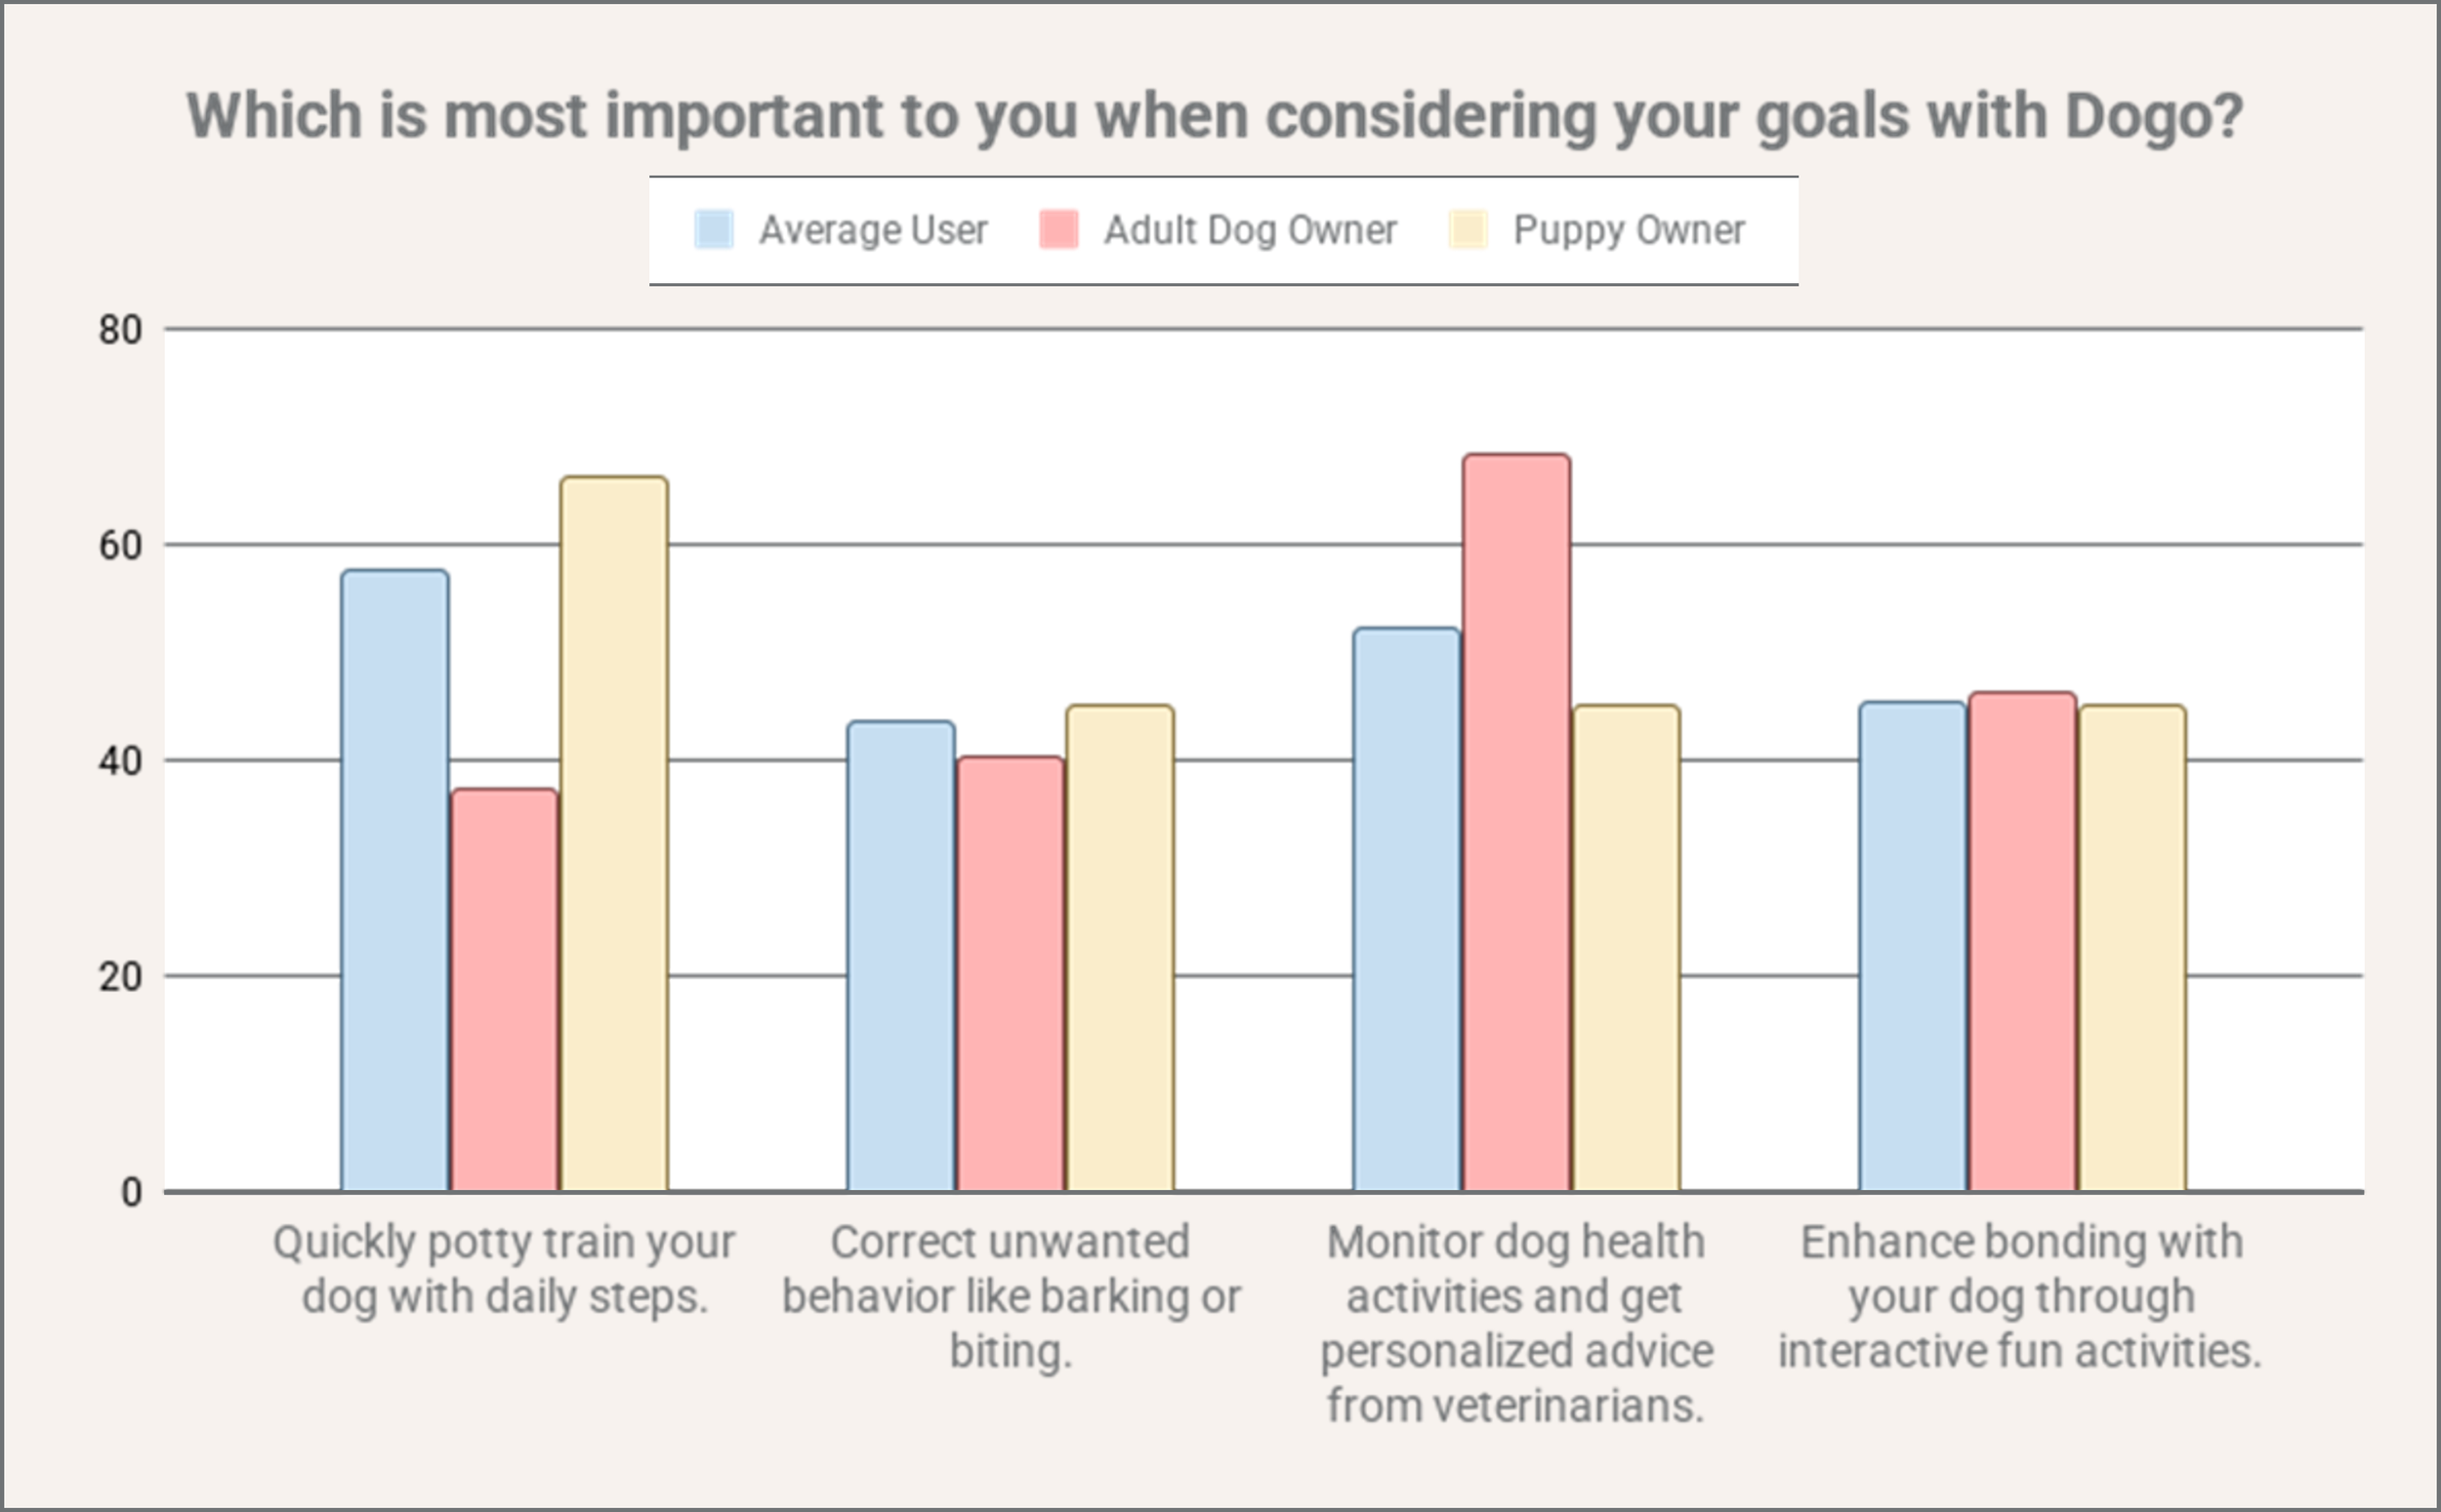
This gave the Applica team the data they needed to tackle one of their key research objectives: improving paywalls with more relevant messaging for each user segment. For example, they could now target puppy owners with a tailored paywall that highlights how premium features help with potty training and a separate paywall for adult dog owners highlighting health monitoring features.
Even though this insight checked off one big box on Applica’s list of objectives, the rest of their research goals remained unanswered…
— — —
Part 2: Pricing Optimization
While the MaxDiff results gave Applica ideal data on segmented user needs that could be used to personalize Dogo’s paywalls, three major questions still remained unanswered: Which features actually drove the most value for users? How should those features be bundled across the two pricing plans? And what prices would different customer segments be willing to pay?
These three questions centered around Dogo’s pricing tiers, so the Applica team decided to run a different kind of survey — one that showed dog owners a few hypothetical pricing options and asked which one they’d choose. By analyzing those choices, they could figure out which features influenced decisions the most and how sensitive users were to different price points.
This type of research is called Conjoint Analysis — a powerful survey method for simulating real-world buying decisions and modeling how users value different combinations of features and prices.
How does a conjoint analysis pricing survey work?
In a Conjoint Analysis survey, participants are shown 2–5 versions of a product at a time and asked to choose the one they like most. Each version (or “profile”) includes a different mix of features, benefits, and price points.
It’s like watching shoppers choose between different product packages on a shelf. By analyzing these choices across hundreds of votes, you can measure how much each individual feature influences the likelihood of someone picking a particular plan — revealing which features drive the most value, how people make trade-offs between features and price, and what combinations are most appealing to different customer segments.
^ Screen recording from Dogo’s conjoint analysis for pricing optimization survey hosted on OpinionX
Selecting the right Conjoint Analysis survey tool
The Applica team evaluated several survey platforms to find the best fit for their Conjoint Analysis research:
Qualtrics
✓ Pros — Powerful analytics
✕ Cons — Complex and costly setup
$ Price — Over $20,000/year for conjoints
SurveyMonkey
✓ Lots of basic survey features
✕ Doesn’t have self-serve conjoint format
$ Enterprise contract + $1000/project
Conjointly
✓ Offers a wide range of research methods
✕ Complex interface and flexibility limitations
$ Premium plans start from $2895/year
Sawtooth Software
✓ Advanced analysis reports
✕ Unaffordable entry price
$ Starts at $4500/year per seat
OpinionX
✓ Affordable, easy to use regardless of experience, unlimited responses per survey for free
✕ Recruitment is self-managed or facilitated through panel partners
$ Most affordable premium plan for conjoint analysis, from as low as $30/month
After mapping out their research requirements, Applica realized that OpinionX was the only platform that checked every box:
DIY setup: They could build and launch the conjoint survey themselves — unlike SurveyMonkey and Qualtrics, which required working with their paid consultants for conjoint analysis.
Custom survey flow: They could add questions before and after the conjoint task, like asking users whether they owned a puppy or adult dog — something not possible with Conjointly.
Segmented analysis: They could easily compare results by dog age using OpinionX’s Segments Tab. Sawtooth, by contrast, doesn’t support crosstab analysis with conjoint data.
So not only was OpinionX the most intuitive and cost-effective tool — it was also the only platform that gave Applica the full flexibility they needed to answer their key research questions.
Survey Design
To explore different pricing combinations for Dogo, the Applica team focused on eight attributes:
Price
Step-by-step behavior training
Potty training & smart reminders
Interactive games & tricks
Health tracking & insights
AI assistant for training support
Explore dog-friendly walking routes
Community & social meetups
Each voting set in the survey would show two pricing plans side-by-side. Every plan included one of four possible prices ($49, $59, $69, or $79) and each feature would be marked with a simple ✓ (included) or ⨉ (excluded).
To prevent unrealistic comparisons — like a $49 plan packed with features going up against a $79 plan with none — the team used OpinionX’s Prohibited Pairs feature. This allowed them to control which combinations of features and prices could appear together, ensuring each profile reflected a realistic trade-off.
In total, they used this feature to create 63 unique, balanced profiles that could be mixed and matched across the survey — enough to produce meaningful variation while still simulating realistic potential pricing plans.
They started the survey with three slides before the conjoint voting section:
Welcome Slide → Short welcome and explanation about the $50 voucher raffle.
Conjoint Explainer → Overview of conjoint voting (eg. that some options appear many times).
Feature Explanations → Quick description of the features that would appear during voting.
Once the conjoint analysis voting finished, they were shown three additional pages:
Segmentation Question → Which age group does their dog belong to (5 options shown).
Email Identifier → Optional question if participants wanted to be entered into the raffle.
Finish Page → Thanked participants for sharing their opinions, signaling the end of the survey.
Recruiting Participants
Applica recruited 600 dog owners to complete the survey using in-app notifications on Dogo that mentioned the $50 gift card raffle all participants would be entered into. Participants were recruited across 3 main segments:
Puppies (6-12 months) = 445 participants (74%)
Adults (1-6 years) = 142 participants (24%)
Senior (6+ years) = 13 participants (2%)
Survey Results
OpinionX automatically turns participant votes into easy-to-read results, including for conjoint analysis surveys. For the Dogo survey, it was instantly clear that some features were a lot more important to target customers than others:

These results are even more interesting when you look at these scores for each of the three key customer segments separately, which you can do using a Crosstab Analysis table:
A crosstab is a table that lets you compare two or more types of data to see how often they overlap. Usually this is just simple data (like comparing two multiple-choice questions), but OpinionX is the only research tool that lets you bring conjoint analysis results into a segmentation crosstab like in the example above.
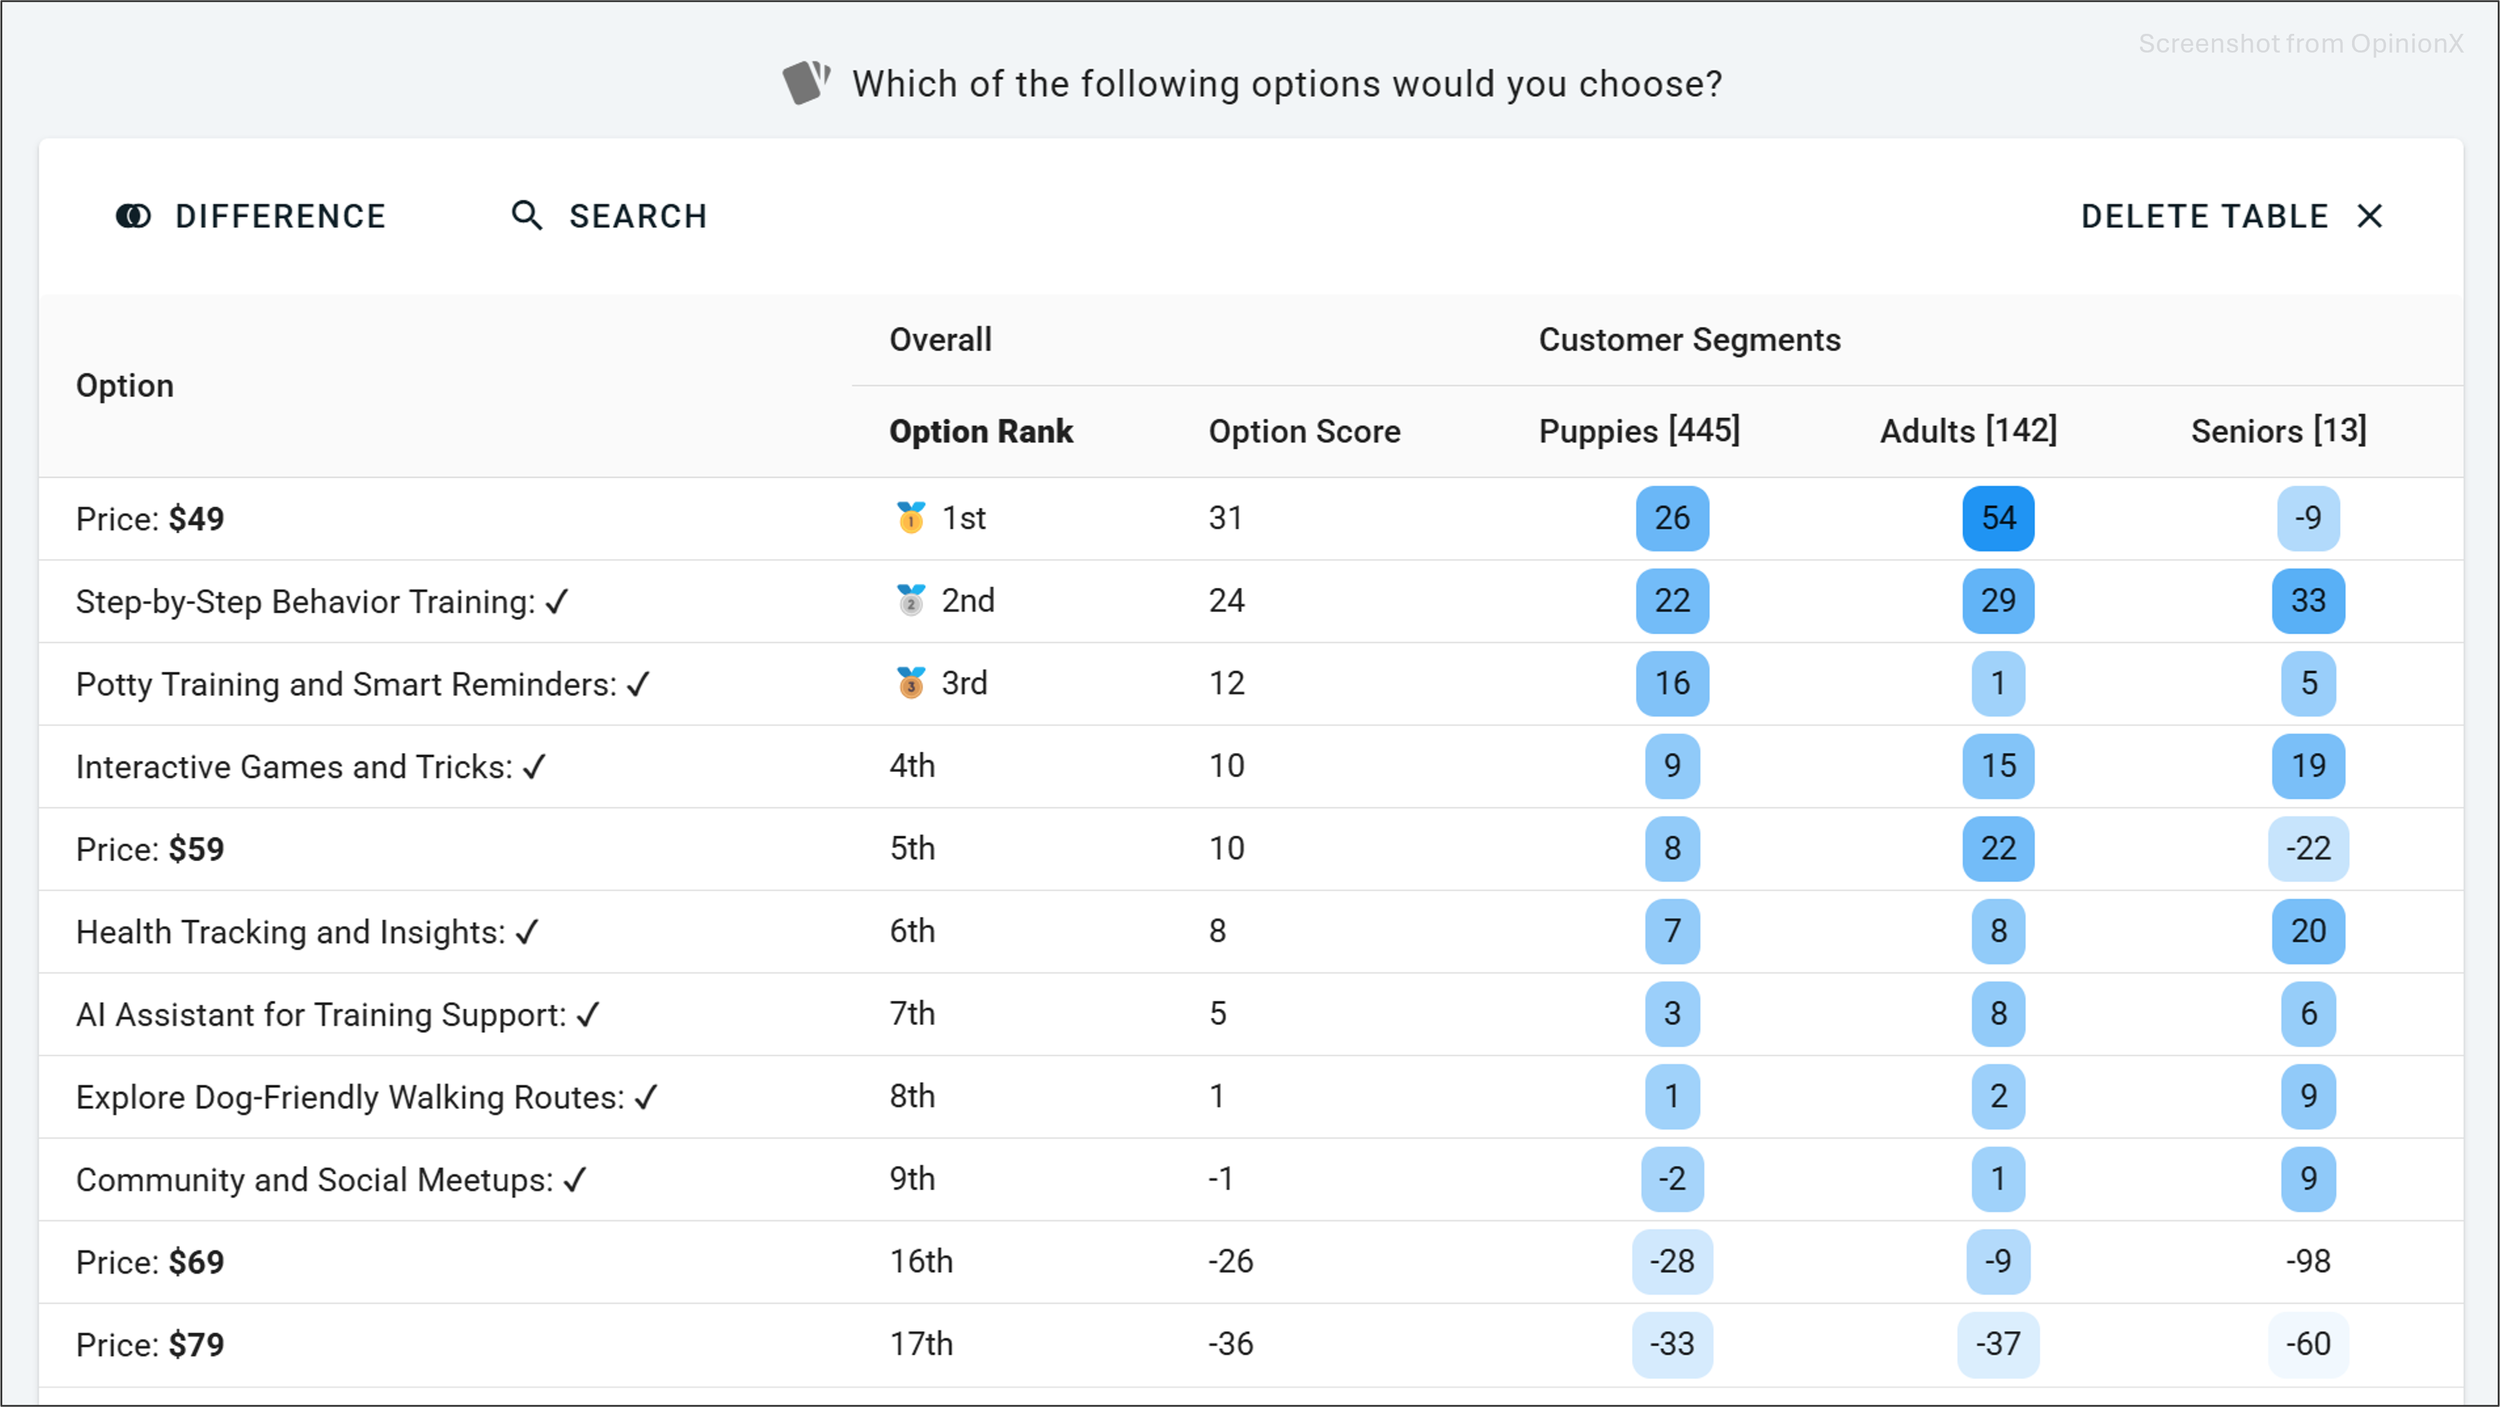
Here’s a more simplified version focusing just on the seven features from the Dogo survey:

I’ve put a box around the row for the Health Tracking feature. The three blue boxes in this row show the importance score for this feature for each of Dogo’s three key customer segments: Puppy Owners, Adult Dog Owners, and Senior Dog Owners. The importance owners place on Health Tracking is only moderately high for Puppies (7) and Adults (8), but once a dog falls into the Seniors category, the importance of Health Tracking jumps up to 20.
OpinionX lets you load up to 30 segments into a crosstab table at the same time, making it very easy to spot these outlier opinions. Alternatively, you can use OpinionX’s AI-powered clustering feature to see which types of participants voted the same way.
There are some of the big discoveries revealed in the Dogo Conjoint crosstab, such as…
Puppy Owners prioritize Potty Training (16) as a feature considerably more than other participants (1), further validating the main finding of the previous MaxDiff survey. They are also the segment with the lowest price sensitivity — the total score range between the highest and lowest price was just 59 points, compared to 91 and 89 for Adults and Seniors.
Senior Dog Owners ranked Health Tracking as their second-highest priority, considerably higher than owners of younger dogs. They were more interested in Dog-Friendly Walking Routes and Community Meetups than other users, who were mostly apathetic towards these features.
Adult Dog Owners were interesting. They showed a higher preference for Behavior Training and Interactive Games than Puppy Owners, but were overshadowed on both of these by the Senior Dog Owner segment which, as a segment, valued these two features the most within the userbase. Adult Dog Owners had little interest in Community or Dog-Friendly Walking Routes, and were similarly highly price-sensitive like Senior Dog Owners.

One of the most valuable insights from our analysis was that puppy owners had a significantly higher willingness to pay compared to all other segments. This was evidenced by:
Their substantially lower price sensitivity ranges, 59 for puppies vs. 89–91 for older dogs.
Strong preference patterns even when premium features were attached to higher price points.
Consistent selection of more expensive packages when they included puppy-specific features.
This finding presented a clear opportunity to optimize pricing strategy by life stage, potentially charging premium prices during the puppy phase when parents are most willing to invest in their dog's development.

To further refine the feature bundles and pricing strategy, Applica conducted a detailed willingness-to-pay analysis across three price difference scenarios ($10, $20, and $30 differences). This revealed a number of further insights, such as:
Step-by-step behavior training scored consistently high regardless of price, indicating strong willingness to pay premium prices for this functionality.
Potty training and smart reminders maintained a high score at more expensive price points, indicating importance of the feature to customers.
Health tracking and insights demonstrated decreasing likelihood of selection when the price increased — users were willing to pay for it, but not at a high price.
This advanced analysis helped identify which features justified premium pricing and which were essential basic offerings.
— — —
Part 3: Recommendations
Based on Applica’s comprehensive analysis, they developed the following recommendations for Dogo's subscription strategy:
A. Feature Tiering
Basic Tier:
Include Health Tracking & Insights as the foundational feature.
Add Interactive Games to deliver core engagement value.
Consider a simplified free version of Behavior Training to meet fundamental user needs.
Premium Tier:
Position Step-by-Step Behavior Training as the flagship premium feature.
Include Potty Training & Smart Reminders on the Premium tier to attract puppy owners.
Add AI Assistant for Training Support to enhance perceived innovation and value.
B. Pricing Strategy
Maintain a moderate price gap between tiers to optimize conversion.
Target higher prices toward puppy parents who demonstrated significantly higher willingness to pay in the conjoint analysis survey.
Consider segment-based discounts to convert more owners of older dogs, as this segment showed higher price sensitivity.
Test promotional strategies emphasizing value-to-price ratio rather than absolute price.
C. Personalized Paywalls
Use tailored paywalls that show different messages depending on the customer segment.
Display each personalized paywall based on dog age as the key segmentation indicator.
Focus on the underlying need that premium functionality addresses instead of a list of features.
Part 4: Testing & Validation
Applica guided the Dogo team through a pricing plan update and paywall redesign to implement the findings of their two studies. They developed new conversion messaging that addressed the unique needs of each group, helping users see the relevance of Dogo’s premium features based on their specific motivations.

To validate this, they ran a two-month A/B test to compare the old pricing plan and paywall against the new tailored versions. The updated approach drove a 9.5% increase in conversion rate and an overall lift of 13% ARPU (average revenue per user).
— — —
Part 5: Conclusion & Key Learnings
The MaxDiff and Conjoint Analysis studies that Applica ran enabled Dogo to make data-driven decisions around subscription feature bundles, pricing strategies, and segment-specific value propositions.
Key Learnings:
Conjoint Analysis is uniquely valuable for subscription apps, providing accurate, quantifiable insights into user preferences and pricing sensitivity.
MaxDiff Analysis is ideal for assessing user needs, helping teams measure user priorities using a lightweight survey that is easy to setup and analyze.
A carefully chosen tool like OpinionX can deliver actionable insights at significantly lower cost, eg. under $300 on OpinionX vs. over $4500 on alternative survey tools.
Segment-specific strategies, like targeting puppy owners differently due to higher willingness to pay, can unlock significant revenue growth opportunities.
Conjoint findings become truly valuable when validated with testing, ensuring real-world applicability and measurable results.

About Dogo
Dogo is an innovative dog training app designed to strengthen pet-owner bonds through engaging, expert-guided training content. It offers tailored experiences for puppy and adult dog owners alike, helping pets grow healthier, happier, and well-behaved.
About Applica
Applica helps mobile apps grow faster through data-driven experimentation and optimization. They combine behavioral science, sharp analytics, and clear, actionable insights to improve user experience and increase revenue.
About OpinionX
OpinionX is the survey platform for product research, helping teams measure what matters most to their most important customer segments. OpinionX combines advanced research formats and analysis methods together with an easy-to-use survey tool, enabling customer research projects at affordable prices (even for those who are scared of stats).