
“Marginal willingness to pay (MWTP) is how much extra a customer will pay for one specific upgrade to a product, holding everything else equal.”
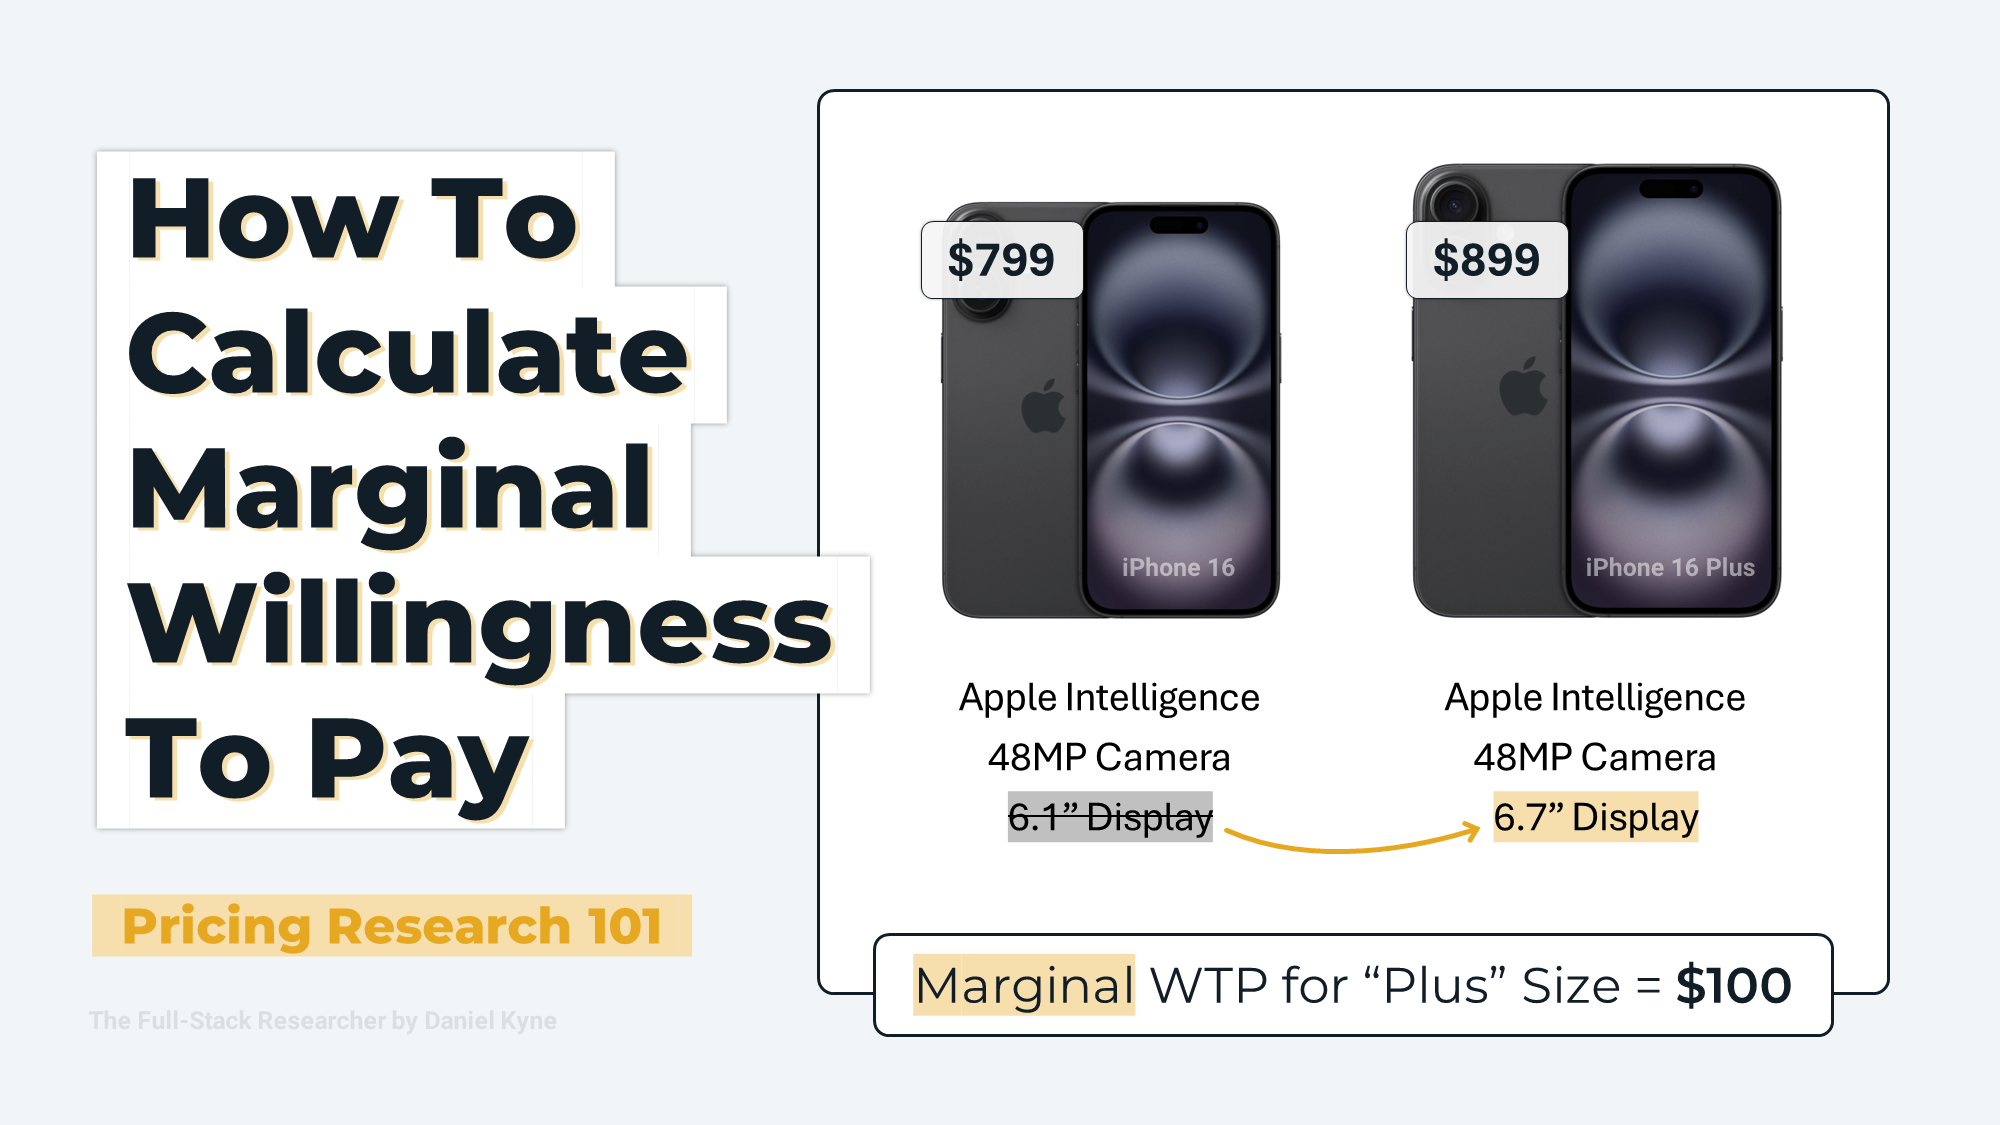
If the average customer would pay $799 for a standard iPhone and $899 for the same phone with a larger screen, the marginal willingness to pay for the larger screen is $100. You calculate it from a conjoint analysis survey: conjoint gives each product attribute a utility score, you work out the dollar value of one utility point from the price attribute, and you convert every option's marginal utility into a dollar figure. The formula is −MU × DPU (marginal utility times dollars per utility). It's used to price tiers, pick which premium features to market, and find the customer segments that value an upgrade enough to pay for it. You can run the whole thing manually in a spreadsheet or have a tool like OpinionX generate the report automatically.
What is marginal willingness to pay?
Marginal willingness to pay is how much more (or less) a customer will pay when you change a single characteristic of a product, compared to a baseline version.
Break the term in two. Willingness to pay is how much money a customer would spend to buy your product; say the average customer's willingness to pay for the latest iPhone is $799. Marginal willingness to pay tells you how much extra that same customer would pay to buy a larger-screen version instead of the standard one. "Marginal" means incremental: against the baseline, how much more or less does a customer value the product when you change just one characteristic.
One thing it isn't: the overall value of the product, or the value of the screen on its own. It's only ever the gap between this specific upgraded version and the baseline you're comparing it to.
What can you use a marginal willingness to pay study for?
Measuring how customers value different parts of your product in dollar terms feeds directly into pricing strategy. A few of the most common uses:
Optimising monetisation: check whether you're undervaluing tiers by seeing how much customers would pay for each upgrade on your premium plans compared to the base plan.
Premium marketing: find which premium features have the highest marginal willingness to pay and make those the headline features you promote.
Expansion opportunities: segment the results to find groups that value particular features far above average, which flags features you could spin out as optional paid add-ons.
Prioritising high-value features: run an MWTP study on unreleased features to see which hypothetical additions customers would value most.
What data do you need to calculate marginal willingness to pay?
MWTP is calculated from the results of a conjoint analysis survey. Conjoint surveys are straightforward to run, and some tools offer them on a free tier, so the calculation is more approachable than it sounds.
What is conjoint analysis?
Conjoint analysis is a survey format where people see a series of products, each with different features and prices, and vote for the one they prefer. Their choices reveal which attributes matter most to them, and the most preferred option within each attribute. It comes in several types, and if it's more than you need, there are simpler alternatives.
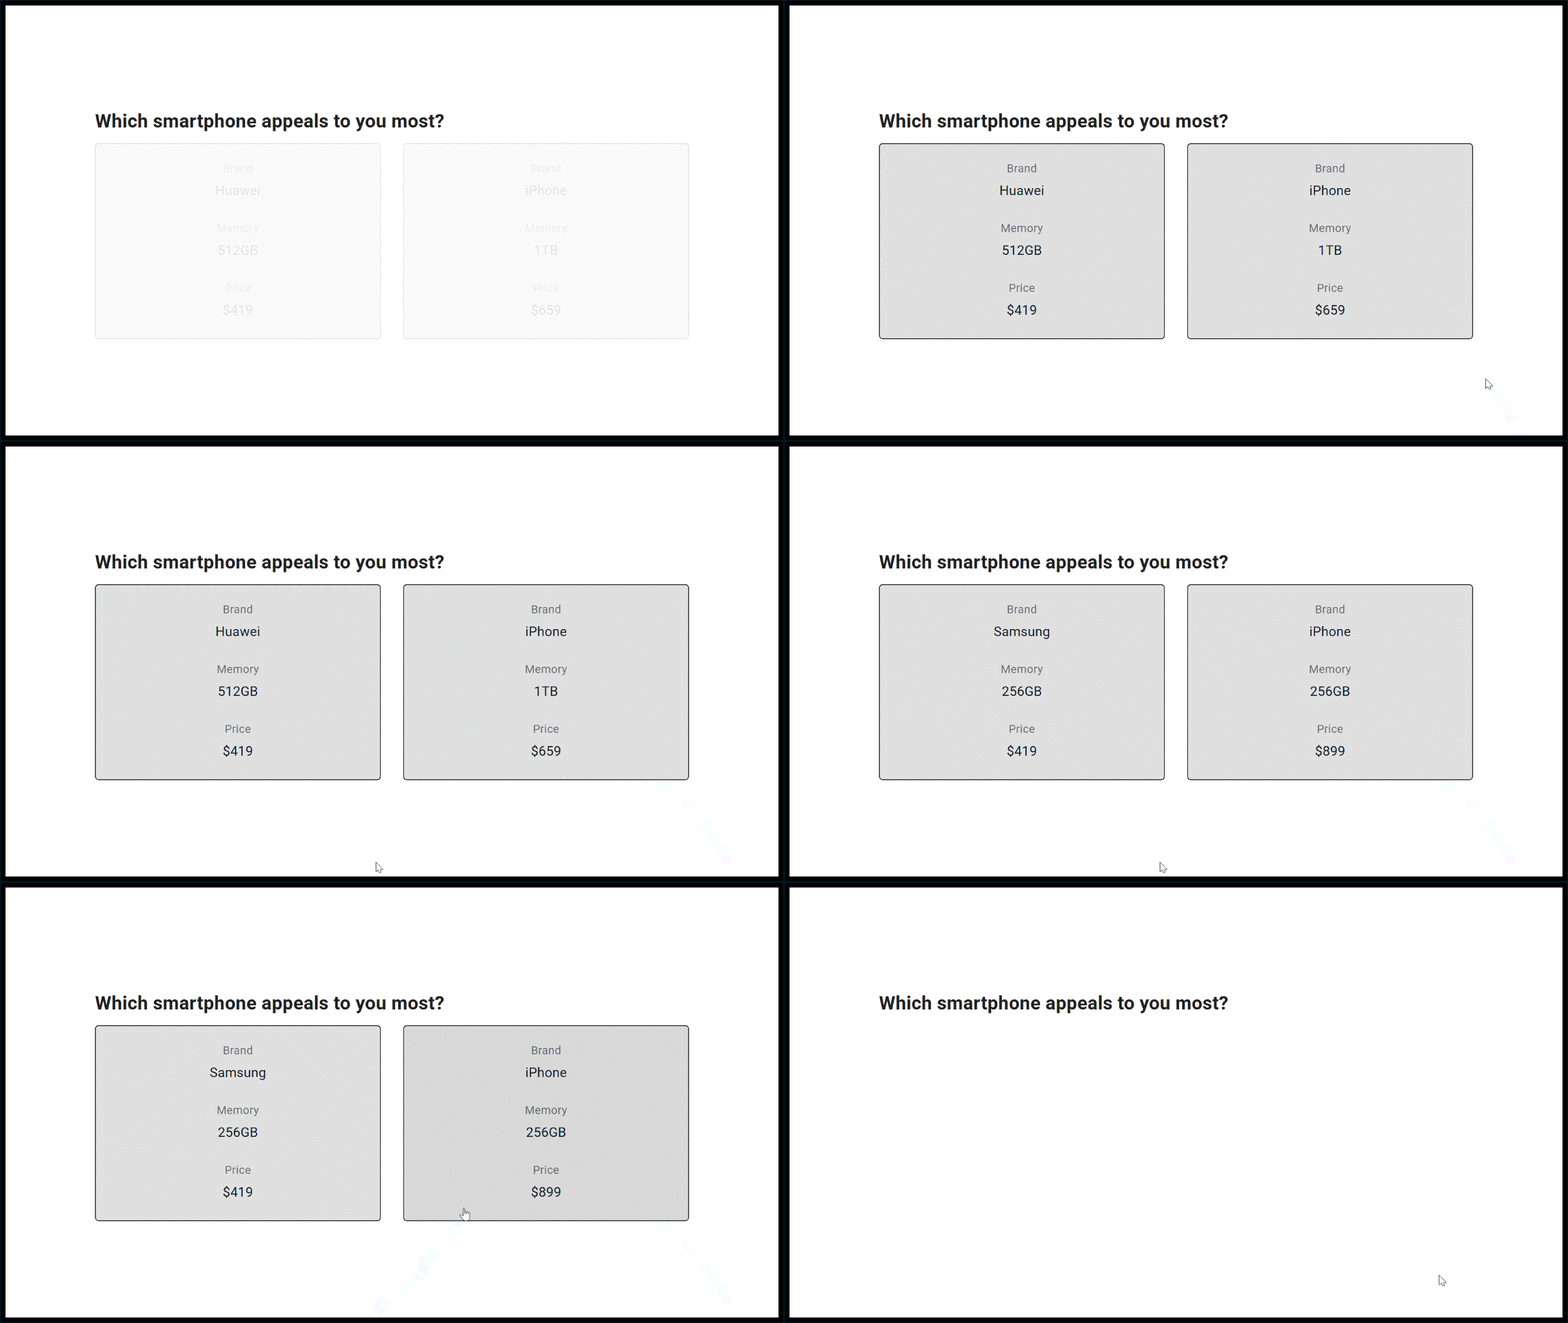
In this example, the brand attribute has options like iPhone, Google Pixel and Samsung. Picture planning a family BBQ on a small budget: you can't buy multiples of everything, so you run a conjoint survey to see which attributes matter most (patty, sauce, salad, bun) and which options win within each (chicken, beef or vegan for the patty). If the patty attribute has the widest range of scores, it affects people's choices most, so you'd prioritise buying patty types and spend less on sauces.
Conjoint suits decisions with non-fungible attributes: separate parts of a decision you can't remove, the way you can't drop the bun and still call it a burger.
Conjoint analysis for pricing research
Conjoint works for pricing because one of the attributes you test is price itself. Include price as an attribute with several levels and you learn how much utility customers assign to each price point, which is what lets you convert everything else into a dollar figure. That's the bridge from a preference score to a willingness-to-pay number.
How to calculate marginal willingness to pay from conjoint analysis
I'll show two ways to build an MWTP report: automatically on a tool like OpinionX, or manually from raw conjoint data in a spreadsheet. The example throughout is the smartphone survey shown above.

Option 1: Automatic MWTP report via OpinionX
OpinionX generates the MWTP report from your conjoint results. Those results show as a data table of utility scores representing the relative importance of each option to participants.
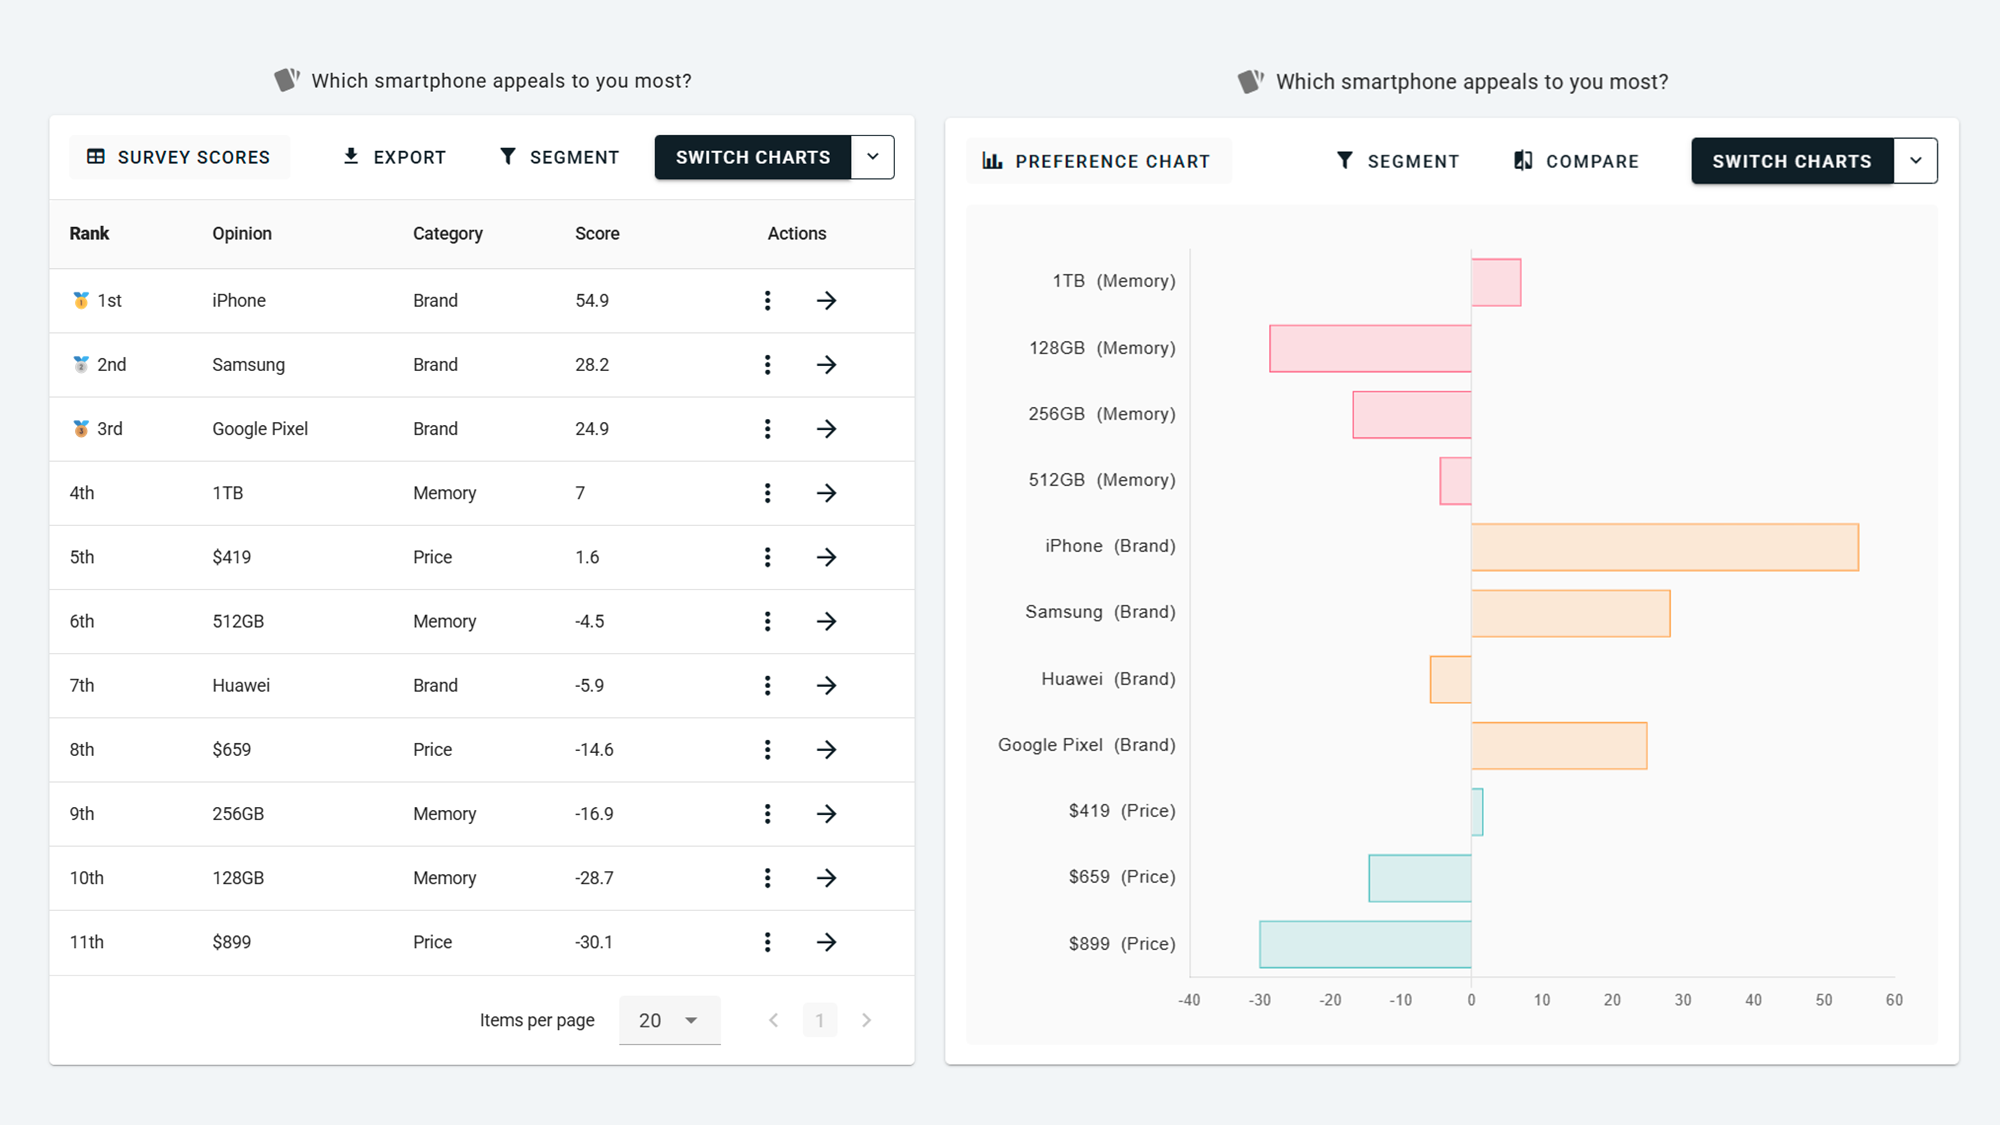
It then plots a graph with price on the x-axis and utility score on the y-axis. The price points sit on the graph with a trendline between them, showing the relationship between price and score, which is the price per utility. That's calculated for you, though you can always see the underlying trendline equation and the R² (how well the trendline fits) by clicking Configure.

Below the price/utility chart is the MWTP for each option, with one blank row per attribute group for the baseline option you're comparing against. Click any bar to make that option the new baseline, or set your baselines from the Configure menu. In this example, customers value an upgrade from 128GB to 256GB of storage at $162.34 in relative terms.

The real advantage of the automated version is filtering. Click the "Android" bar and the report filters to current Android customers only, and the relative value of iPhone as a brand drops considerably. You can try the interactive results yourself with no login: scroll to the conjoint results table, click Switch Charts, and choose the Willingness To Pay format.

Segmenting these results is where the method pays off. The average across all your customers gives you a blended figure that hides the interesting cases; split it by customer type and you find the segment that would happily pay for the upgrade. Only the automated chart lets you filter like that; the manual method below can't.
Option 2: Manual MWTP report via Google Sheets
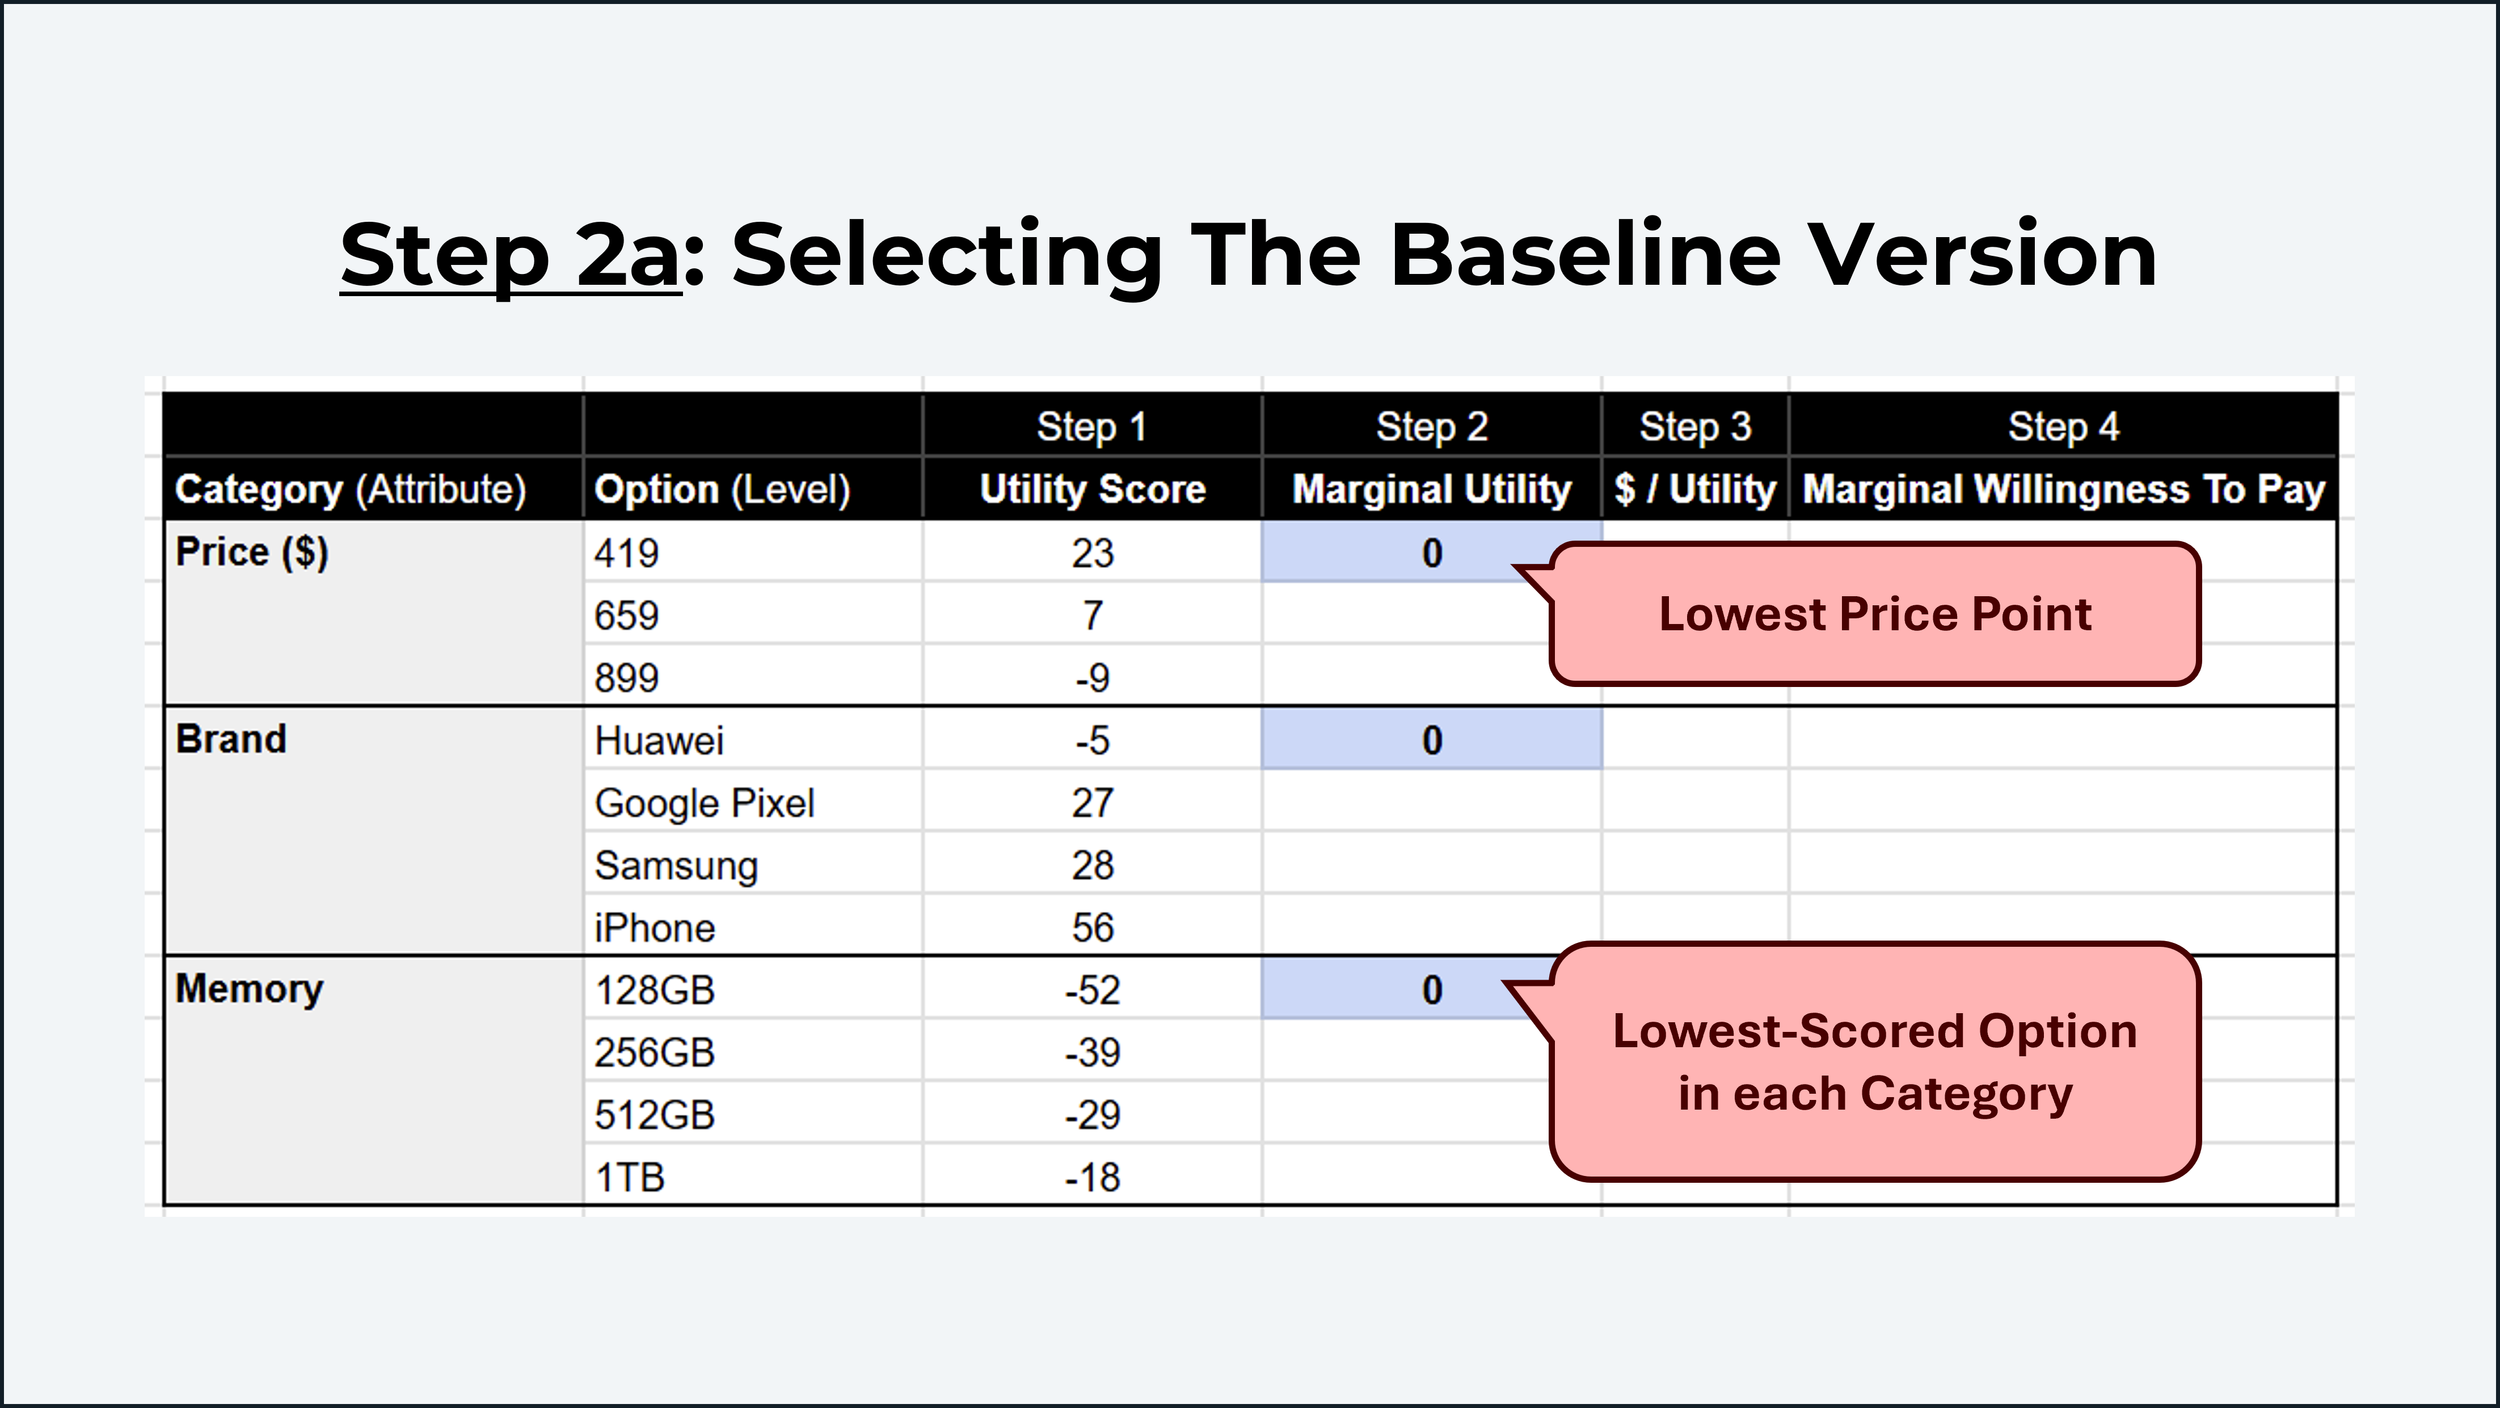
Four steps turn conjoint results into an MWTP report: utility scores, marginal utility, dollars per utility, and marginal willingness to pay. Start with a blank spreadsheet and a table of your categories, options, and four columns.
Step 1: Utility scores. Copy the utility scores for each option from your conjoint survey into the spreadsheet. These scores show for free on your OpinionX results, even on the free tier.

Step 2: Marginal utility. Marginal utility is the difference in score between two options. First pick a baseline version; I keep it simple by choosing the lowest price point and the lowest-scored option in each category, giving each a marginal utility of 0. Then subtract the baseline score from each option's score within the same category. These numbers tell you how much more or less someone values an option versus the baseline (for example, people might value Google Pixel "32 points" above Huawei).

Step 3: Dollars per utility. To turn marginal utility into money, calculate how much the price changed against how much the score changed, using (Price2 − Price1) ÷ (Utility2 − Utility1). In a linear relationship, every price gap gives the same answer (say a $15 price drop equals one utility point). Sometimes it isn't linear, which is covered below.

Step 4: Marginal willingness to pay. The formula is −MU × DPU, where MU is the marginal utility from step 2 and DPU is the dollars per utility from step 3. Remember the minus sign.

How to create a marginal willingness to pay graph
The MWTP report has two components:
The marginal willingness to pay chart, showing how much a customer would pay to switch from the baseline version to a specific one-attribute upgrade.
The price/utility graph, showing the relationship between price points and their utility scores, which is the basis for the financial analysis in the MWTP chart.
You can build both in Google Sheets with the manual method above, or use the automated report that comes with conjoint surveys on OpinionX.

What should you do when price and utility create a non-linear curve?
Most of the time the relationship between price and utility isn't perfectly linear, meaning a price change affects utility differently at the high and low ends of your range. A linear relationship gives a consistent score change per dollar wherever it happens, and that's the uncommon case. More often price/utility is curved, S-shaped or U-shaped.

Curved: customers care more about small price increases when the price is low. Between $30 and $50 a minor increase moves utility a lot, but above $70 each extra dollar matters less. The curve shows where buyers are most and least price-sensitive.
S-shaped: sensitivity is highest in the middle of the range and flattens at both ends.
U-shaped: sensitivity is highest at the extremes and lowest in the middle.
How do you build an MWTP report when price/utility is non-linear?
When the relationship isn't linear, don't use a single dollars-per-utility figure across the whole range. Calculate dollars per utility locally instead, between the two price points that bracket the option you're valuing, so each marginal willingness to pay figure uses the price sensitivity that actually applies at that part of the curve. On OpinionX the trendline and its equation handle this for you; in a spreadsheet you calculate DPU per segment rather than once for the whole range.
Frequently asked questions
What is marginal willingness to pay? It's how much extra a customer will pay for a single specific upgrade to a product, compared to a baseline version, holding everything else equal. If someone would pay $799 for a standard phone and $899 for the same phone with a bigger screen, the marginal willingness to pay for the bigger screen is $100.
How do you calculate MWTP? From a conjoint analysis survey. Get each option's utility score, work out the dollar value of one utility point from the price attribute (dollars per utility), then multiply each option's marginal utility by that figure. The formula is −MU × DPU.
What's the difference between willingness to pay and marginal willingness to pay? Willingness to pay is the total amount someone would pay for a product. Marginal willingness to pay is how much more they'd pay for one specific change to it, like a single upgraded feature, against a baseline version.
What survey method measures marginal willingness to pay? Conjoint analysis, because it includes price as one of the attributes and so reveals how customers trade off price against every other feature. Other pricing methods like Van Westendorp and Gabor Granger measure overall price sensitivity, not the value of individual attributes.
Can you calculate marginal willingness to pay for free? Yes. You can run the conjoint survey on the OpinionX free tier and either read the automated MWTP report or export the utility scores and build it manually in a spreadsheet.
Marginal willingness to pay turns a preference score into a dollar figure, which is what makes conjoint so useful for pricing. Get the utility scores, find the value of one utility point from the price attribute, and convert each upgrade into money. Then segment the result, because the average dollar value hides the thing you'll act on: the specific group who would pay for the upgrade.
Want more like this? Over 42,000 researchers and product people get The Full-Stack Researcher in their inbox. Subscribe for the next one.
You can run the conjoint survey behind an MWTP report on OpinionX for free: $0, unlimited surveys, unlimited researcher seats, capped at 25 participants per survey, then $900 a year to lift the cap (full pricing). The automated willingness-to-pay report and result segmentation are included. Create a conjoint survey, or read the full conjoint guide first.
About The Author:
Daniel Kyne is the Founder & CEO of OpinionX, a market research tool for modern product teams — used by thousands of researchers to better understand what matters most to their customers. OpinionX is a leading platform for conjoint analysis and comes with an easy-to-use Marginal Willingness To Pay report. Create a free Conjoint Analysis survey on OpinionX today!