
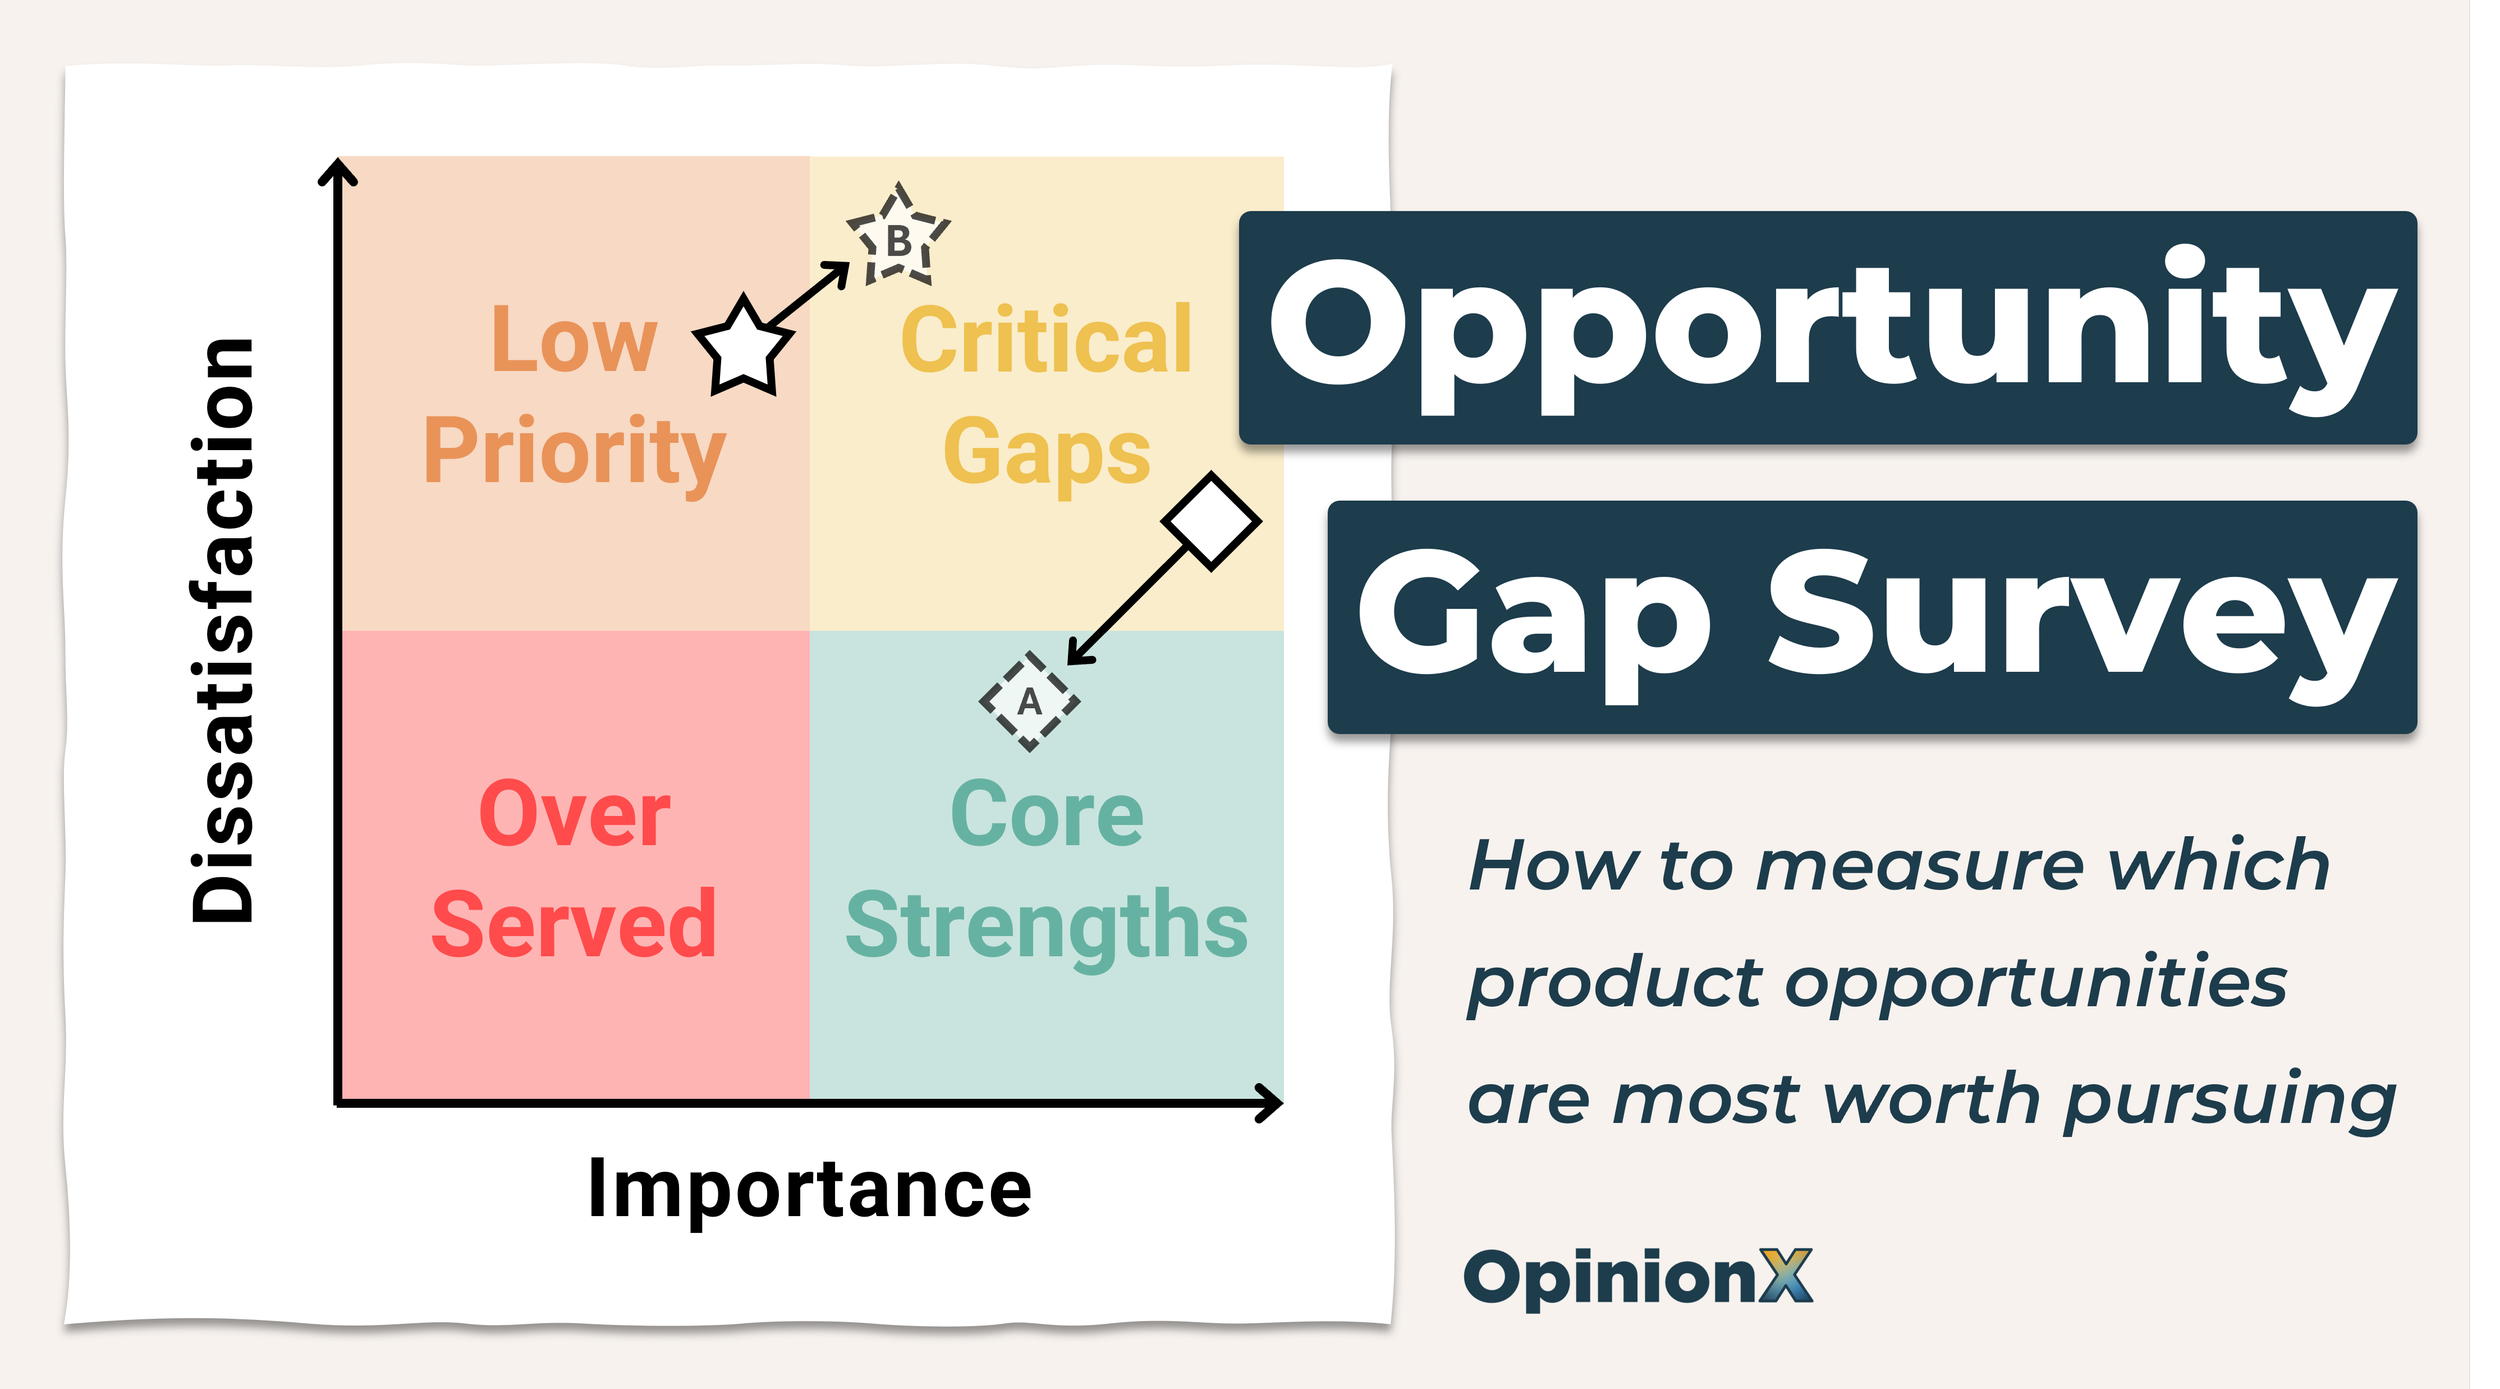
“An opportunity gap survey finds which customer problems are worth solving by measuring two things for each problem: how important it is to customers, and how dissatisfied they are with the current options. Plot importance against dissatisfaction on a scatterplot and the problems in the high-importance, high-dissatisfaction corner are your biggest opportunities, the “critical gaps”. Don’t use rating scales to measure this, because they produce straightlining and can’t handle long lists; use comparison-based methods like pairwise comparison or MaxDiff instead, which force people to compare options and rank them properly. It’s a prioritisation exercise that replaces opinions and anecdotes with customer data, and it fits neatly in the middle of discovery research or roadmap planning.”
When should you use an opportunity gap survey?
It's a prioritisation exercise. Instead of everyone arguing from opinion and anecdote about what to work on, it puts objective customer data at the centre of the conversation and gives the team a shared way to decide when hard data is scarce.
The two most common times teams reach for one are discovery research and roadmap planning.
Discovery research tends to follow a three-part process, the Discovery Sandwich:
Broad discovery: uncover as many insights as possible about customers' needs, pains and desires.
Prioritisation: shortlist those needs by identifying which have the most impact potential. (This is the step the survey handles.)
Deep dive: learn as much as you can about the top-ranked priorities, like when they occur, to whom, how often, at what cost, the current solutions used, and why those fall short.

It works well in the middle of that sandwich, giving you quantitative data to prioritise the insights uncovered during broad discovery. It fits into roadmap planning the same way:
Overall strategy: align the team behind current objectives and product goals.
Fact finding: gather customer feedback, usage data, research findings and internal suggestions.
Prioritisation: create a shortlist of projects for the coming month, quarter or year. (Again, the survey's job.)
In both cases you start with mostly qualitative insights, and the opportunity gap survey adds the quantitative data to decide which to focus on. Even outside discovery or roadmap work, if your situation fits that basic premise, some version of it will probably work for you too.
How do you design an opportunity gap survey?
These surveys are usually designed with rating-scale questions, showing each option with a 1 to 5 rating, first for importance and then again for satisfaction. I'd strongly recommend against rating scales, for four reasons.
Forced shortlisting. The whole point is to avoid prioritising on untested assumptions. Rating scales generally require every participant to vote on every option, so with a long list your survey becomes unfeasibly long, forcing you to shortlist the options yourself beforehand. One widely shared guide recommends using the RICE framework to shortlist insights before building the survey, but that pre-research shortlisting is exactly what we want to avoid.
Straightlining. Rating-scale questions are among the most likely to suffer straightlining, a response bias where a participant gives every option the same score. That produces low-quality results and wastes everyone's time.
Scale interpretation. What does a 4 out of 5 actually mean? Something different for everybody. Text labels help a little, but it's not a consistent way to measure importance.
Repetition. Completing 20-plus rating-scale questions is extremely boring, and I wouldn't wish that on anybody, least of all a high-value customer.
Comparison-based ranking methods like pairwise comparison or MaxDiff analysis suit the job far better.
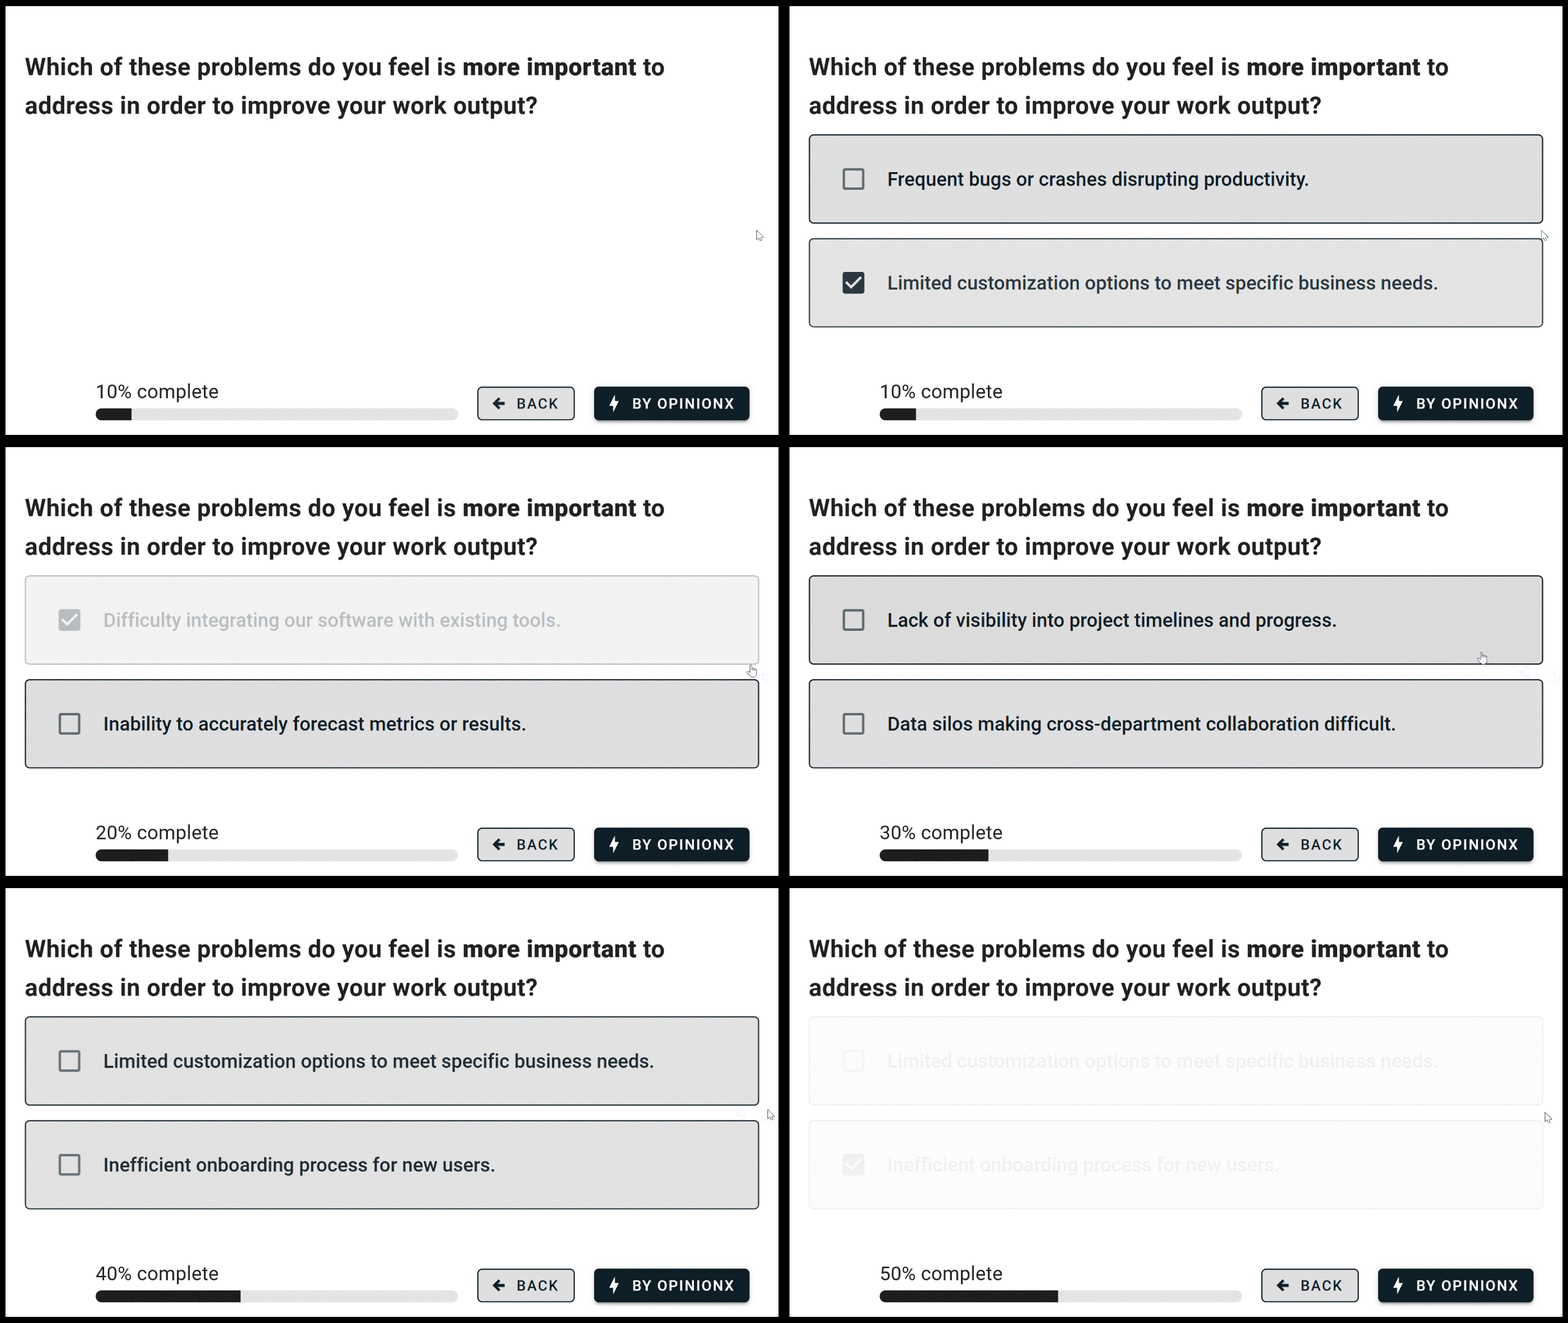
^ Example of a Pairwise Comparison survey being used to measure relative importance
Pairwise comparison turns your list into a series of head-to-head votes and ranks options by the percentage of votes they win.
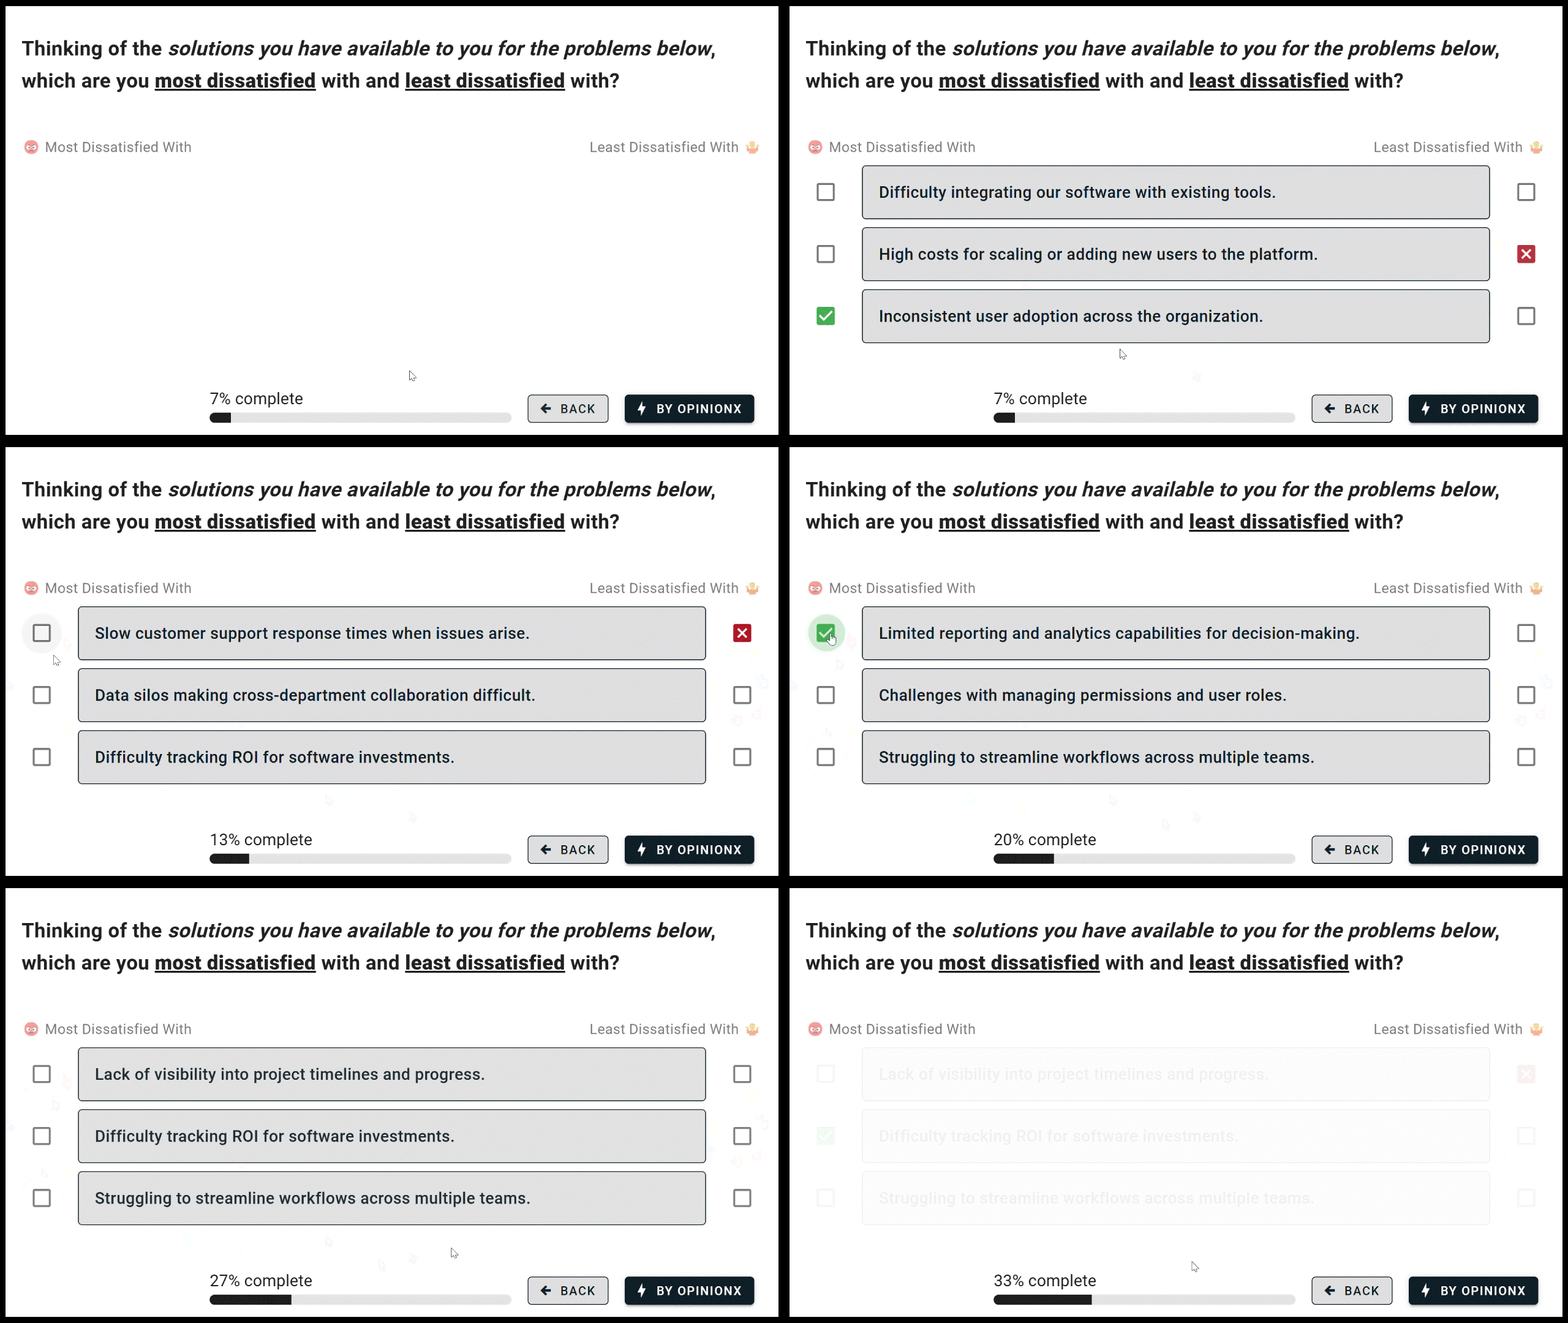
^ Example of a MaxDiff Analysis ranking survey for measuring dissatisfaction
MaxDiff analysis turns your list into voting sets where 3 to 6 options are shown and participants pick the best and worst in each.
Both beat rating scales for measuring relative importance. Everyone interprets the options the same way ("this one or that one" rather than "is this a 4 or a 5"). They handle much longer lists by showing each participant only a sample of the total, so you don't have to artificially shortlist on flawed assumptions. And comparison voting is much closer to how people decide in daily life, by weighing options and picking what matters most.
If the options you’re using for voting are concise and easy to understand, I would use MaxDiff Analysis as it allows you to gather more data faster by showing 3-6 options per voting set. For more complex or longer ranking options, I would use Pairwise Comparison. By only showing two options at a time, it is much easier for respondents to consider each vote more realistically.

You run two surveys, or two questions: one measuring importance, one measuring dissatisfaction with the current options. If the options are concise and easy to read, MaxDiff works well; for longer, more complex statements, pairwise comparison is the tidier choice. Our guide on how many votes a pairwise survey needs covers sample size.

How to analyse opportunity gap survey results
Pairwise comparison results run on a 0 to 100 scale, where 0 means the option won none of its pair votes (very low importance) and 100 means it won every one. OpinionX calculates this automatically after your survey.

Make a simple table in Google Sheets with the text options in column A and the scores from your importance and dissatisfaction results in columns B and C. Highlight it, choose Insert then Chart then Scatter Chart, and you'll get a scatterplot with importance on the x-axis and dissatisfaction on the y-axis.
For a tidier version, export the chart as a PNG in 16:9 with a transparent background (Chart Editor, Customize, Chart Style, Background Color, None) and recreate it in your slides.
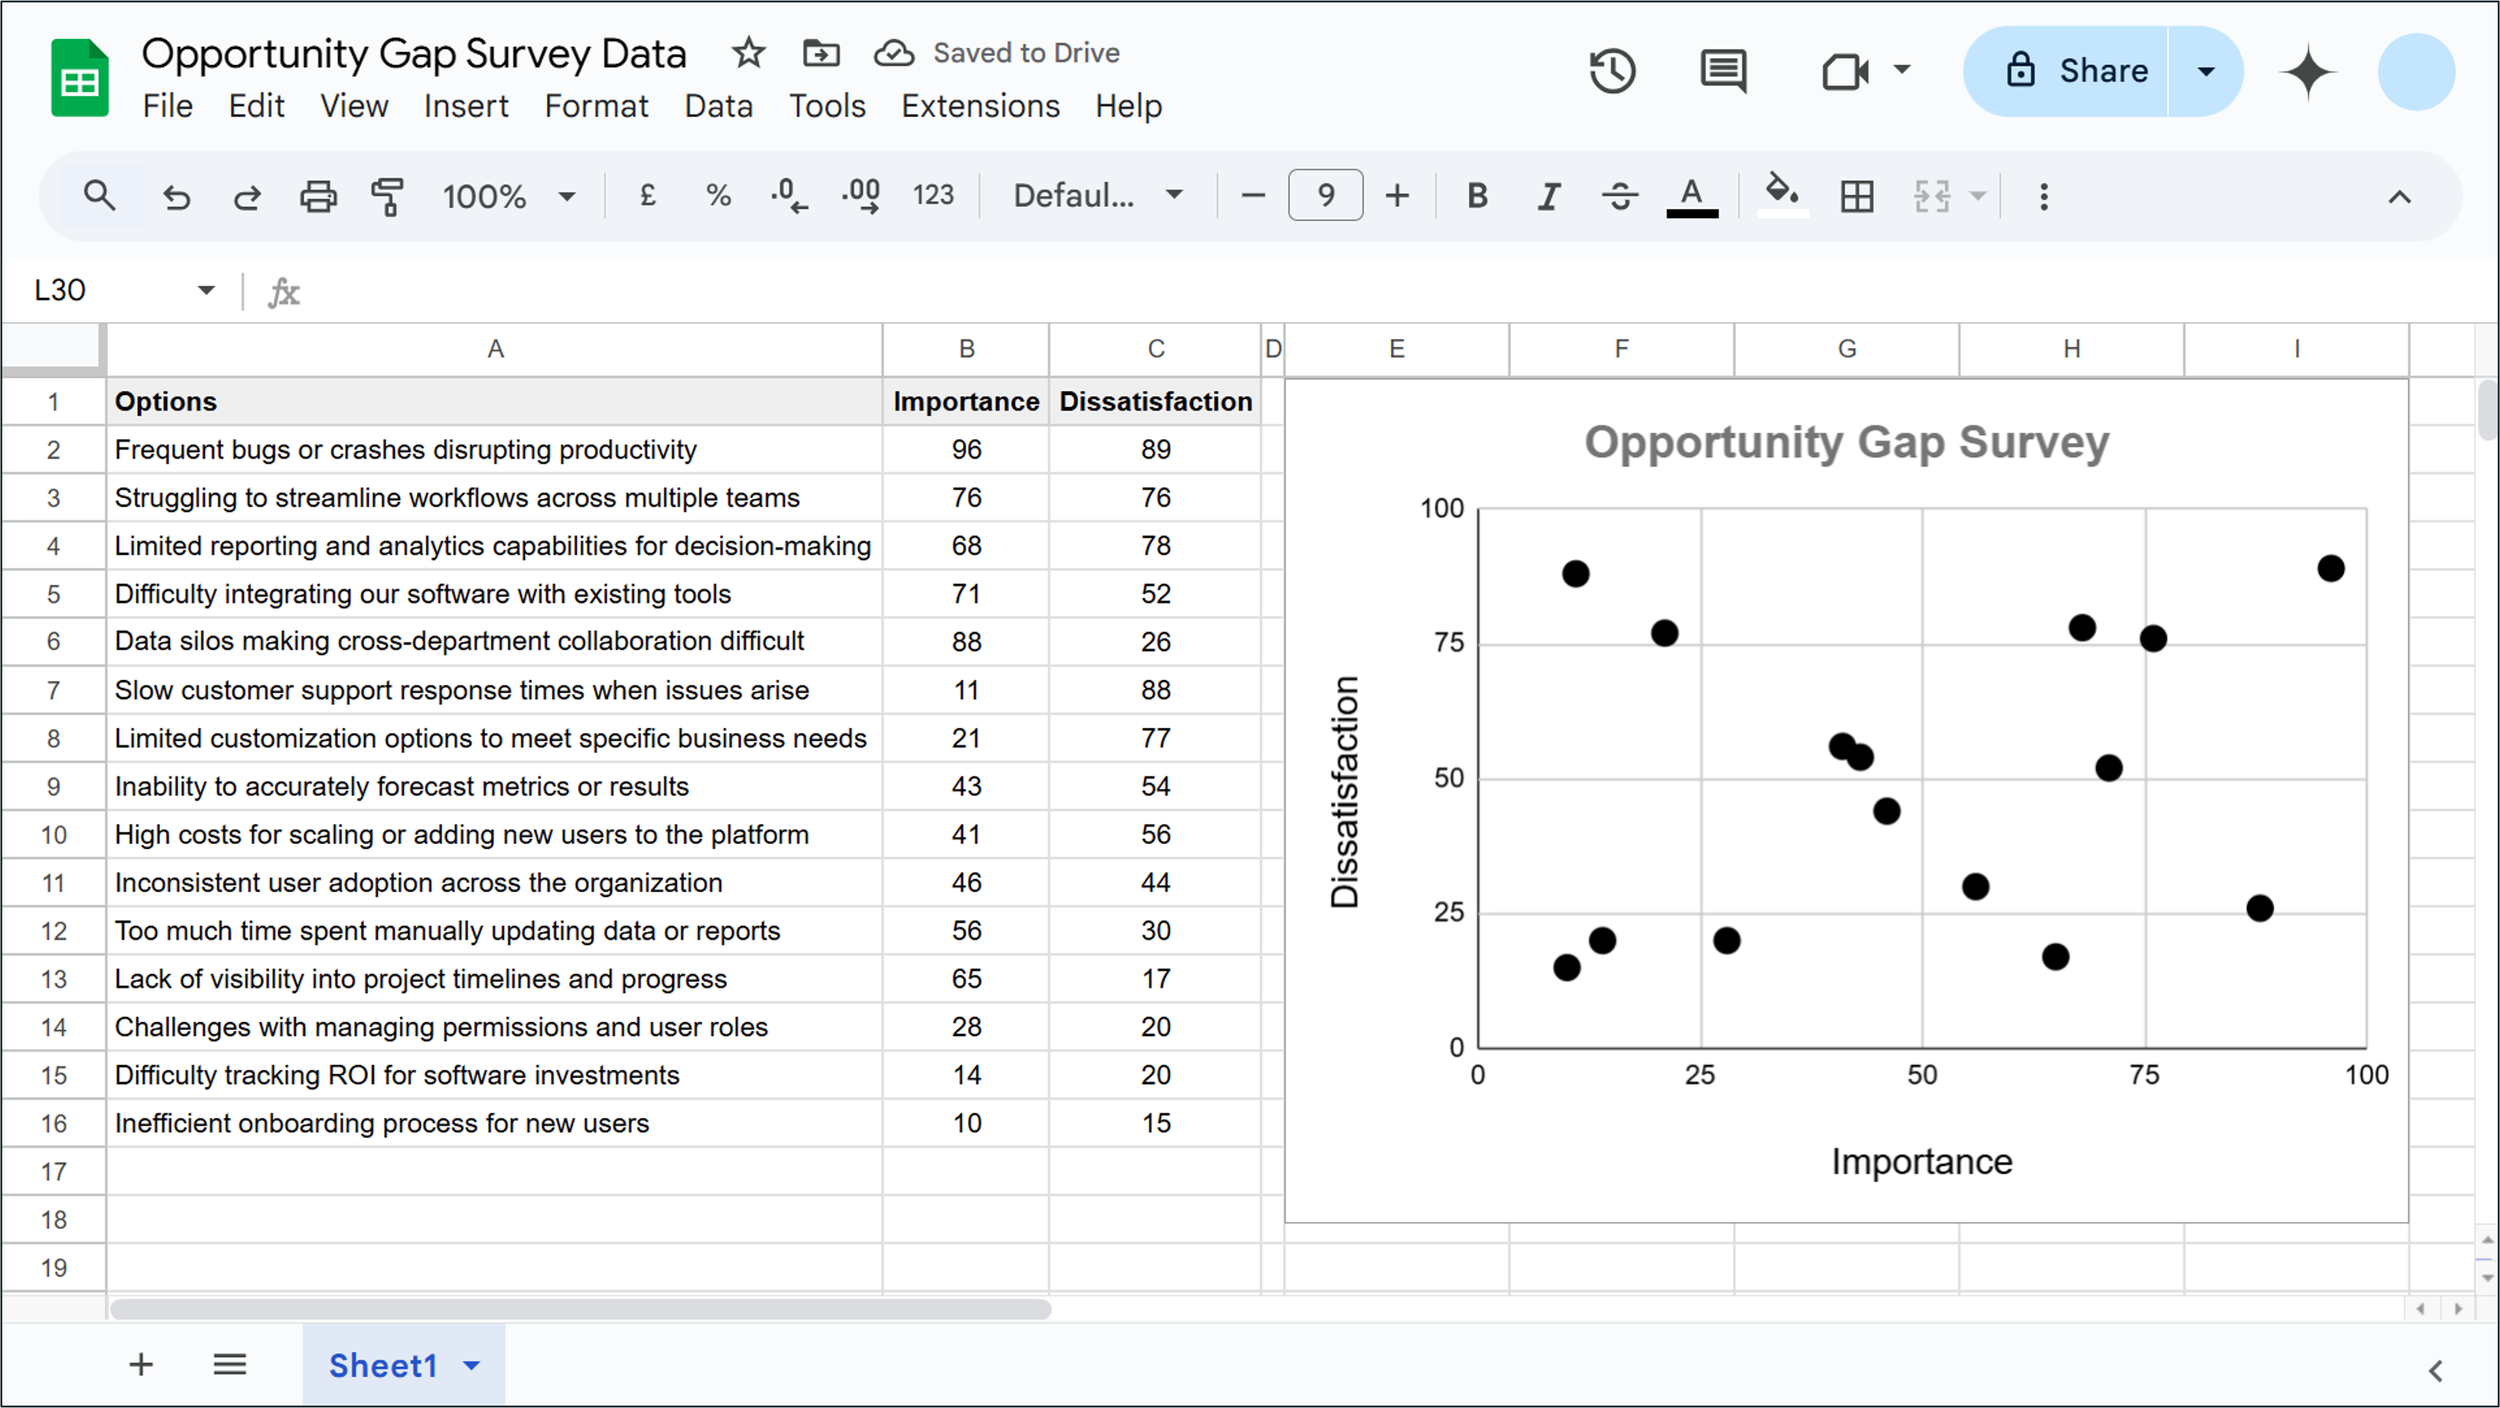
The graph helps you spot two types of opportunity:
Critical gaps to turn into core strengths: build better solutions that reduce customer dissatisfaction with the status quo.
Low priorities that are critical gaps to key customers: filter your results to find segments who say an otherwise low-priority problem is highly important to them.
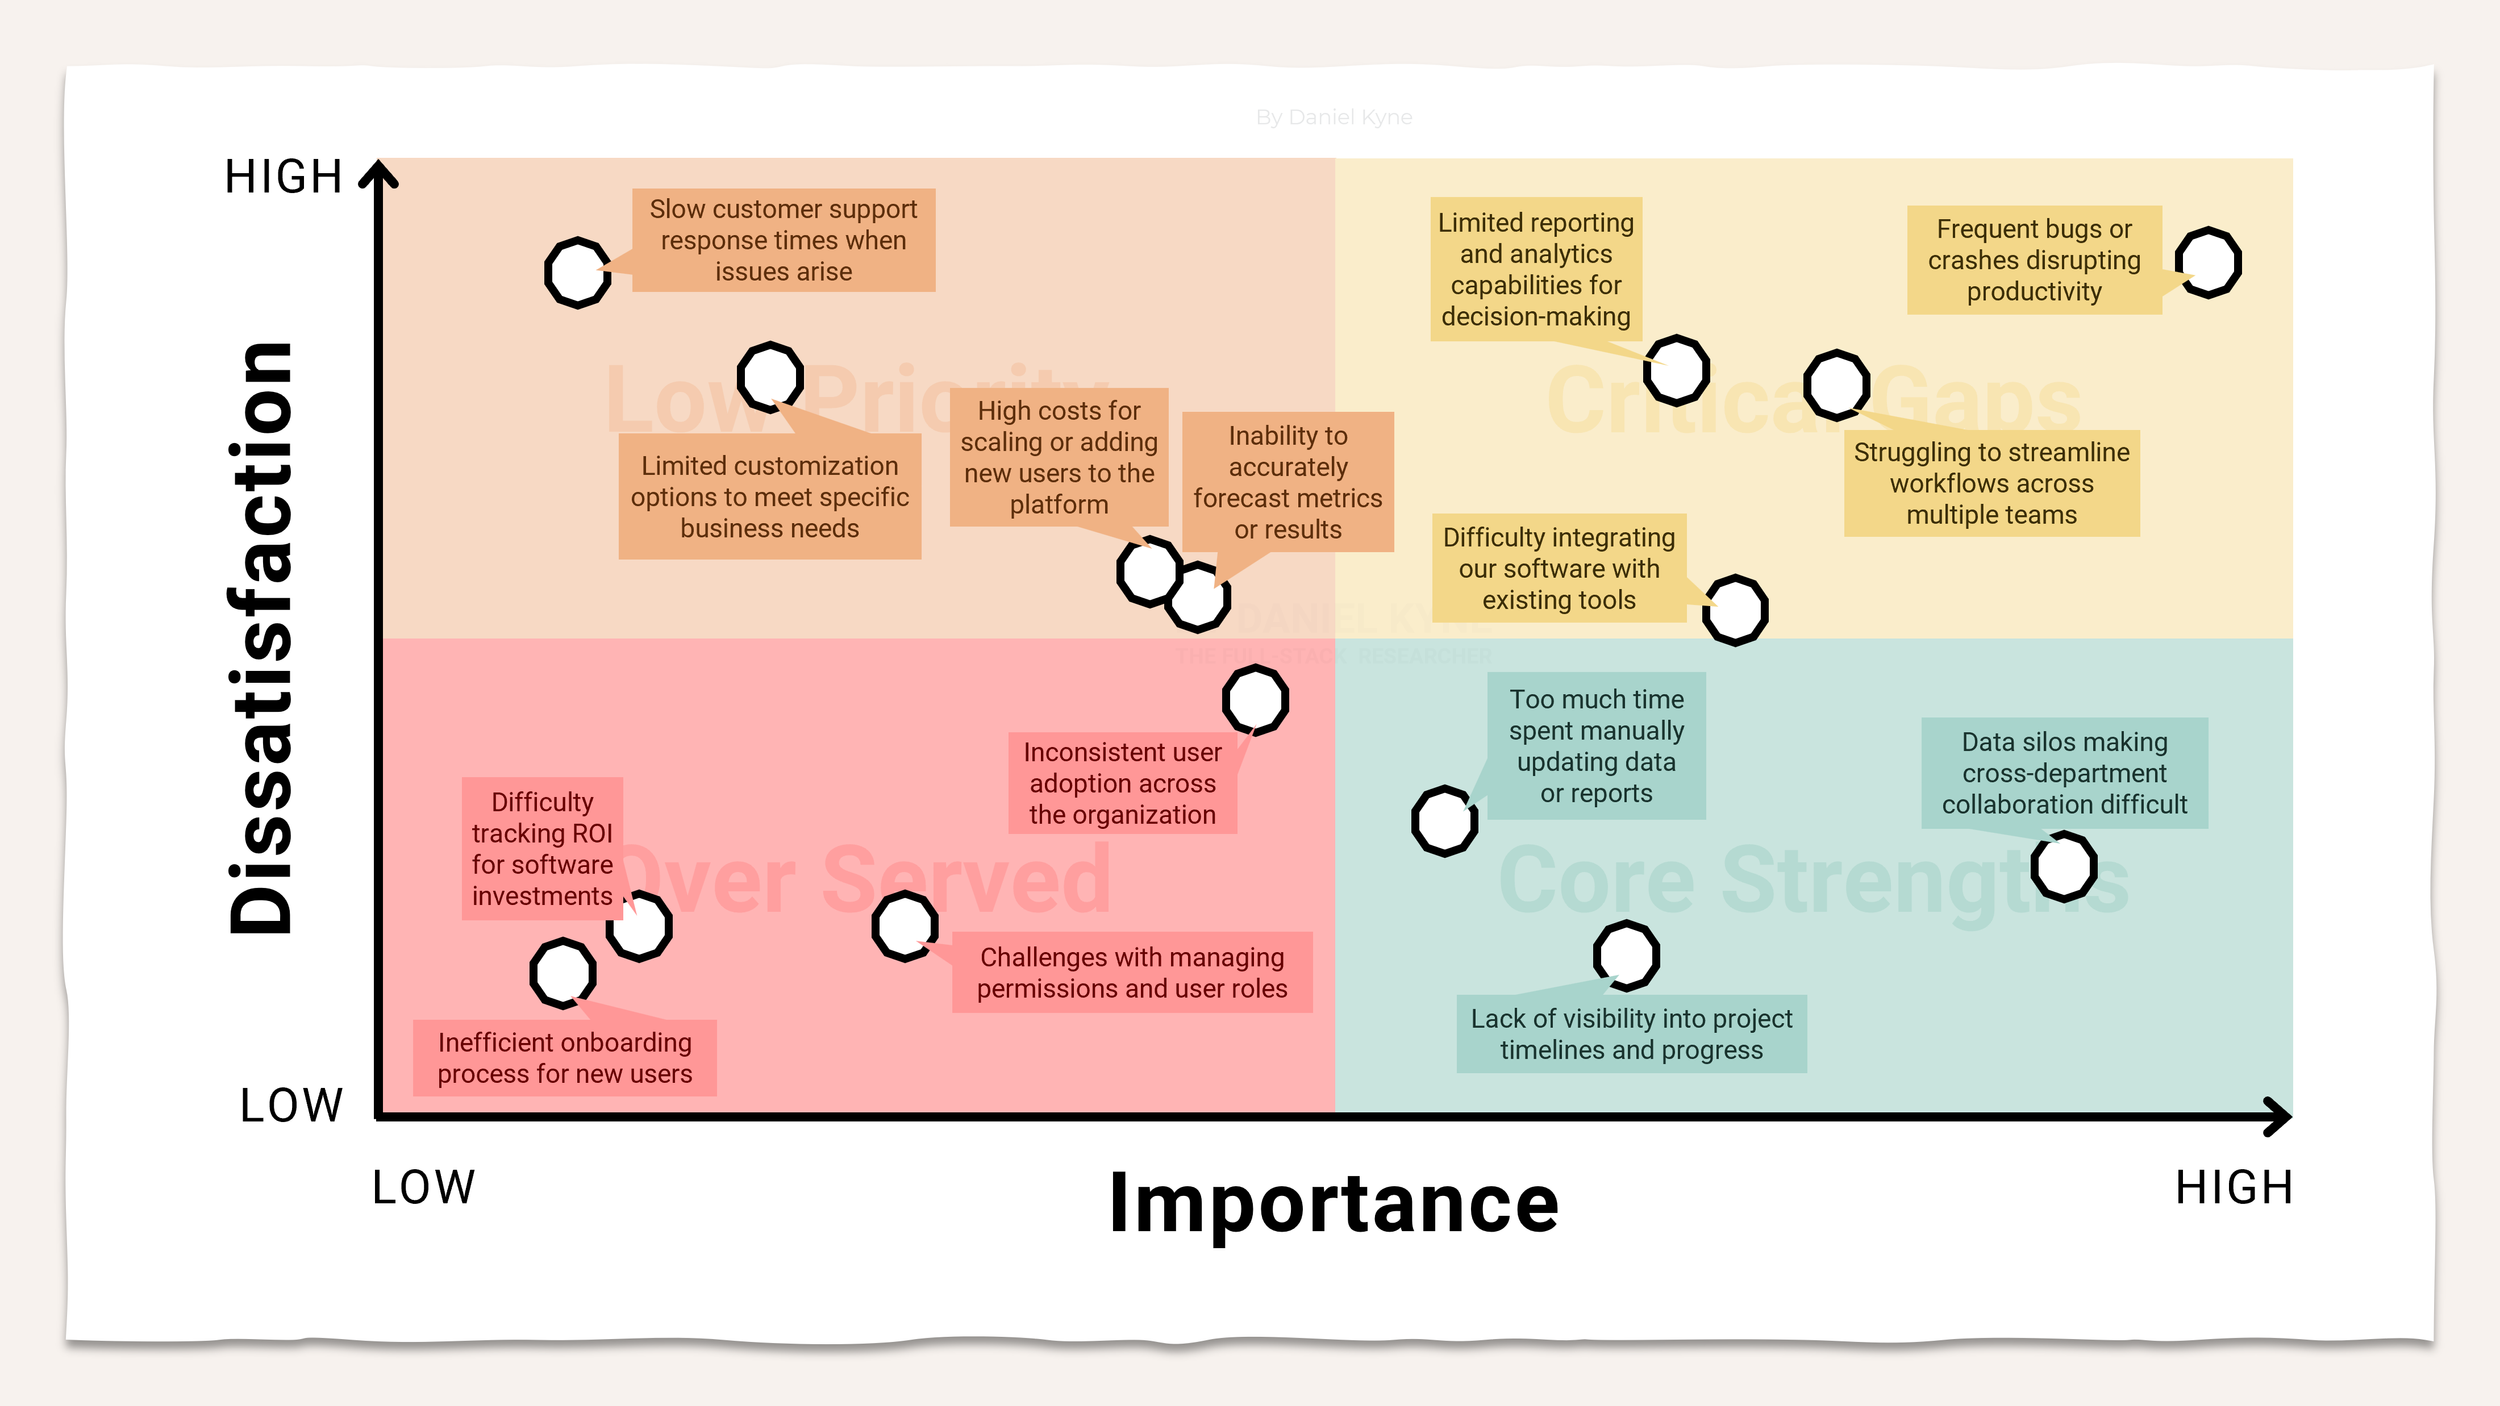

Using your opportunity gap results to inform product strategy
There are three techniques for acting on those two opportunity types.
A. Opportunity-solution trees
To move a problem in the critical-gaps corner (high importance, high dissatisfaction) into a core strength, you have to reduce dissatisfaction by building something better than what customers currently use. With a clearly identified problem like that, the opportunity-solution tree is the best approach for finding the right solution.

The opportunity-solution tree, created by Teresa Torres, is a structured way to brainstorm solutions in product management:
Outcome is the goal the team is working toward (increase retention, improve activation), though I sometimes reframe it as a customer-focused job they're trying to do.
Opportunity is typically a customer need, pain or desire; here, the problem statement categorised as a critical gap in your survey.
Solutions are the ways that problem could be addressed to make progress toward the parent outcome, each with experiments to de-risk it.

Opportunity-solution trees are a good mental model for mapping your options before jumping into solution mode, and for keeping the process anchored to the outcome you're after. It's a different tool from the Discovery Sandwich: the sandwich sequences your research, the tree structures your response to one prioritised problem.
B. Segmented crosstabs
What if your survey didn't surface many critical gaps? Some problems classed as low priority overall are probably highly important to particular subgroups.
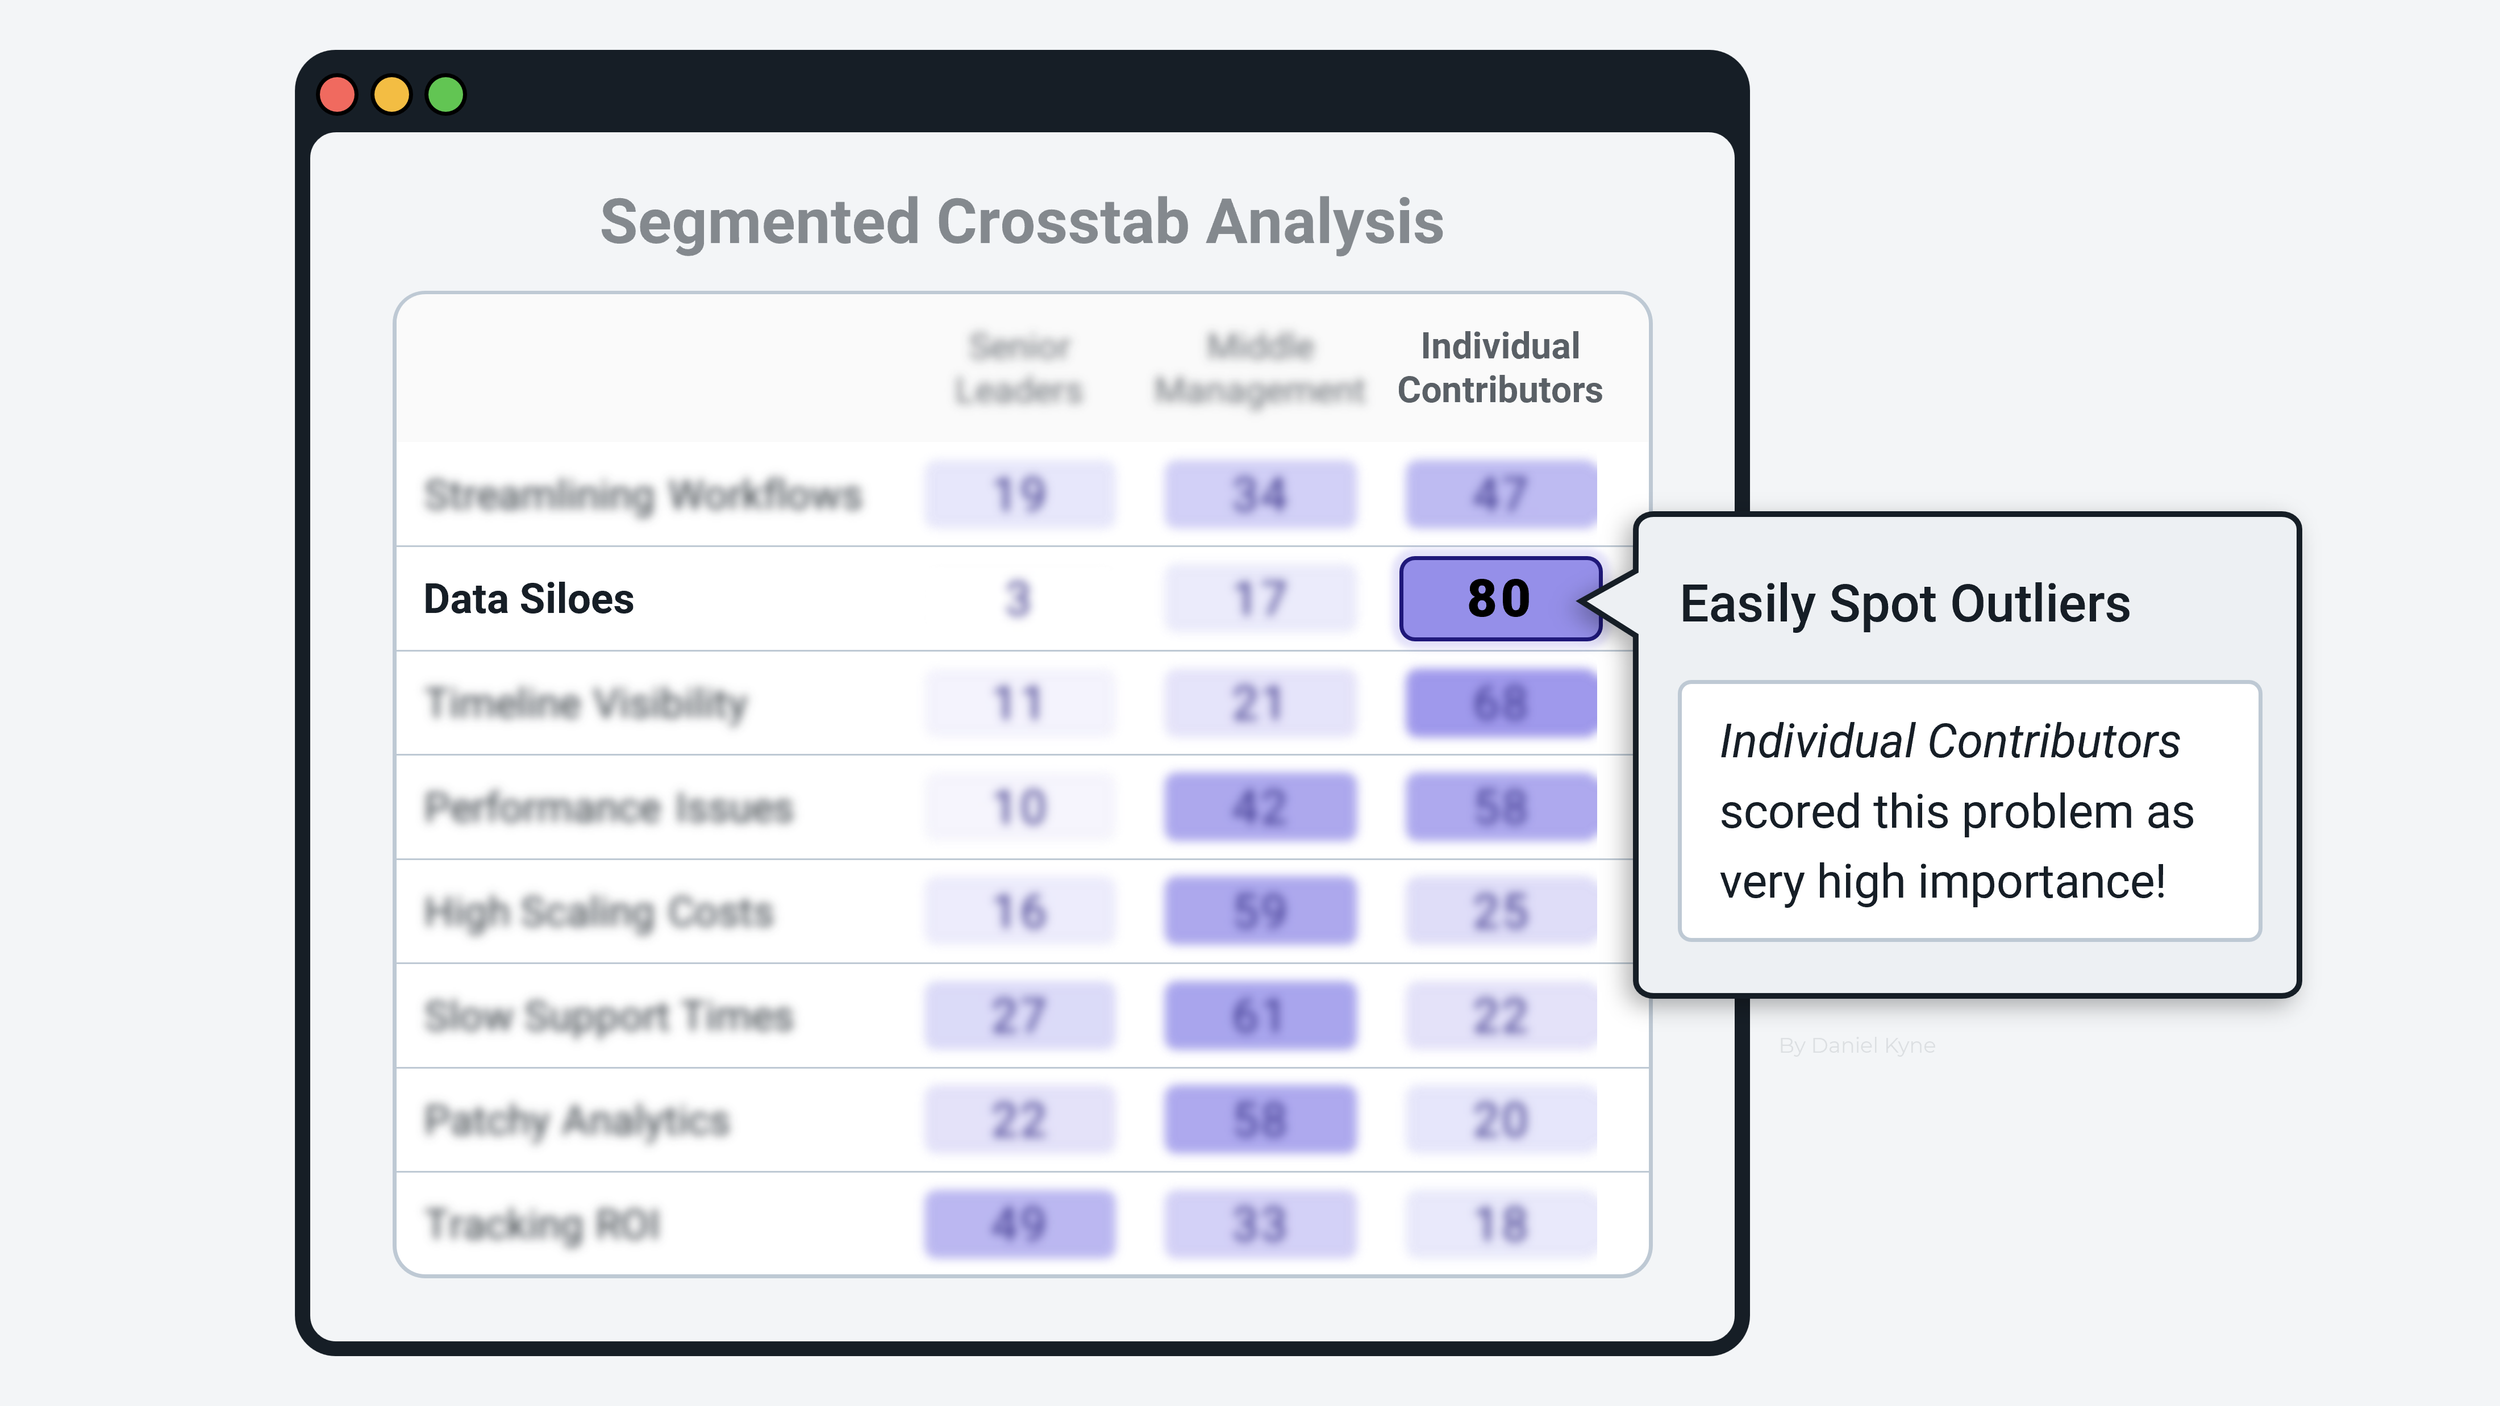
A segmented crosstab is a table where each row is one ranking option and each column is one customer segment, and each cell holds the score that segment gave that problem. OpinionX's Segments tab builds these automatically and colour-codes them so the highest importance and dissatisfaction scores stand out.
Start with the problems that have a high dissatisfaction score overall, find each on the crosstab, and look across the row for any segment that scored it much higher in importance than the average. Once you find one, use an opportunity-solution tree to plan how to move that problem to a core strength for that segment. This is the same needs-based segmentation logic applied to prioritisation.

C. In-depth interviews
The deep-dive end of the Discovery Sandwich. Once the survey has told you which problems matter most and to whom, interview those customers to understand the context: when the problem happens, how often, what they currently do about it, and why that falls short. OpinionX's Participants tab lets you filter to the people who scored a problem highly and invite them for a follow-up.

How to get started with your first opportunity gap survey
Everything in this guide can be done on OpinionX. Build your opportunity gap surveys to measure perceived importance and dissatisfaction using comparison-based methods like pairwise comparison and MaxDiff analysis.
Frequently asked questions
What is an opportunity gap survey? A prioritisation survey that measures how important each customer problem is and how dissatisfied customers are with the current options. Plotting importance against dissatisfaction shows which problems (the high-importance, high-dissatisfaction "critical gaps") are the biggest opportunities to solve.
How do you measure importance and dissatisfaction? With comparison-based ranking methods, not rating scales. Run a pairwise comparison or MaxDiff survey once for importance and once for dissatisfaction, which forces participants to compare options against each other and produces a cleaner ranking than 1-to-5 ratings.
Why not use a rating scale for an opportunity gap survey? Rating scales force you to shortlist the list beforehand, suffer from straightlining (everyone scoring everything the same), are interpreted differently by each person, and are tedious over 20-plus options. Comparison methods avoid all four problems.
What do you do with the results? Plot importance against dissatisfaction. Move critical gaps toward core strengths using an opportunity-solution tree, use segmented crosstabs to find problems that matter to specific segments, and run in-depth interviews on the top-ranked problems to understand their context.
What's the difference between an opportunity gap survey and an opportunity-solution tree? The survey is how you prioritise which problems to work on. The opportunity-solution tree (by Teresa Torres) is how you then generate and test solutions for a prioritised problem: survey first, tree second.
The whole point is to settle "what should we build next?" with customer data before the loudest opinion in the room wins. Rank the problems by importance and dissatisfaction, look for the critical gaps, then use an opportunity-solution tree to work out what to build and segmented crosstabs to find who needs it most.
Want more like this? Over 42,000 researchers and product people get The Full-Stack Researcher in their inbox. Subscribe for the next one.
Everything in this guide runs on OpinionX for free: $0, unlimited surveys, unlimited researcher seats, capped at 25 participants per survey, then $900 a year to lift the cap (full pricing). The importance-versus-dissatisfaction analysis and result segmentation are included.
About The Author:
Daniel Kyne is the Founder & CEO of OpinionX, a free research tool for measuring people’s priorities — used by tens of thousands of teams to better understand what matters most to their customers. OpinionX comes with specialized survey methods for measuring relative importance and satisfaction, making it perfect for projects like Opportunity Gap Surveys. Give OpinionX a try for free today!