
How to use PMF Surveys to reach Product/Market Fit Faster (Guide + Case Study)
"The only thing that matters is getting to product/market fit”
Product/Market Fit is the point when a startup begins to experience exponential growth in demand, ie. you’ve built something that a lot of people want. According to Marc Andreessen, who first popularized the term in 2007, all startups are either Pre-PMF or Post-PMF — you either have it or you don’t and it should be obvious which side you’re on.

While the idea of PMF caught on quickly, it remained a vague target for many years. Unsurprisingly, “getting to” something that can’t be measured is quite a challenge. But three years after Andreessen’s famous blog post, Seán Ellis changed that with a technique for measuring Product/Market Fit called the 40% rule.
Seán Ellis is a bestselling author and former growth leader at companies like Dropbox, Lookout, Eventbrite, and LogMeIn. In May 2010, he wrote a blog post explaining a simple indicator of PMF — ask your users “how would you feel if you could no longer use our product?” and measure the percentage who pick “very disappointed.” If over 40% of users say they would be “very disappointed”, then you’ve got PMF.
Ellis’ 40% rule has since turned into the well-known ‘Product/Market Fit Survey’, but many don’t realize that for over 8 years it was mostly ignored due to one major gap in Ellis’ thinking…
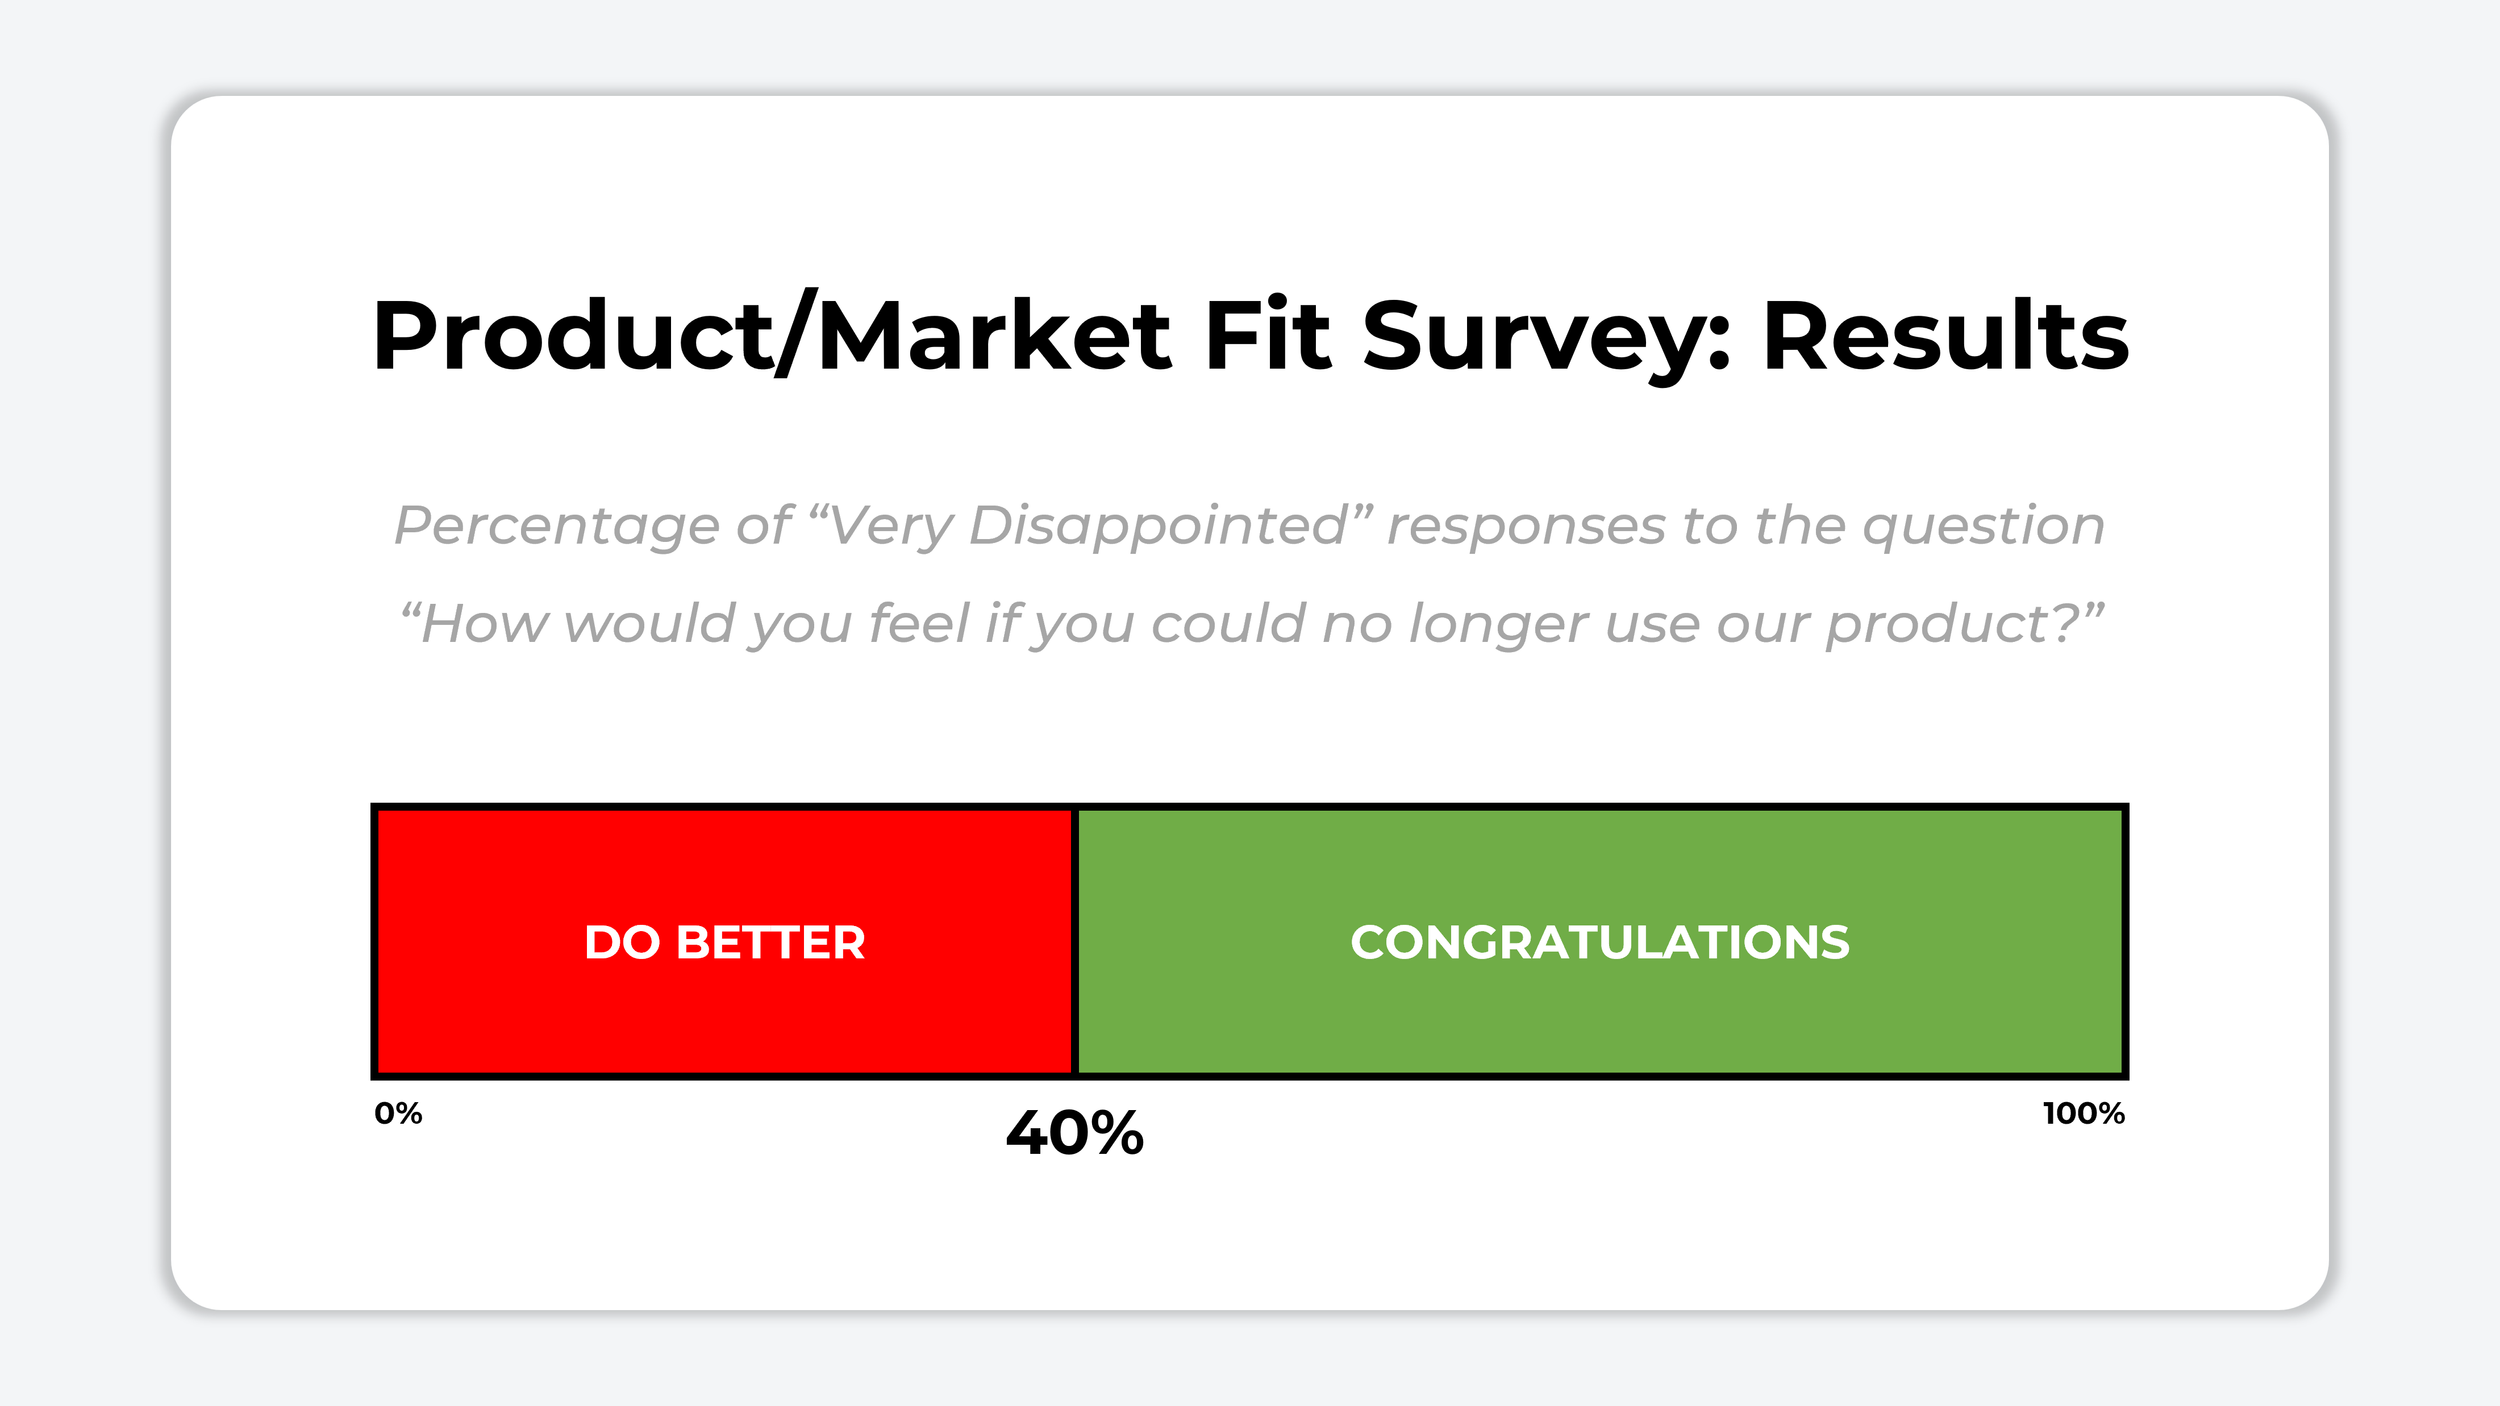
Ellis saw the result of the Product/Market Fit Survey as a binary outcome — congratulations if you scored above 40%, otherwise keep digging until you figure out how to make more of your ‘somewhat disappointed’ respondents see your product as a “must-have” instead of a “nice-to-have”.
But almost every early-stage team hustling to get to PMF is already trying to make their product a “must-have”. They’re constantly talking to users, iterating their messaging, releasing new features, testing their assumptions, and so on. Ellis’ 40% rule didn’t give these teams a better direction to pursue than any other research framework — it usually told them to “do better”.
At least that was the case until November 2018, when the founders of Superhuman added one key twist to Ellis’ 40% rule and caused the Product/Market Fit Survey to finally go viral — segmentation.
The first time Superhuman’s co-founders ran a PMF Survey in early 2017, only 22% of their users were in the “very disappointed” group. While that initially looks like failing the 40% rule, they understood that 22% was just an average score and that there must be some subgroup of users with a much higher disappointment score than that.
The first thing they did was manually tag users’ job titles, such as Engineers, Marketers, Salespeople, etc. When they looked at all these groups, they found the users with the highest overall disappointment score were founders, managers, executives, and people working in business development. When they put all these respondents together and ignored everyone else, their “very disappointed” score jumped from 22% to 32%.

This completely changed how they thought about their survey results. They focused only on relevant users with these job titles and split them into two key groups — users who felt the product was a ”must-have” (the “very disappointed” group) and users who saw it only as a “nice-to-have” (the “somewhat disappointed” group). Segmenting in this way allowed them to answer some big questions like…
1. Why does the “Very Disappointed” cohort like Superhuman so much?
They isolated the “Very Disappointed” respondents and analyzed their answers to the question “What is the main benefit you receive from Superhuman?”. They found that the most common responses were focused on benefits like speed, focus, and keyboard shortcuts.
2. Do “Somewhat Disappointed” users care about these benefits too?
They looked at the 45% of “Somewhat Disappointed” respondents and analyzed their answers to the same “main benefit” question. They found that two-thirds mentioned speed, focus, or keyboard shortcuts as their primary benefit, while one-third prioritized other unrelated things.
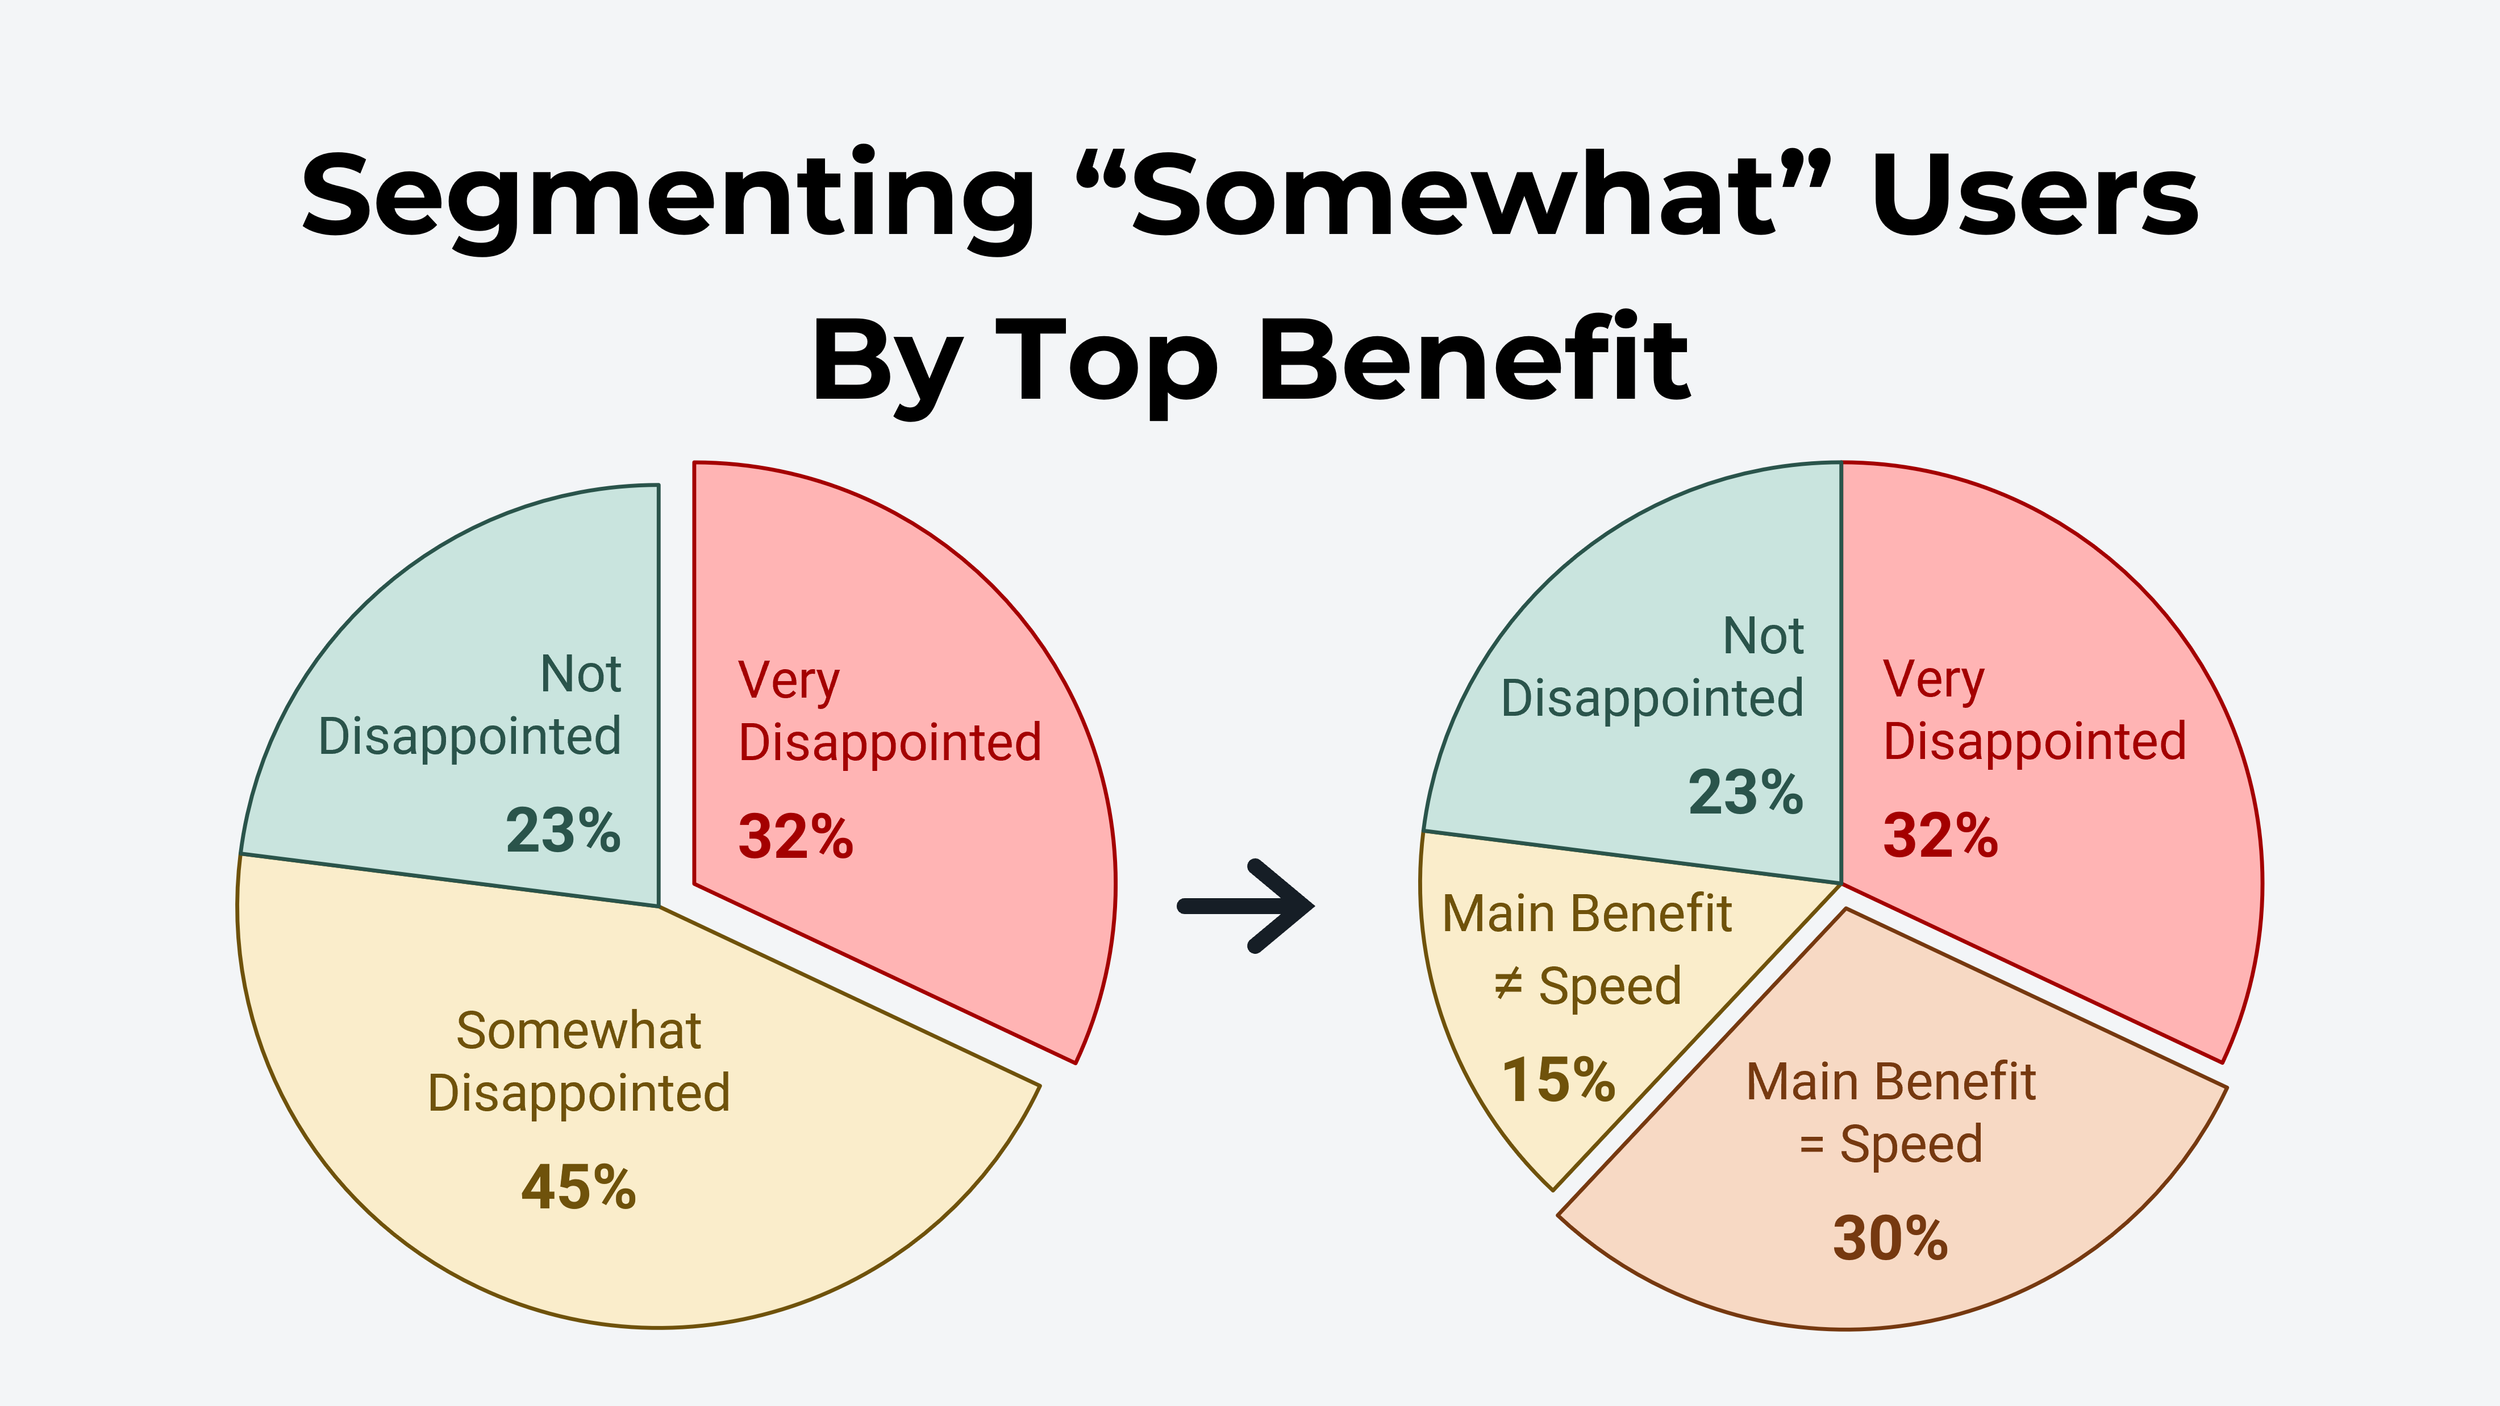
3. What is stopping the speed-focused “Somewhat Disappointed” users?
What were the top complaints about Superhuman according to the speed-focused “Somewhat Disappointed” users? By segmenting the data again to focus only on this subset of respondents, they found that the highest-priority problems included the lack of a mobile app, missing integrations, attachment handling issues, and some other low-hanging fruit.
Next Step: Roadmap
The results of this survey gave the Superhuman team two clear priorities:
Double down on the benefits that the “Very Disappointed” users love most (faster speeds, more shortcuts, extra automation).
Solve the highest-priority problems according to “Somewhat Disappointed” users (mobile app, integrations, attachment and calendar features, better search, read receipts).
Superhuman repeated this process at the end of each subsequent quarter and tracked their segmented-PMF score as it rapidly improved:
32% in Q4 2017
47% in Q1 2018
56% in Q2 2018
58% in Q3 2018
What to learn from the Segmented-PMF Survey?
The purpose of the PMF Survey was misunderstood for almost 9 years. Rather than simply benchmark your current level of Product/Market Fit, the “disappointment” data is better used as a filtering lens to understand how your users interpret things like:
Product Benefits
Feature Value
Usability Issues
Customer Problems
Superhuman’s story raises two challenges for us:
What’s the best way to survey users about things like feature value or customer problems?
How do I segment my PMF Survey results in a similar way to how the Superhuman team did?
Step 1. Measuring Customer Preferences/Priorities
Like in Superhuman’s story, we should collect both positive and negative information from our users during the PMF Survey. This will help us better understand the “very disappointed” segment as well as the issues limiting the “somewhat disappointed” users. In a previous blog post, I introduced the Product/Market Fit Matrix, which helps visualize the different perspectives we use to frame research like this:

Outcomes & Benefits → How is the customer’s life better as a result of using your product?
Customer Pain Points → What needs, pains or desires is the customer trying to solve in their life?
Feature Value → Which features drive the most value and deliver the most benefit for the customer?
Usability Issues → What is it about your product that limits customers’ ability to gain value/benefits?
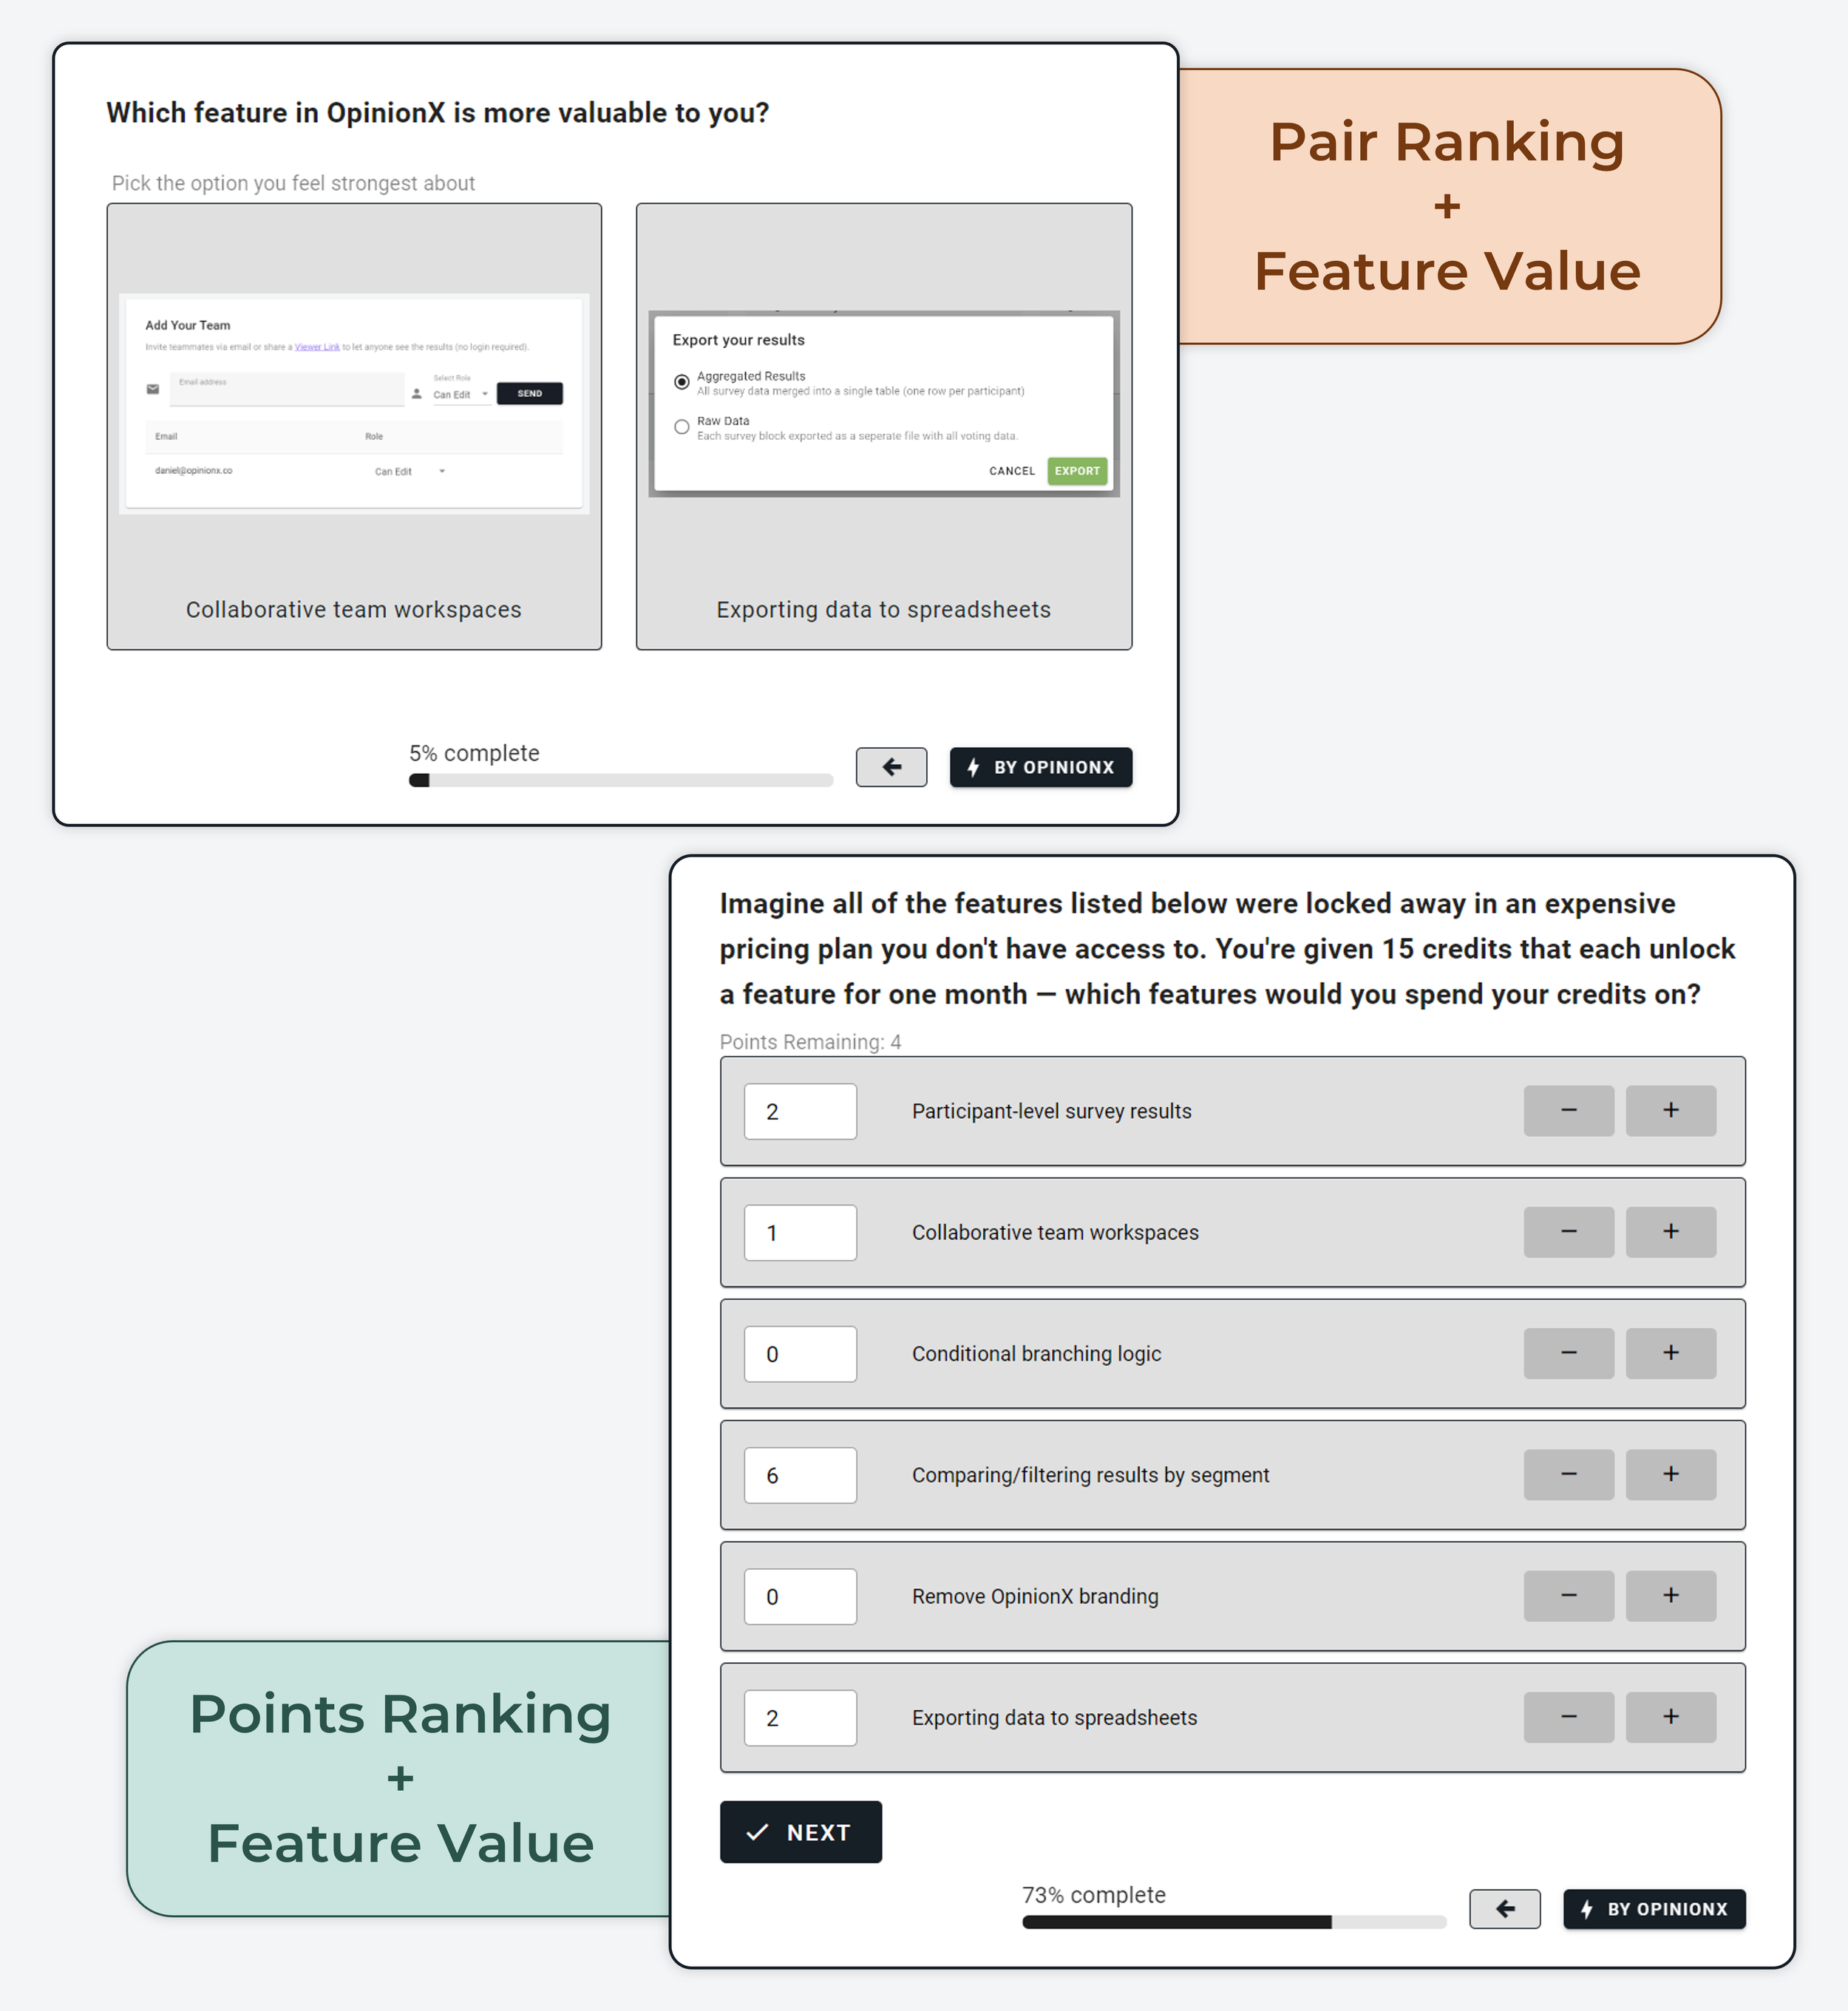
Whichever of those four you pick, I tend to use a two-part question to gather the right data. The first part is a comparative-ranking exercise, which forces users to compare options and vote for the ones that are most important/urgent to them. After the ranking, I include a text-response question to ask for options they care about that they didn’t see during the voting, allowing me to plug any gaps in my list mid-survey.
My favorite comparative-ranking methods for surveys like this are pairwise comparison (turns your list into a series of head-to-head “pair votes”) and points allocation (each respondent spends 10 credits on a list of options according to their personal preferences). Here are two real examples from a recent survey where we measured “feature importance” according to OpinionX customers:
Step 2. Segmenting By Disappointment Group
Comparative-ranking formats produce scores for each option from 0-100 based on how often they are chosen by respondents, making it very easy for us to rank and segment this data.
To make segmentation as easy as possible, I use a multiple-choice question to collect the “very/somewhat/not disappointed” data. I also tend to include other multiple-choice questions like pricing plan, organization type, and job title/function, which are ideal ways to segment the results later on too.
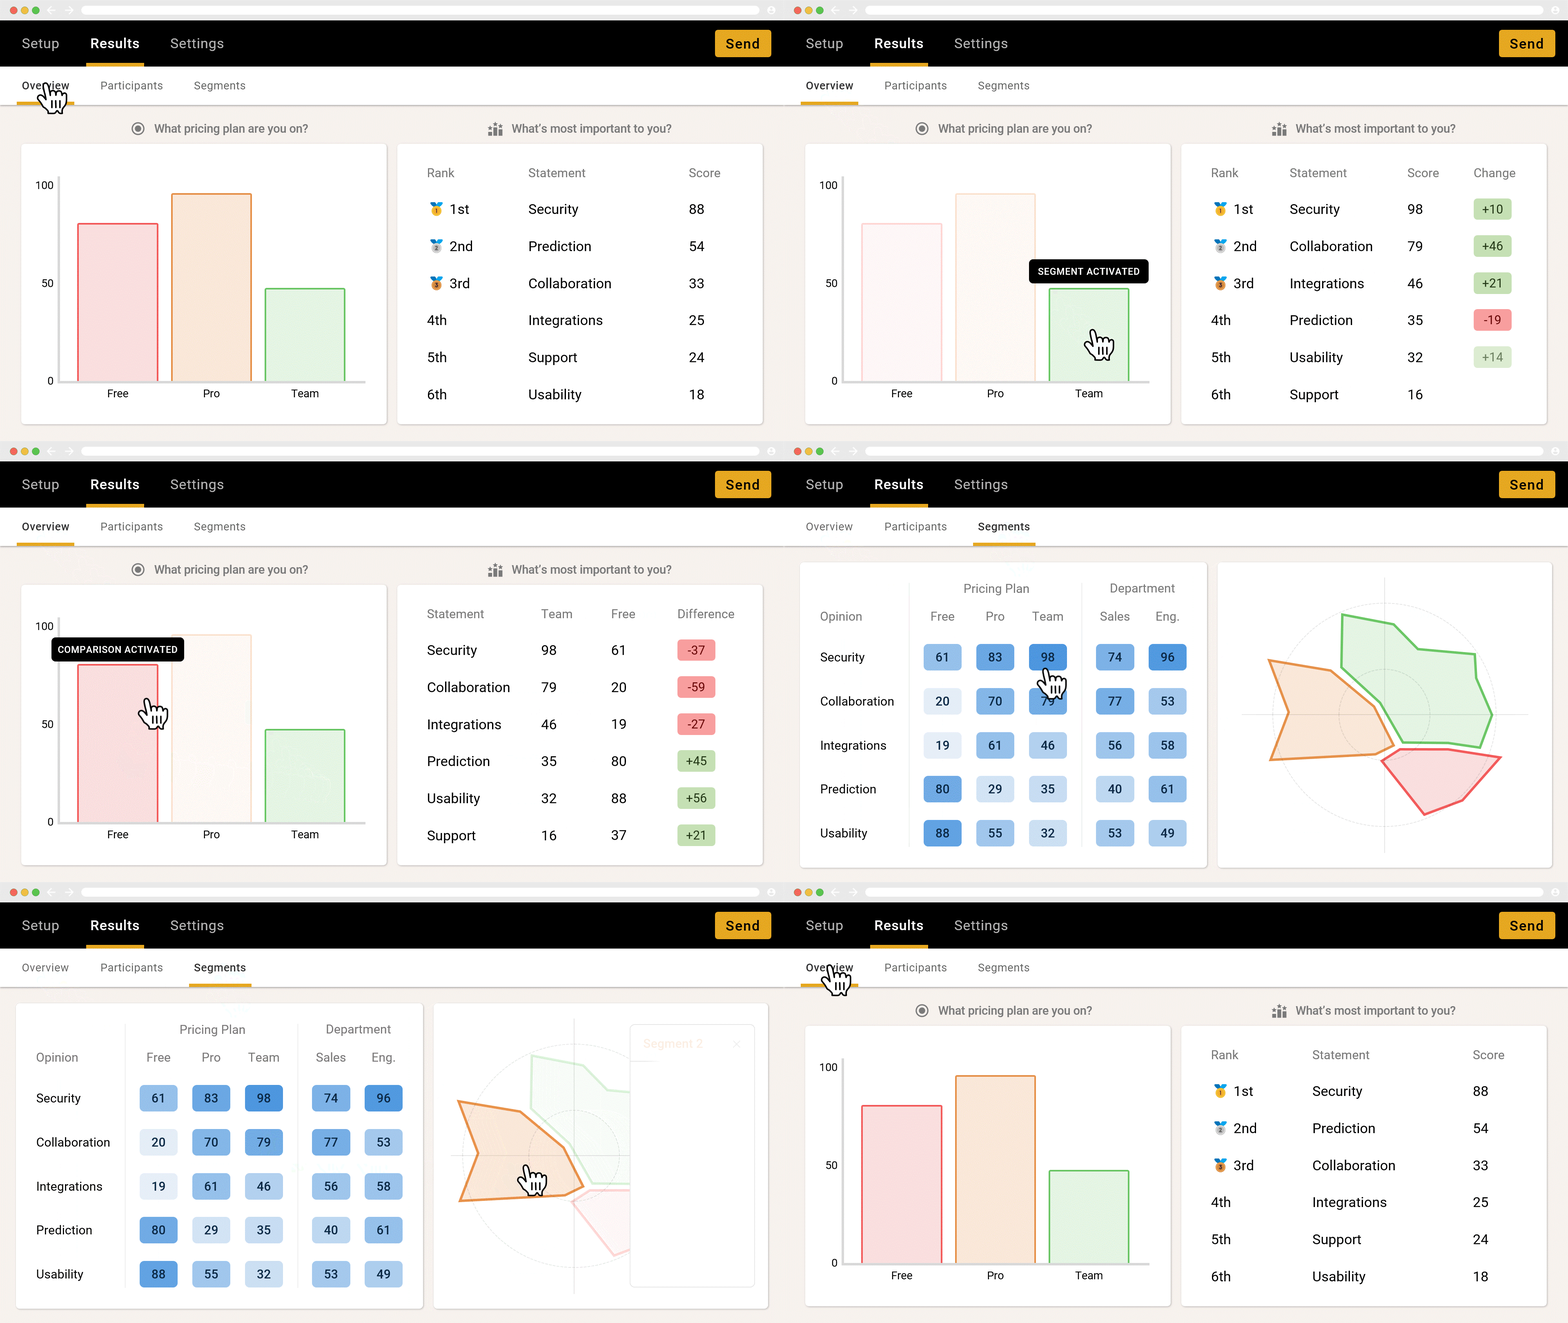
While you can manually create segments in Excel like the Superhuman team, a “Segmentation Matrix” gets the job done 10x quicker. It’s like a combination of a crosstab analysis and a heatmap table that shows each segment as a column and each ranking option as a row, with color coding to help you quickly spot the strong opinions. Here’s an example:
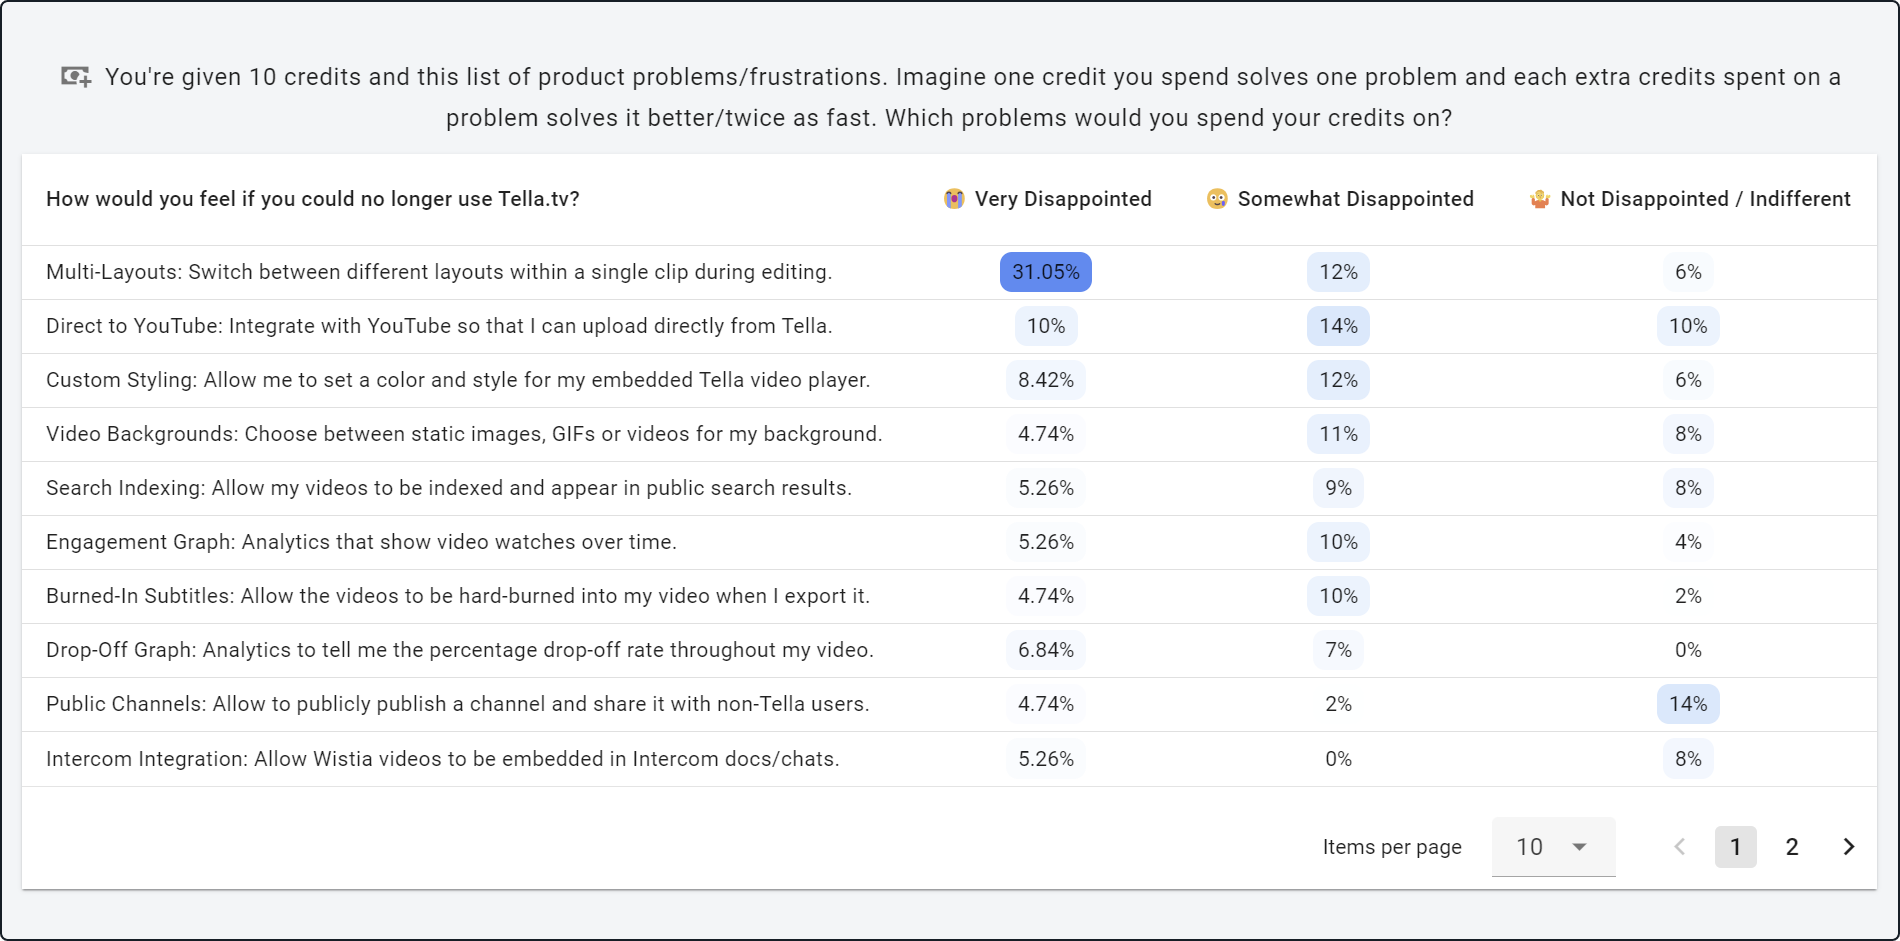
^ You can play around with the Segmentation Matrix from this screenshot here (no login required)
In the above example, we can see a points ranking question where participants were asked to allocate 10 credits to the features they would most like to see built next. The “Very Disappointed” users very clearly want the ‘Multi-Layouts’ feature, whereas “Somewhat / Not Disappointed” segments have spread their votes more inconsistently across many options — just one example of how PMF Surveys can offer actionable data for roadmap prioritization.
There’s no complex setup required to create a Segmentation Matrix like this. On OpinionX, the ‘Segments Tab’ populates itself automatically with this data and you can configure segments shown on the table in just a couple clicks. See for yourself — here’s a no-login-required link to the Segmentation Matrix from the screenshot above.
A Segmentation Matrix can help you answer the three questions from Superhuman’s case study:
Which segment has the highest percentage of “Very Disappointed” respondents?
What are the top benefits according to those segmented “Very Disappointed” respondents?
What are the barriers preventing suitable “Somewhat Disappointed” users from getting value?
You don’t need to be a data scientist to do this kind of analysis, as long as you pick the right tool. OpinionX is a free survey tool that comes with a suite of segmentation analysis tools for filtering, comparing, and mapping segmentation data in ways that any non-technical person can easily understand.
PMF Surveys are not the only culprit
So many teams get caught up in benchmarking and lose sight of the value that surveys could offer if done correctly. The same segmentation principle for the PMF survey applies to NPS, CES, and CSAT surveys too — they would all be much more useful if treated as segmentation datapoints for understanding customer segment differences rather than just benchmarks:
NPS (Net Promotor Score) → “How likely is it that you would recommend us to a friend/colleague?” → points rank exercise using expected product benefit statements to identify why your most engaged customers love your product.
CES (Customer Experience Score) → “On a scale of ‘very easy’ to ‘very difficult’, how easy was it to use our product?” → image-based pair ranking exercise using feature value statements to see which features are specifically most difficult to use.
CSAT (Customer Satisfaction Score) → “How satisfied are you with our product?” → pair rank exercise with product usability problem statements to identify barriers to adoption for low-satisfaction customers.
Average results from a wide base of users are not insightful for creating product strategy. To improve adoption and activation, segmentation tells us what our best customers have discovered and what barriers are blocking our churning users. To improve conversion and monetization, we need to know the value that new customers believe the product will offer. We can’t figure this out unless we have ways to sort users into segments.
Instead of pulling your hair out trying to learn how to do all this in Excel, choose OpinionX instead — over 12,000 teams use OpinionX to measure their customers’ preferences and priorities, and it comes with purpose-built segmentation analysis features. Create your own Product/Market Fit segmentation surveys with a free OpinionX account today.
PS. My favorite piece of trivia discovered while researching this post was that, in July 2010, a guy called Max Marmer pointed out to Seán Ellis that his 40% rule was missing segmentation:
“I'd consider adding something to the "if you are below 40%" paragraph about how ideally you want the 40% to be from a sampling of all your users, but segmenting the survey may lead to insights about how different segments value your product, and which segments you might want to focus more of your customer development, and engineering energy on to get to Product/Market fit (ie. 40%).”
Max understood that the “disappointment” data was better used to segment customers rather than just benchmark current PMF. He was seven years ahead of the team at Superhuman making the same realization in late 2017 — it’s funny how sometimes a good idea can take quite a while to catch on :)