
The Product/Market Fit Matrix [Data-Driven Iteration]
"Do whatever is required to get to product/market fit” — Marc Andreessen, 2007
In the gap between finding traction and PMF, this quote is about the most descriptive advice you’re going to get. Just go build a product that people really want.
That’s frustratingly vague for a founder like me living in this gap right now, so I set out to find something more useful. Rather than blindly fumbling around in the dark, hoping that something I do will eventually trigger this elusive product/market fit, I wanted a visual framework to focus my efforts on what would actually take us one step closer to PMF every single week.
Here’s what I’ve been using for the past few months:
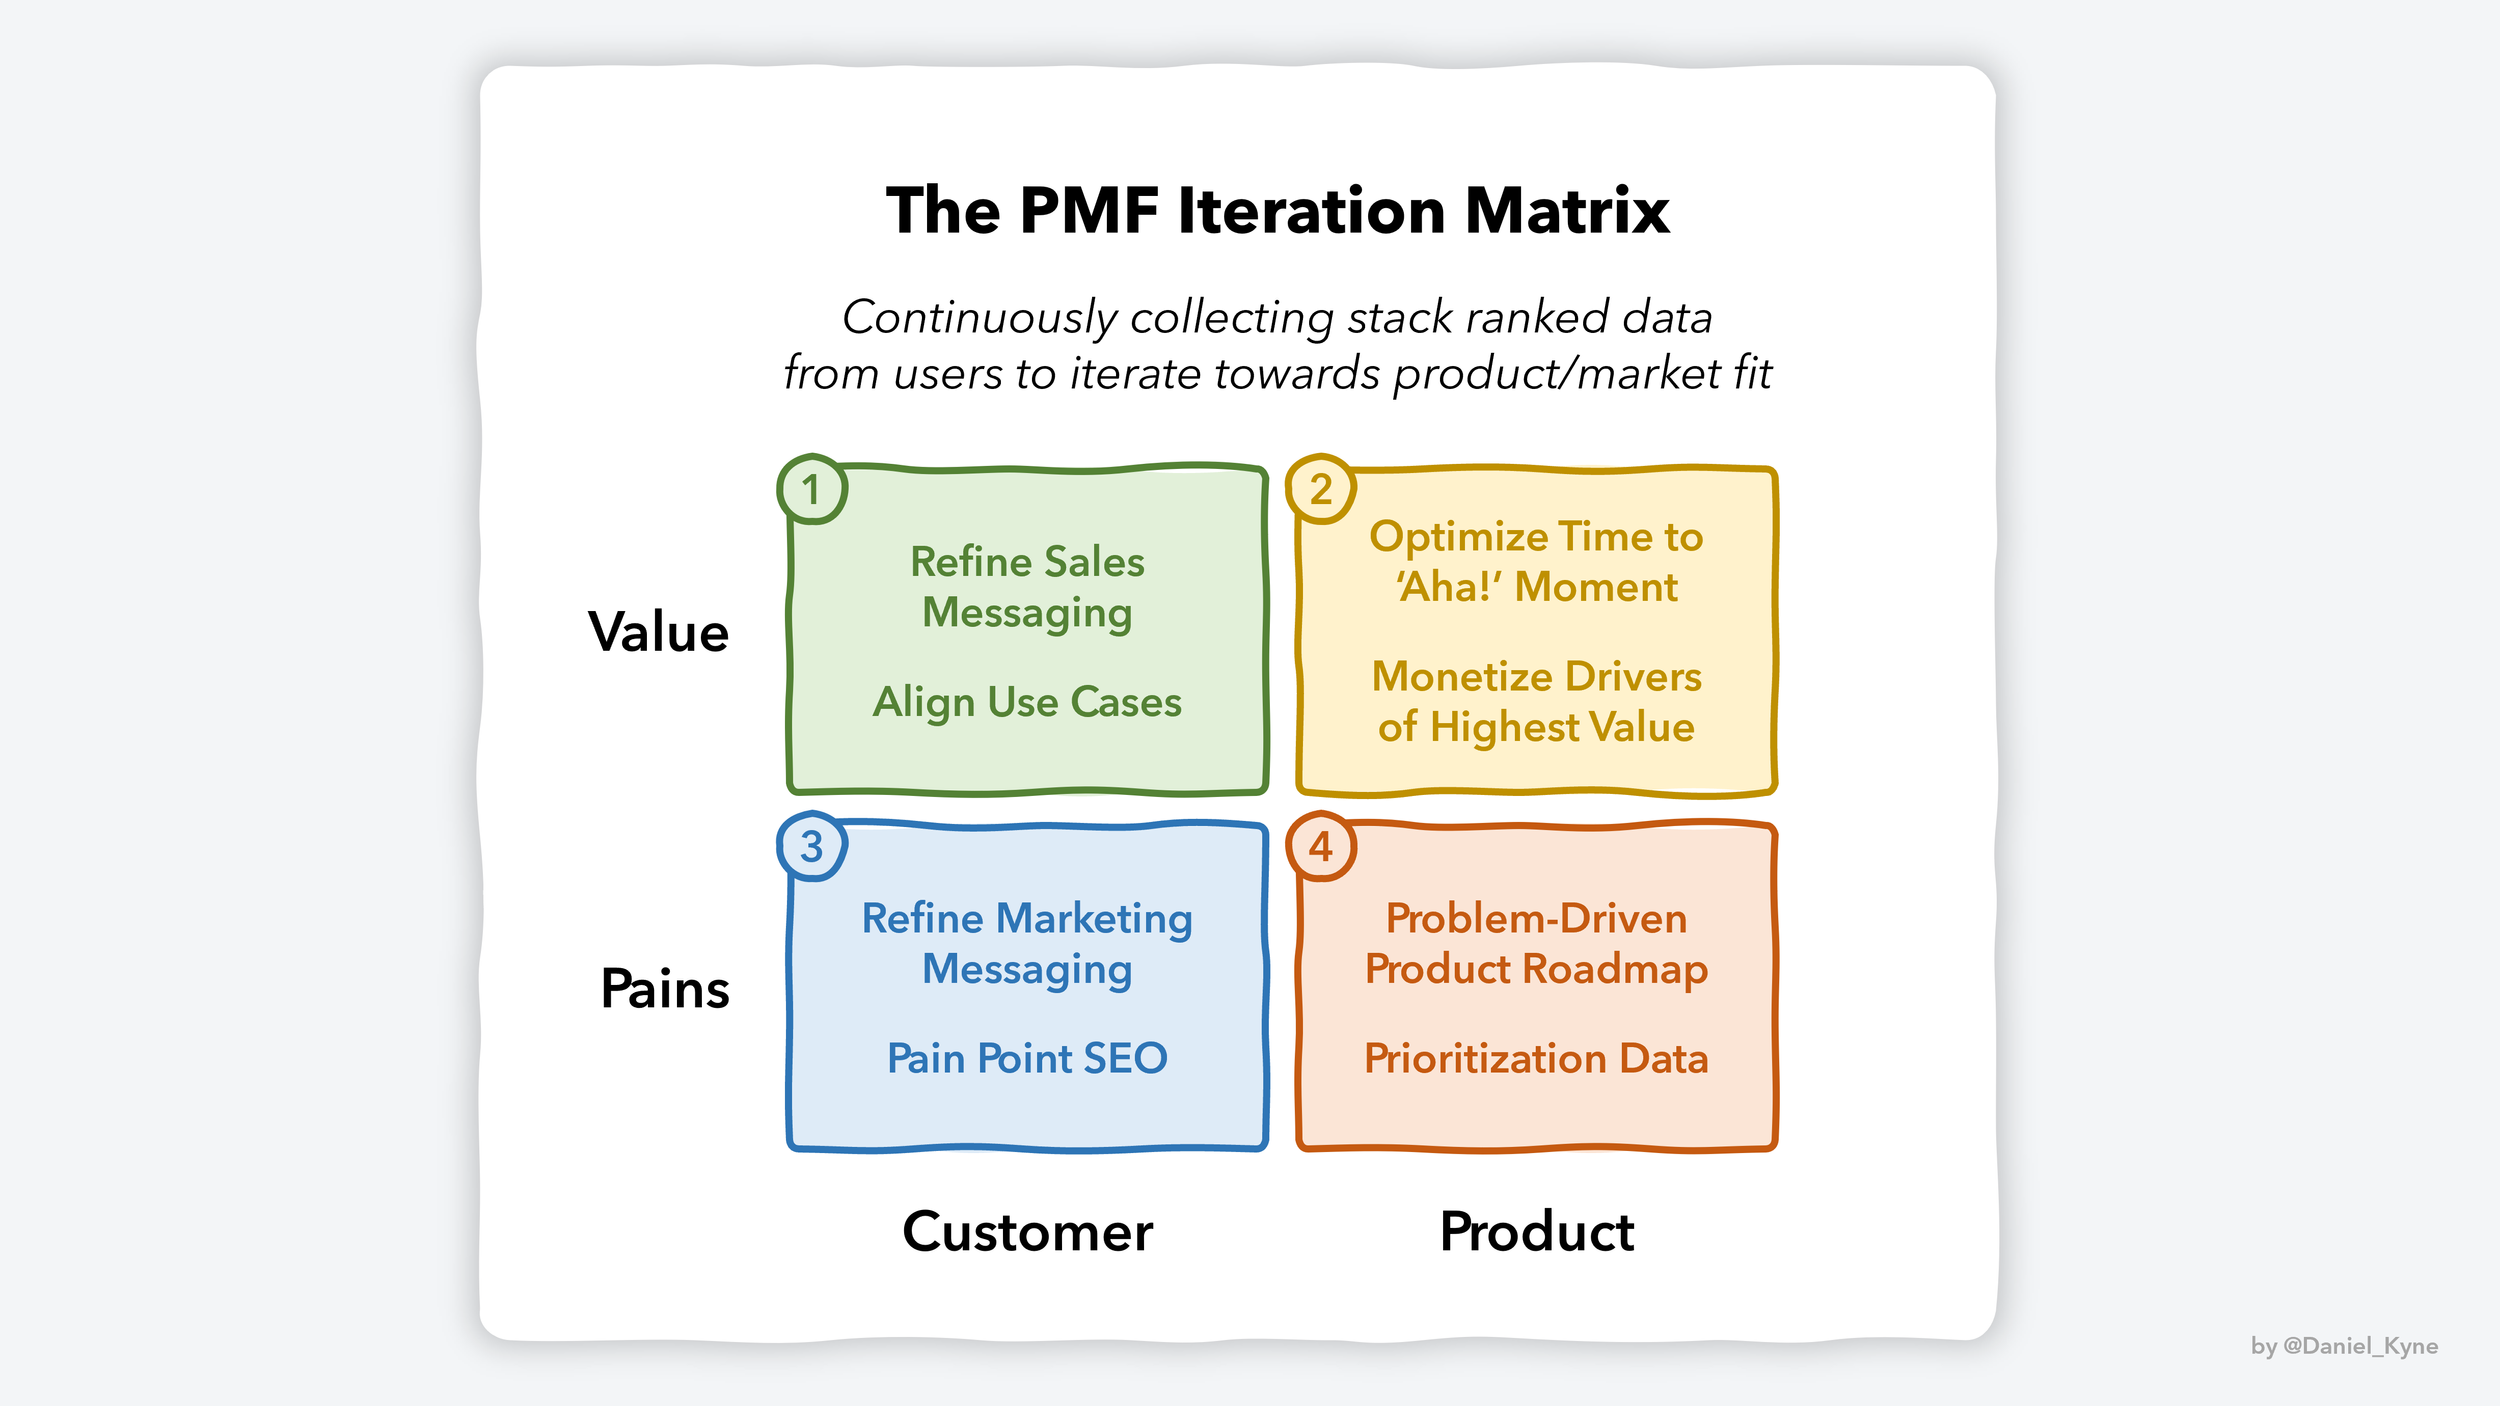
The PMF Iteration Matrix gives me two main things to focus on — Value and Pains — and two perspectives to consider them from — Customer and Product. I use customer stack ranking surveys to turn value/pain statements for each quadrant into a ranked list to prioritize what our team should focus on. In my opinion, it’s the perfect blend of rich qualitative insights grouped by area of effort and ranked with real data. Here’s the breakdown:
1. Value x Customer
The right place to start is with the ‘big-picture value’ that your product delivers for customers. This is pretty much your overall value proposition — how is their life better after using your product. Most pre-PMF startups are dabbling with various value propositions at any given time to figure out what’s resonating best with target customers. For example, here are the 5 value prop statements that I recently asked a sample of our active users to stack rank:
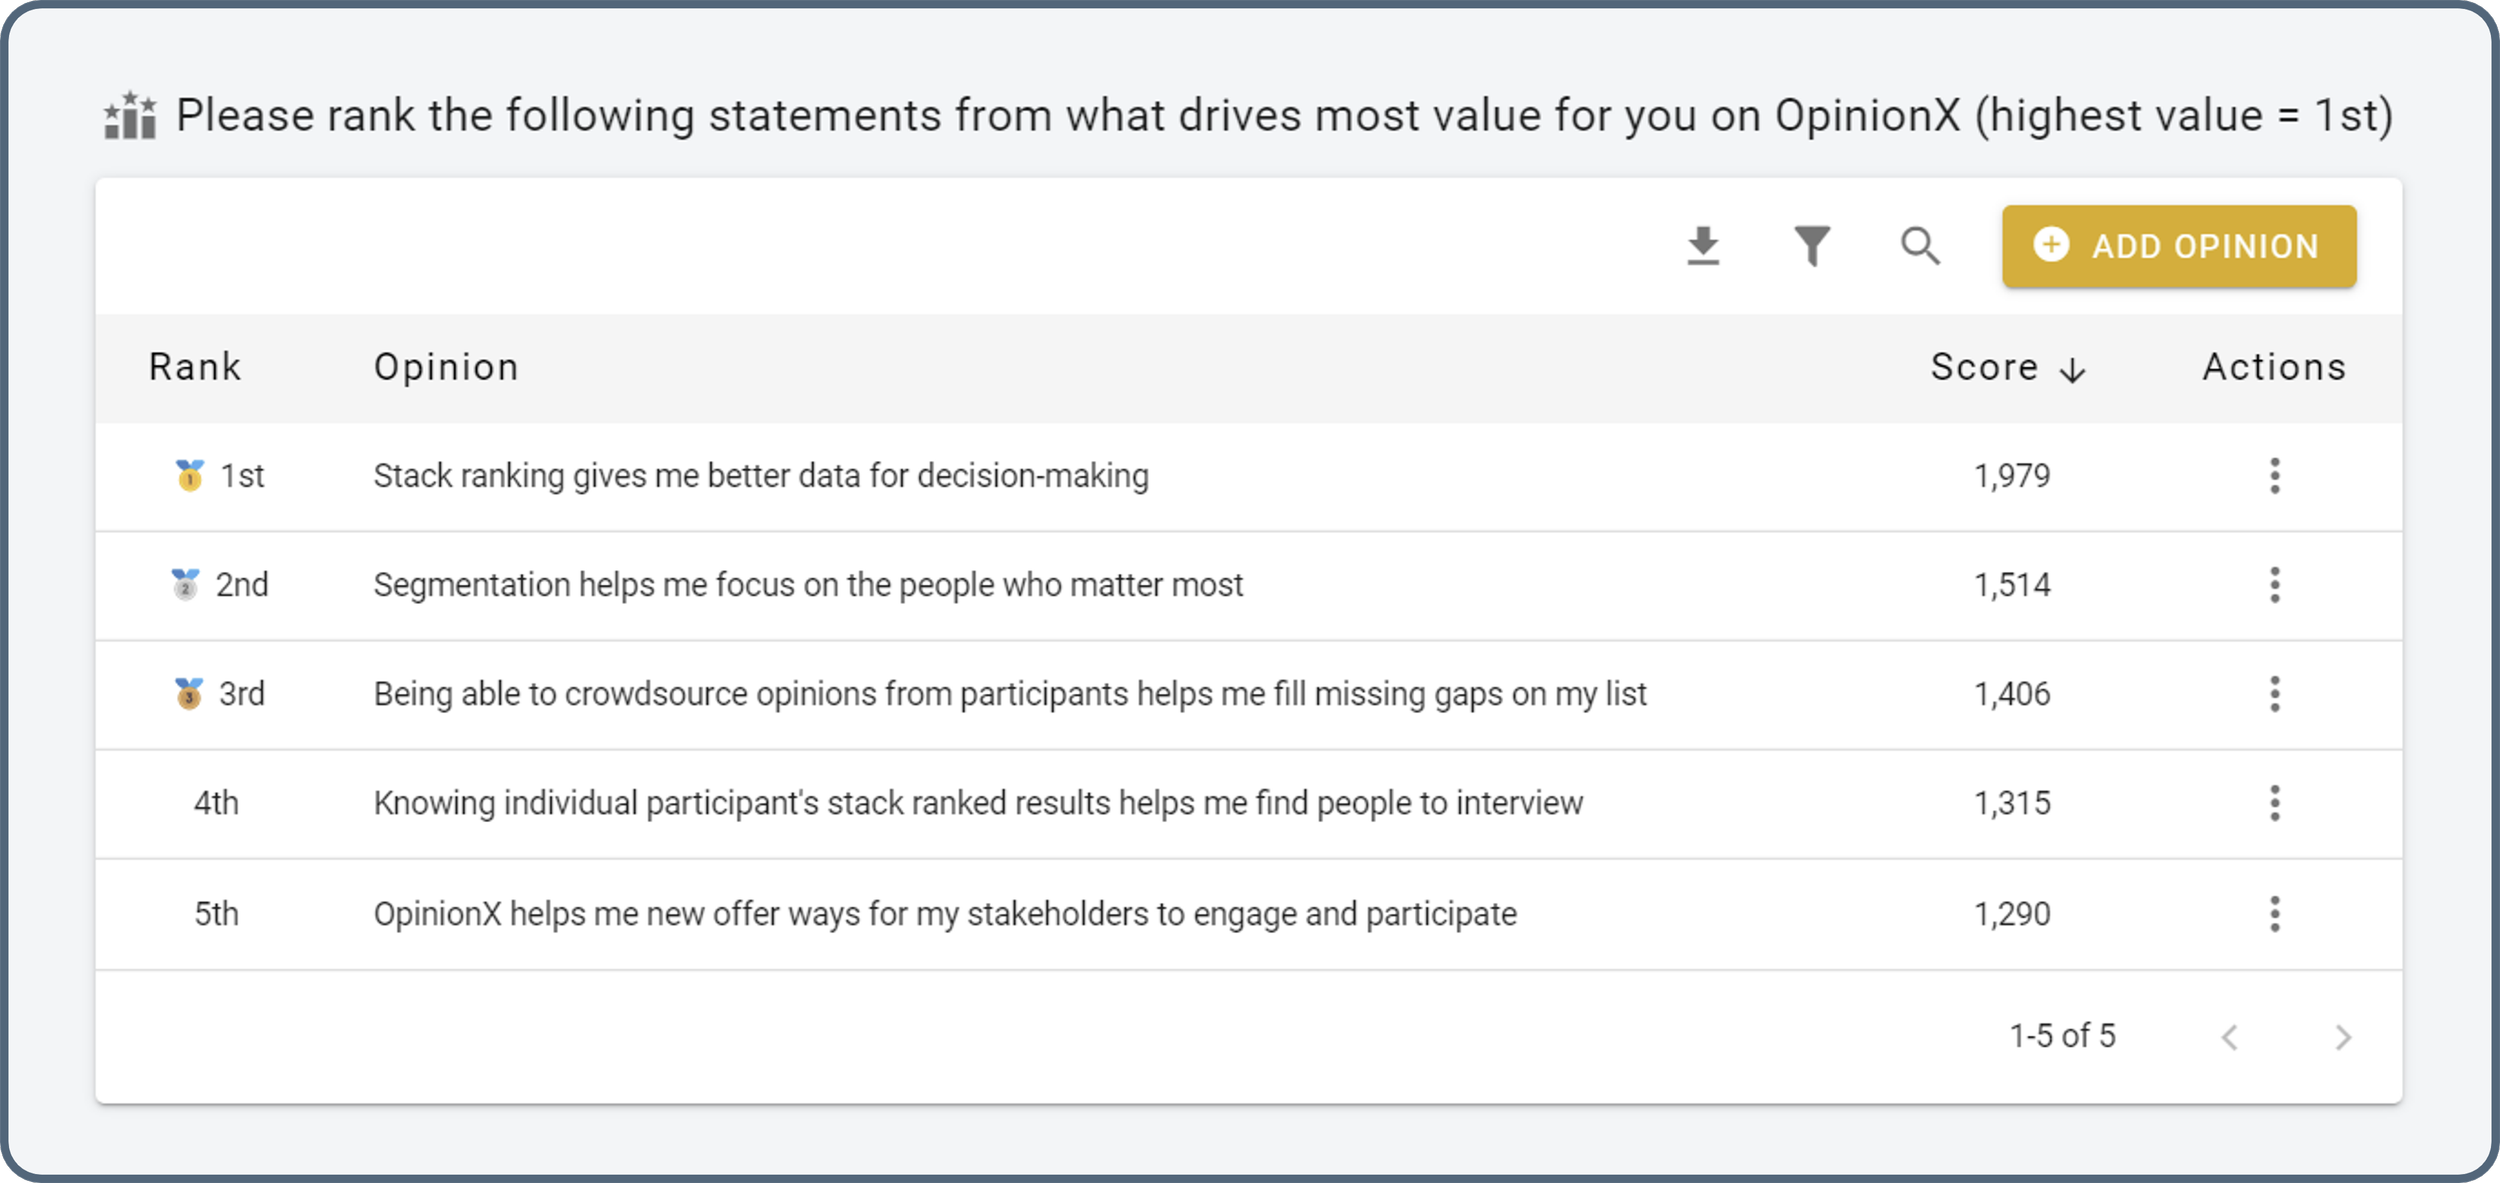
As you can see on the ‘Score’ column, we have a very clear winner (which is thankfully our current messaging). I’ve always been testing a handful of different value propositions during customer conversations and content marketing. This result is solid validation that I’ve been pushing in the right direction and that we need to double down solely on ‘better data for decision-making’ — our current best candidate for value/customer fit.
But this is more important than just our value prop. Knowing how we improve customers’ lives helps us refine our sales messaging with more targeted case studies, before-and-after examples, use case suggestions, impact-driven sales messaging, and our overall product monetization strategy.
2. Value x Product
Next, I ask users to stack rank a set of statements that associate value with different product features. This helps me gather data for two key challenges: (i) What features enable our power users to thrive?, and (ii) What are we under-monetizing?
We recently discovered that our power users often relied on spreadsheet exports from OpinionX to get detailed data for screening follow-up interview participants or for comparing segmented results. But exporting also extracts value from our product, something we therefore decided should only be possible for premium-tier customers. So we’re working on feature-gating exporting and instead encouraging freemium users to invite co-workers as in-product collaborators (which also helps drive increased awareness of our product; win-win!).
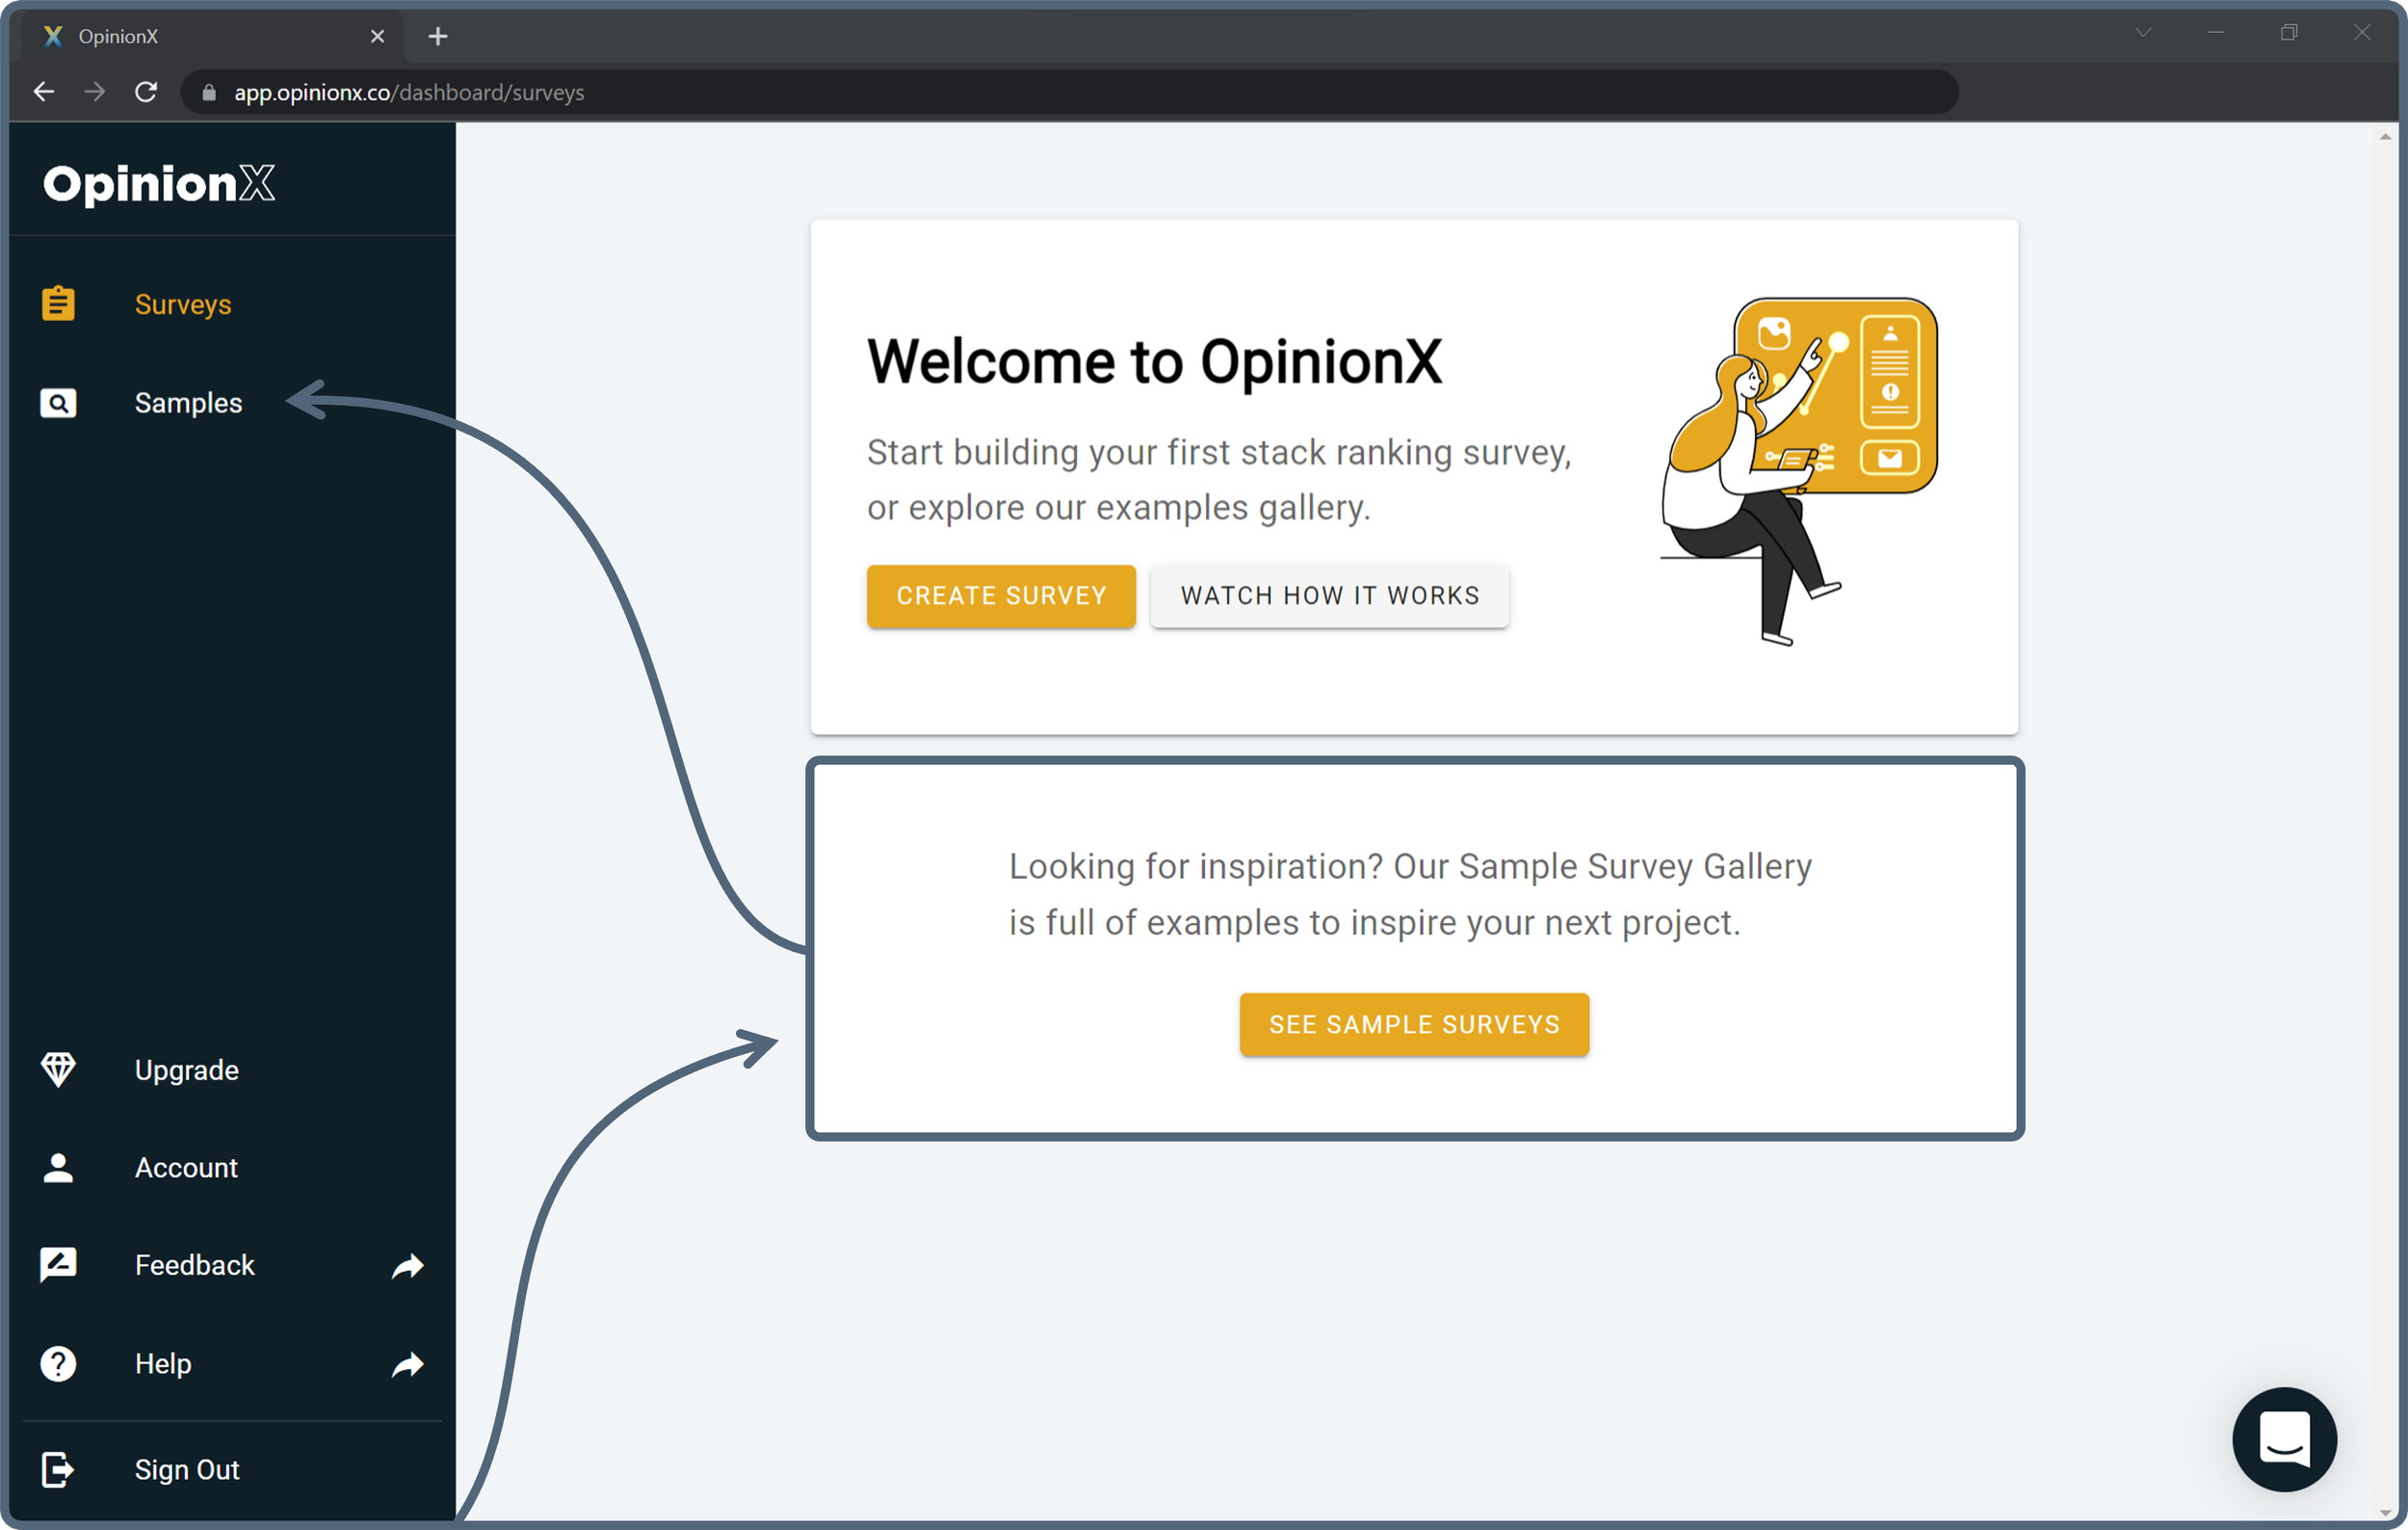
Additionally, we found that users who interacted with our sample survey had a significantly higher activation rate. So we expanded from one sample survey into a full gallery of examples and altered our onboarding to point new users towards this gallery rather than force them straight into creating a blank survey immediately.
3. Pains x Customer
We do periodic ‘Customer Problem Stack Ranking’ research projects (a research method coined by Shreyas Doshi) to understand the priority of our customer’s overall problems stack. We recognize that we’re laser-focused on the problem we’re trying to solve — to help product teams get better data for big decisions like roadmap prioritization — but in reality, product managers are juggling a whole range of different problems.
For example, when we asked 152 PMs to stack rank their biggest problems in 2021, the highest ranked problem was “Finding PMF for a new product/feature is an ongoing challenge.” That result put this blog post you’re reading right now on my content backlog. And we’re not the only ones using this approach — Fred used Customer Problem Stack Ranking to create viral problem-focused social media content for his startup Bliinx.
Like Fred, we pick relevant highest-priority problems from these stack ranked lists and use them to fuel our Pain Point SEO strategy. As a result, our blog posts almost all have a 2%–25% conversion rate to product sign-up. 0.2%—0.4% is typically considered a good conversion rate for most software/service businesses. Our guide to Needs-Based Segmentation is a great example of this.
4. Pains x Product
So far we’ve used stack ranked data to (1) tailor our sales, (2) improve our monetization, and (3) tailor our marketing. The aim of the last quadrant (4) is to improve our product.
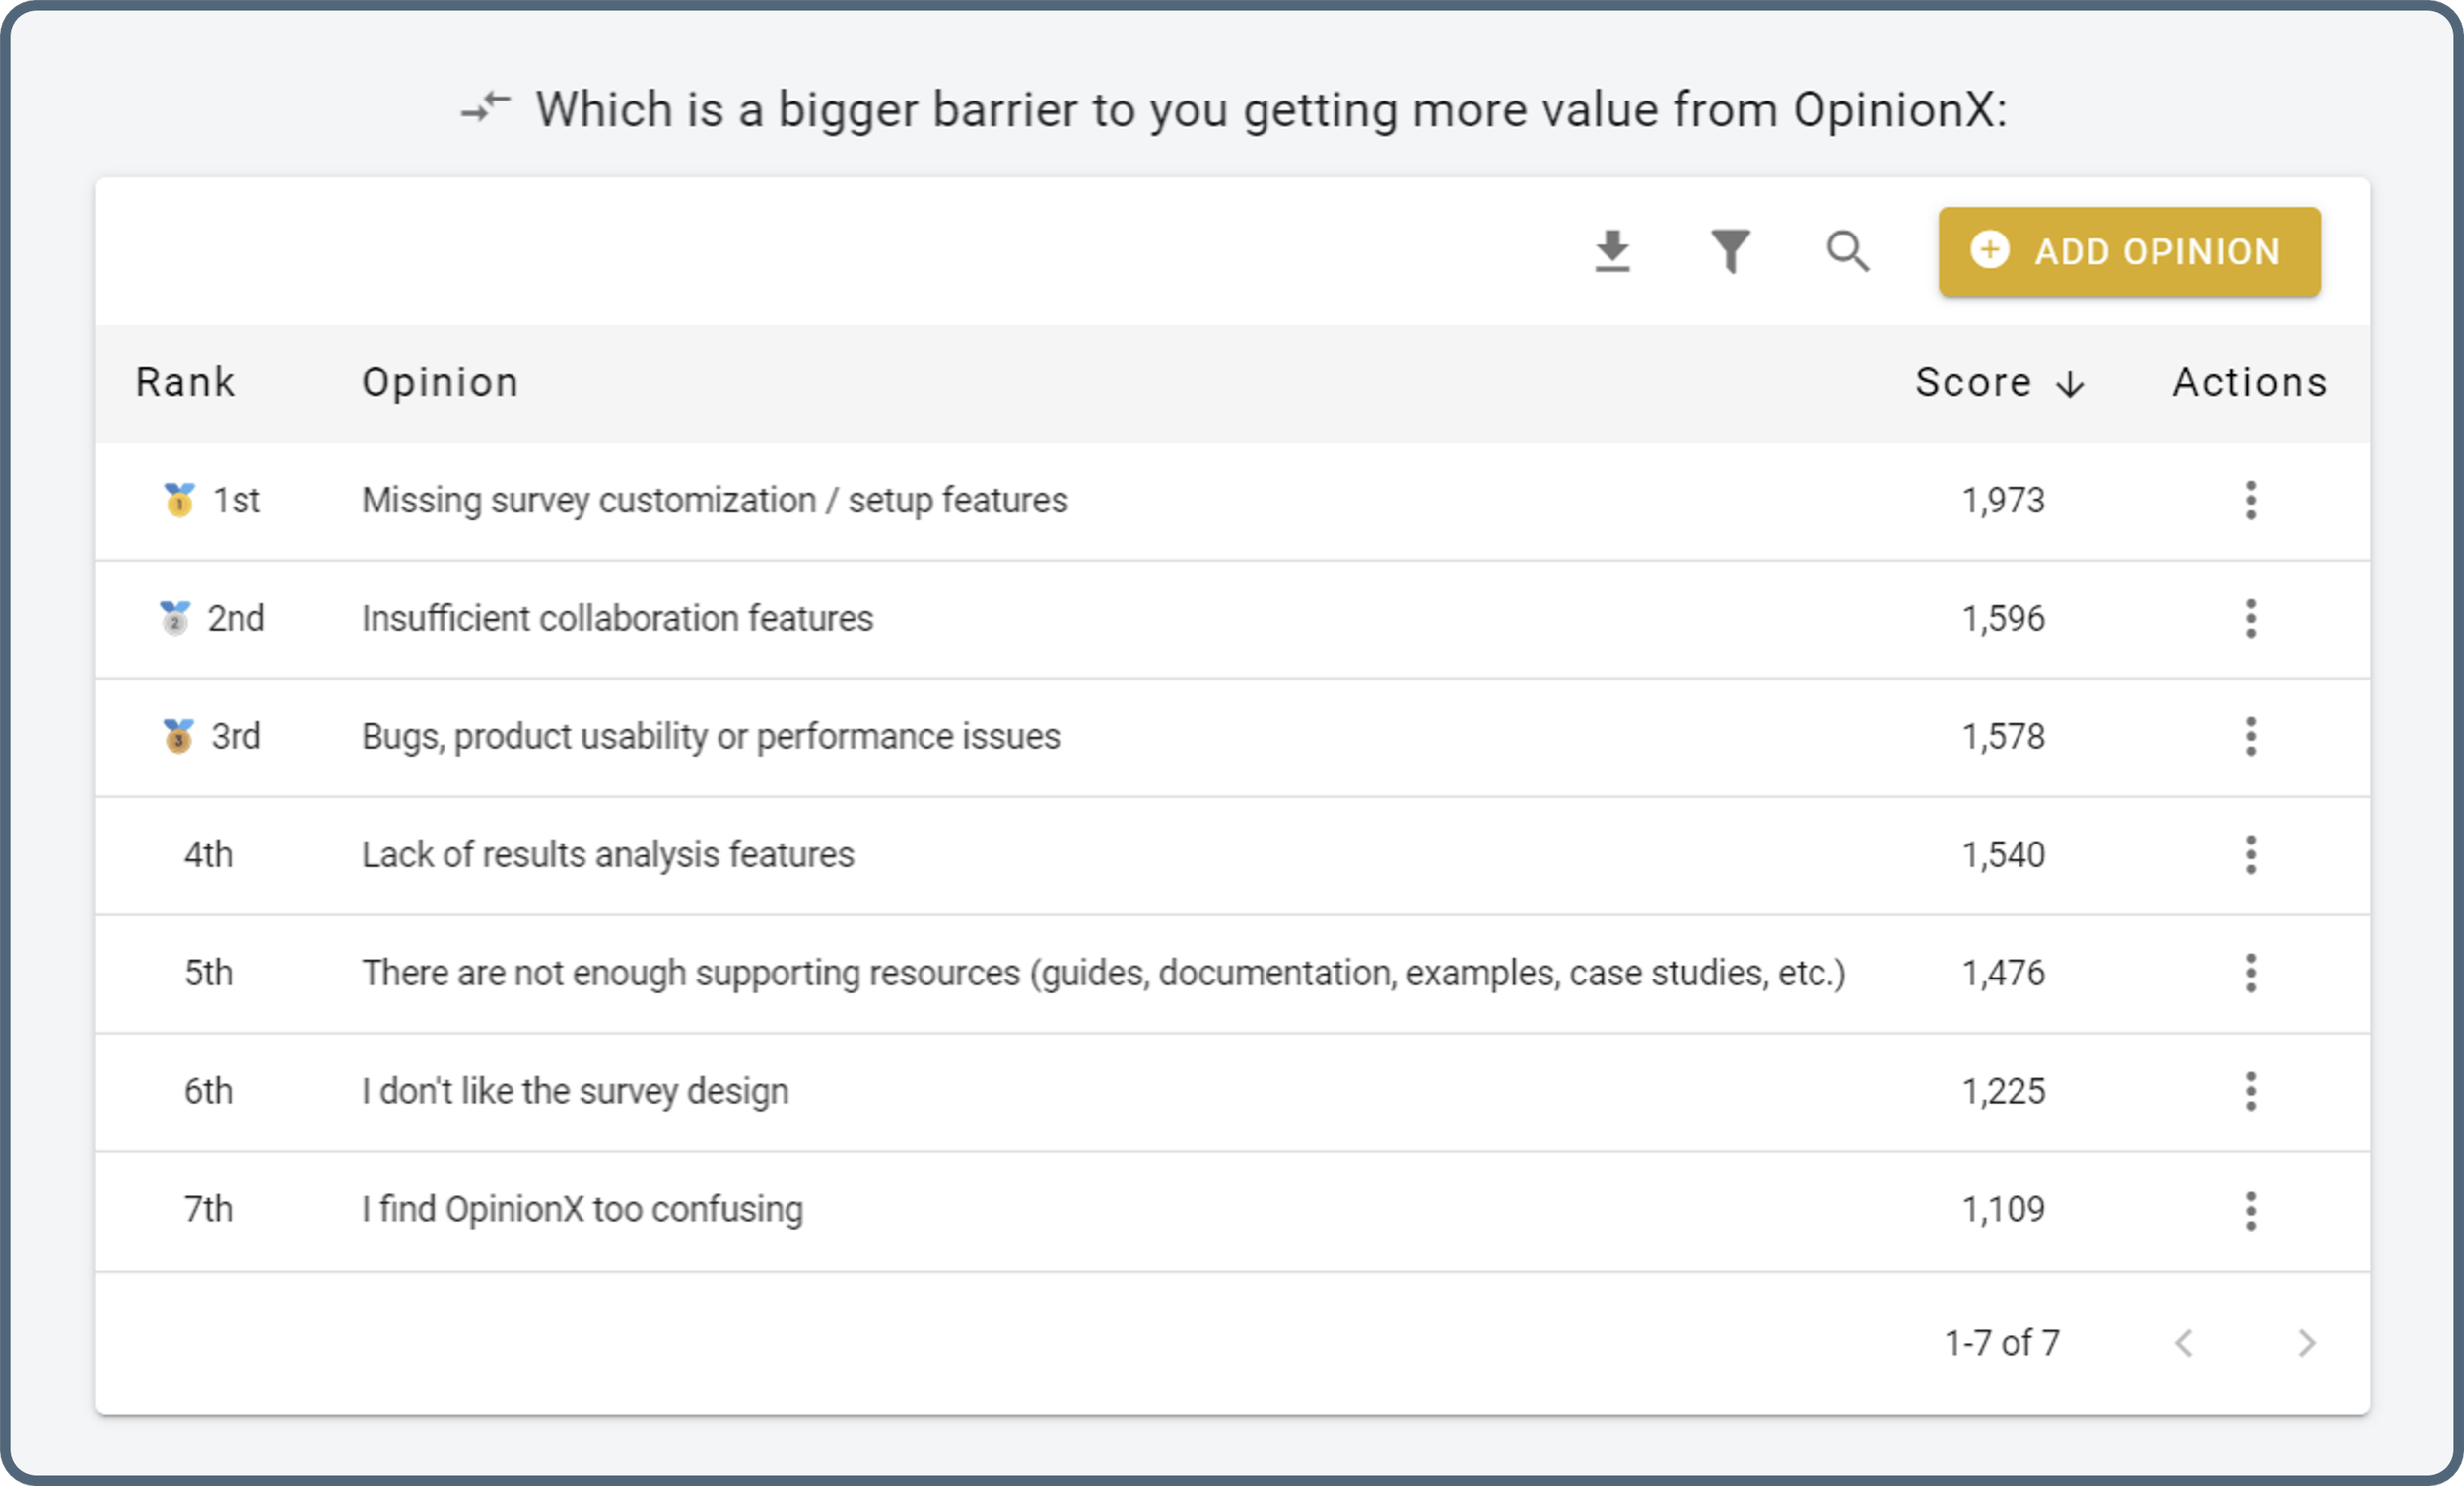
At OpinionX, we share a quarterly stack ranking survey with our users to help us prioritize our roadmap. But instead of asking them to rank which features they want, we ask them to rank their biggest barriers, frustrations and challenges when using our product. This helps us to select which product sprints we’ll pick for the following three months. For example, you can see a screenshot below of the results of our current roadmap prioritization stack rank. Each statement starts with a base score of 1500 — it’s clear what three problem categories we need to prioritize right now:
Who you collect data from is as important as the data itself
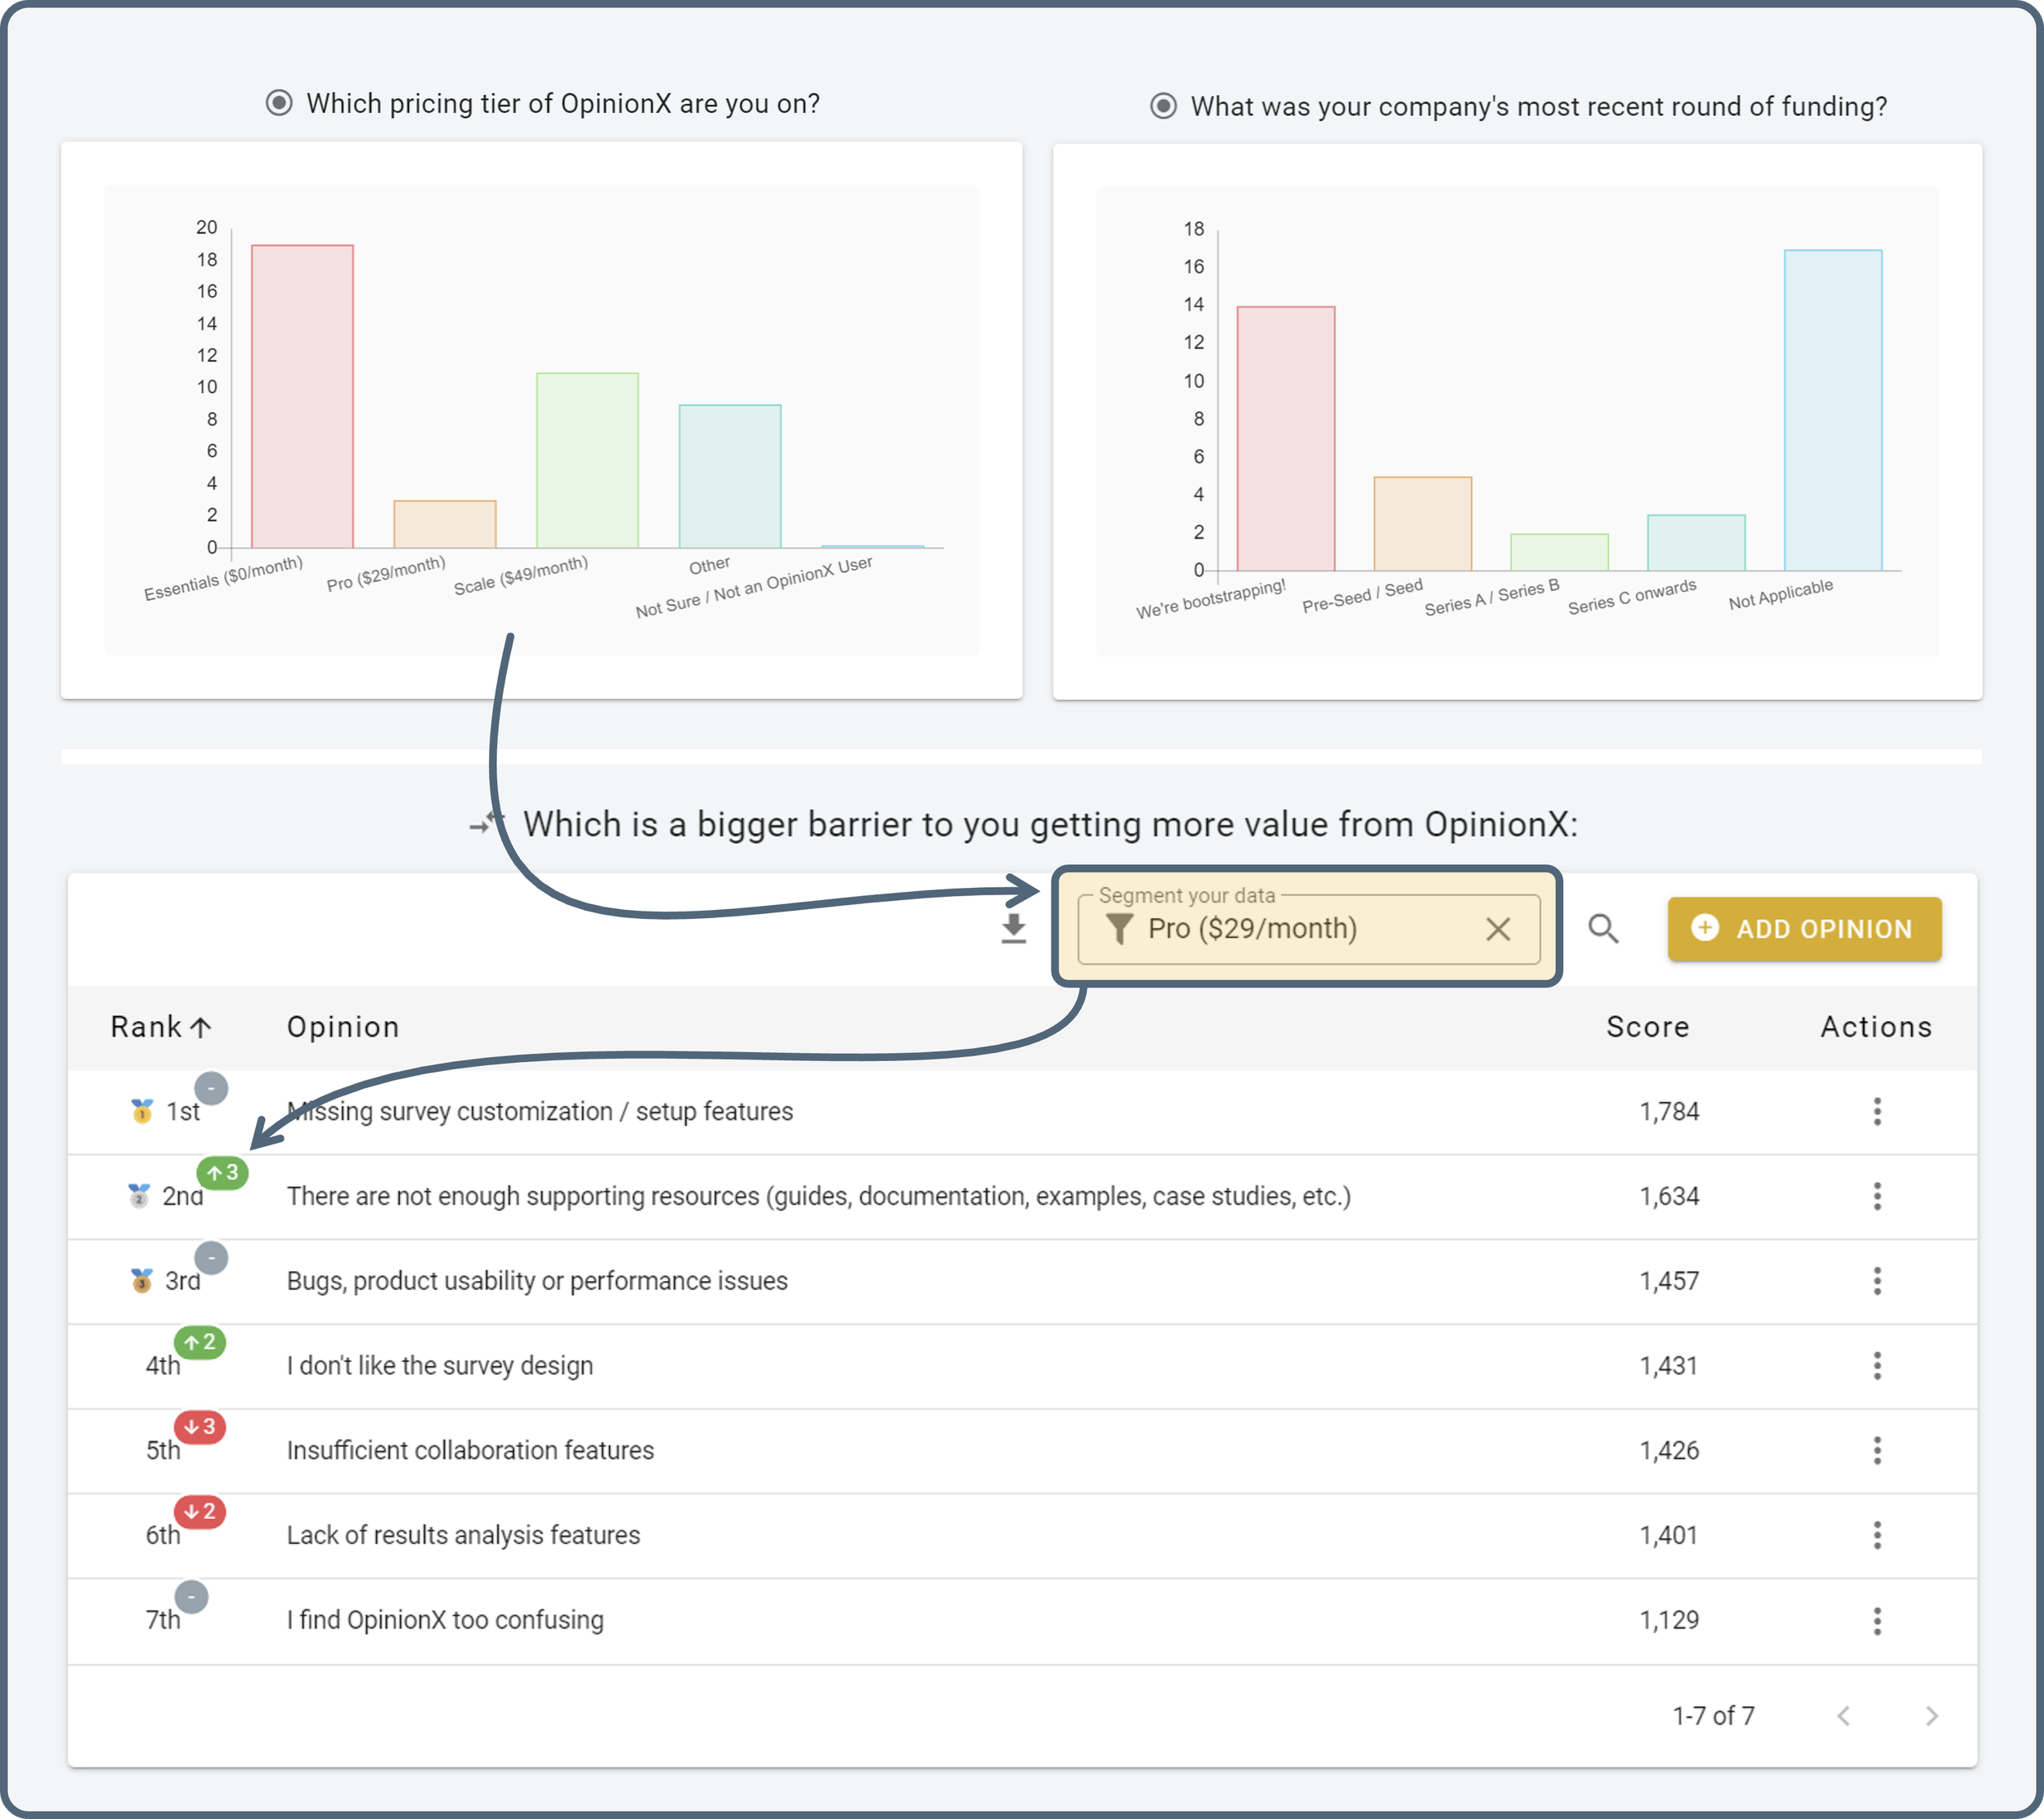
None of the displayed data is useful if we’re collecting it from the wrong people. We collect demographic, firmographic and pricing-tier data on every stack rank participant so that we can later segment our results to highlight the priorities of our exact ideal customer profile. You can see an example below of my results filtered to include only my ‘Pro’ Customers:
A better way for Pre-PMF teams to iterate their way to success
The only widely-agreed method for measuring product/market fit is Sean Ellis’ PMF Survey. You ask customers “How would you feel if you could no longer use our product?” and if over 40% say “Very disappointed”, then congrats — you’ve reached PMF! If you get under 40%, good luck and try harder next time :)) Not so useful really…
Before I started using The PMF Iteration Matrix, I felt tied to an exhausting scattergun approach indefinitely. Every user conversation, feature request, or new feature suggestion had the potential to drag me off-course in a different direction. Unfortunately, that’s everyday life for most pre-PMF teams.
Today, The PMF Iteration Matrix gives me peace of mind that I’m making meaningful progress every week to use our existing traction to get one step closer to true product/market fit. I hope that it proves as valuable for your team as it has ours.
If you enjoyed this essay, the best way you can show your appreciation is by subscribing to our newsletter. We share actionable advice on user research for customer-led startups and every new subscriber is an extra dose of motivation to make the next essay even better than the last. Subscribe below:
When I’m not writing essays like these, I’m busy building OpinionX — a free research tool for stack ranking people’s priorities. We help thousands of product teams at companies like Spotify, Salesforce and Instacart to inform their big decisions with real data on what matters most to their users. Create your own stack ranking survey for free in minutes at app.opinionx.co.
— Daniel ✌️