
Using MaxDiff Analysis To Measure Customer Concerns (Airbnb Case Study)
“This is a worked example of how to use MaxDiff analysis to rank a long list of customer concerns, built around a real situation: the backlash from Airbnb hosts after the Summer 2025 Services tab launch. It walks through the full method: collect concerns from social media, write them as single-variable problem statements (35 of them here), run a MaxDiff survey to measure which matter most, turn the votes into a ranked list, then segment the results by host type with a crosstab to see how priorities differ. The Airbnb scenario is illustrative (the survey here is a demonstration, not research Airbnb commissioned), but the workflow is exactly how you’d prioritise any big list of problems when you can’t fix them all at once.”
In their Summer 2025 update, Airbnb introduced a new Services tab for booking on-demand amenities like masseuses, private chefs, and photographers. Many of these were already available on Airbnb's Experiences tab, but this update split the two into separate sections for a cleaner experience.
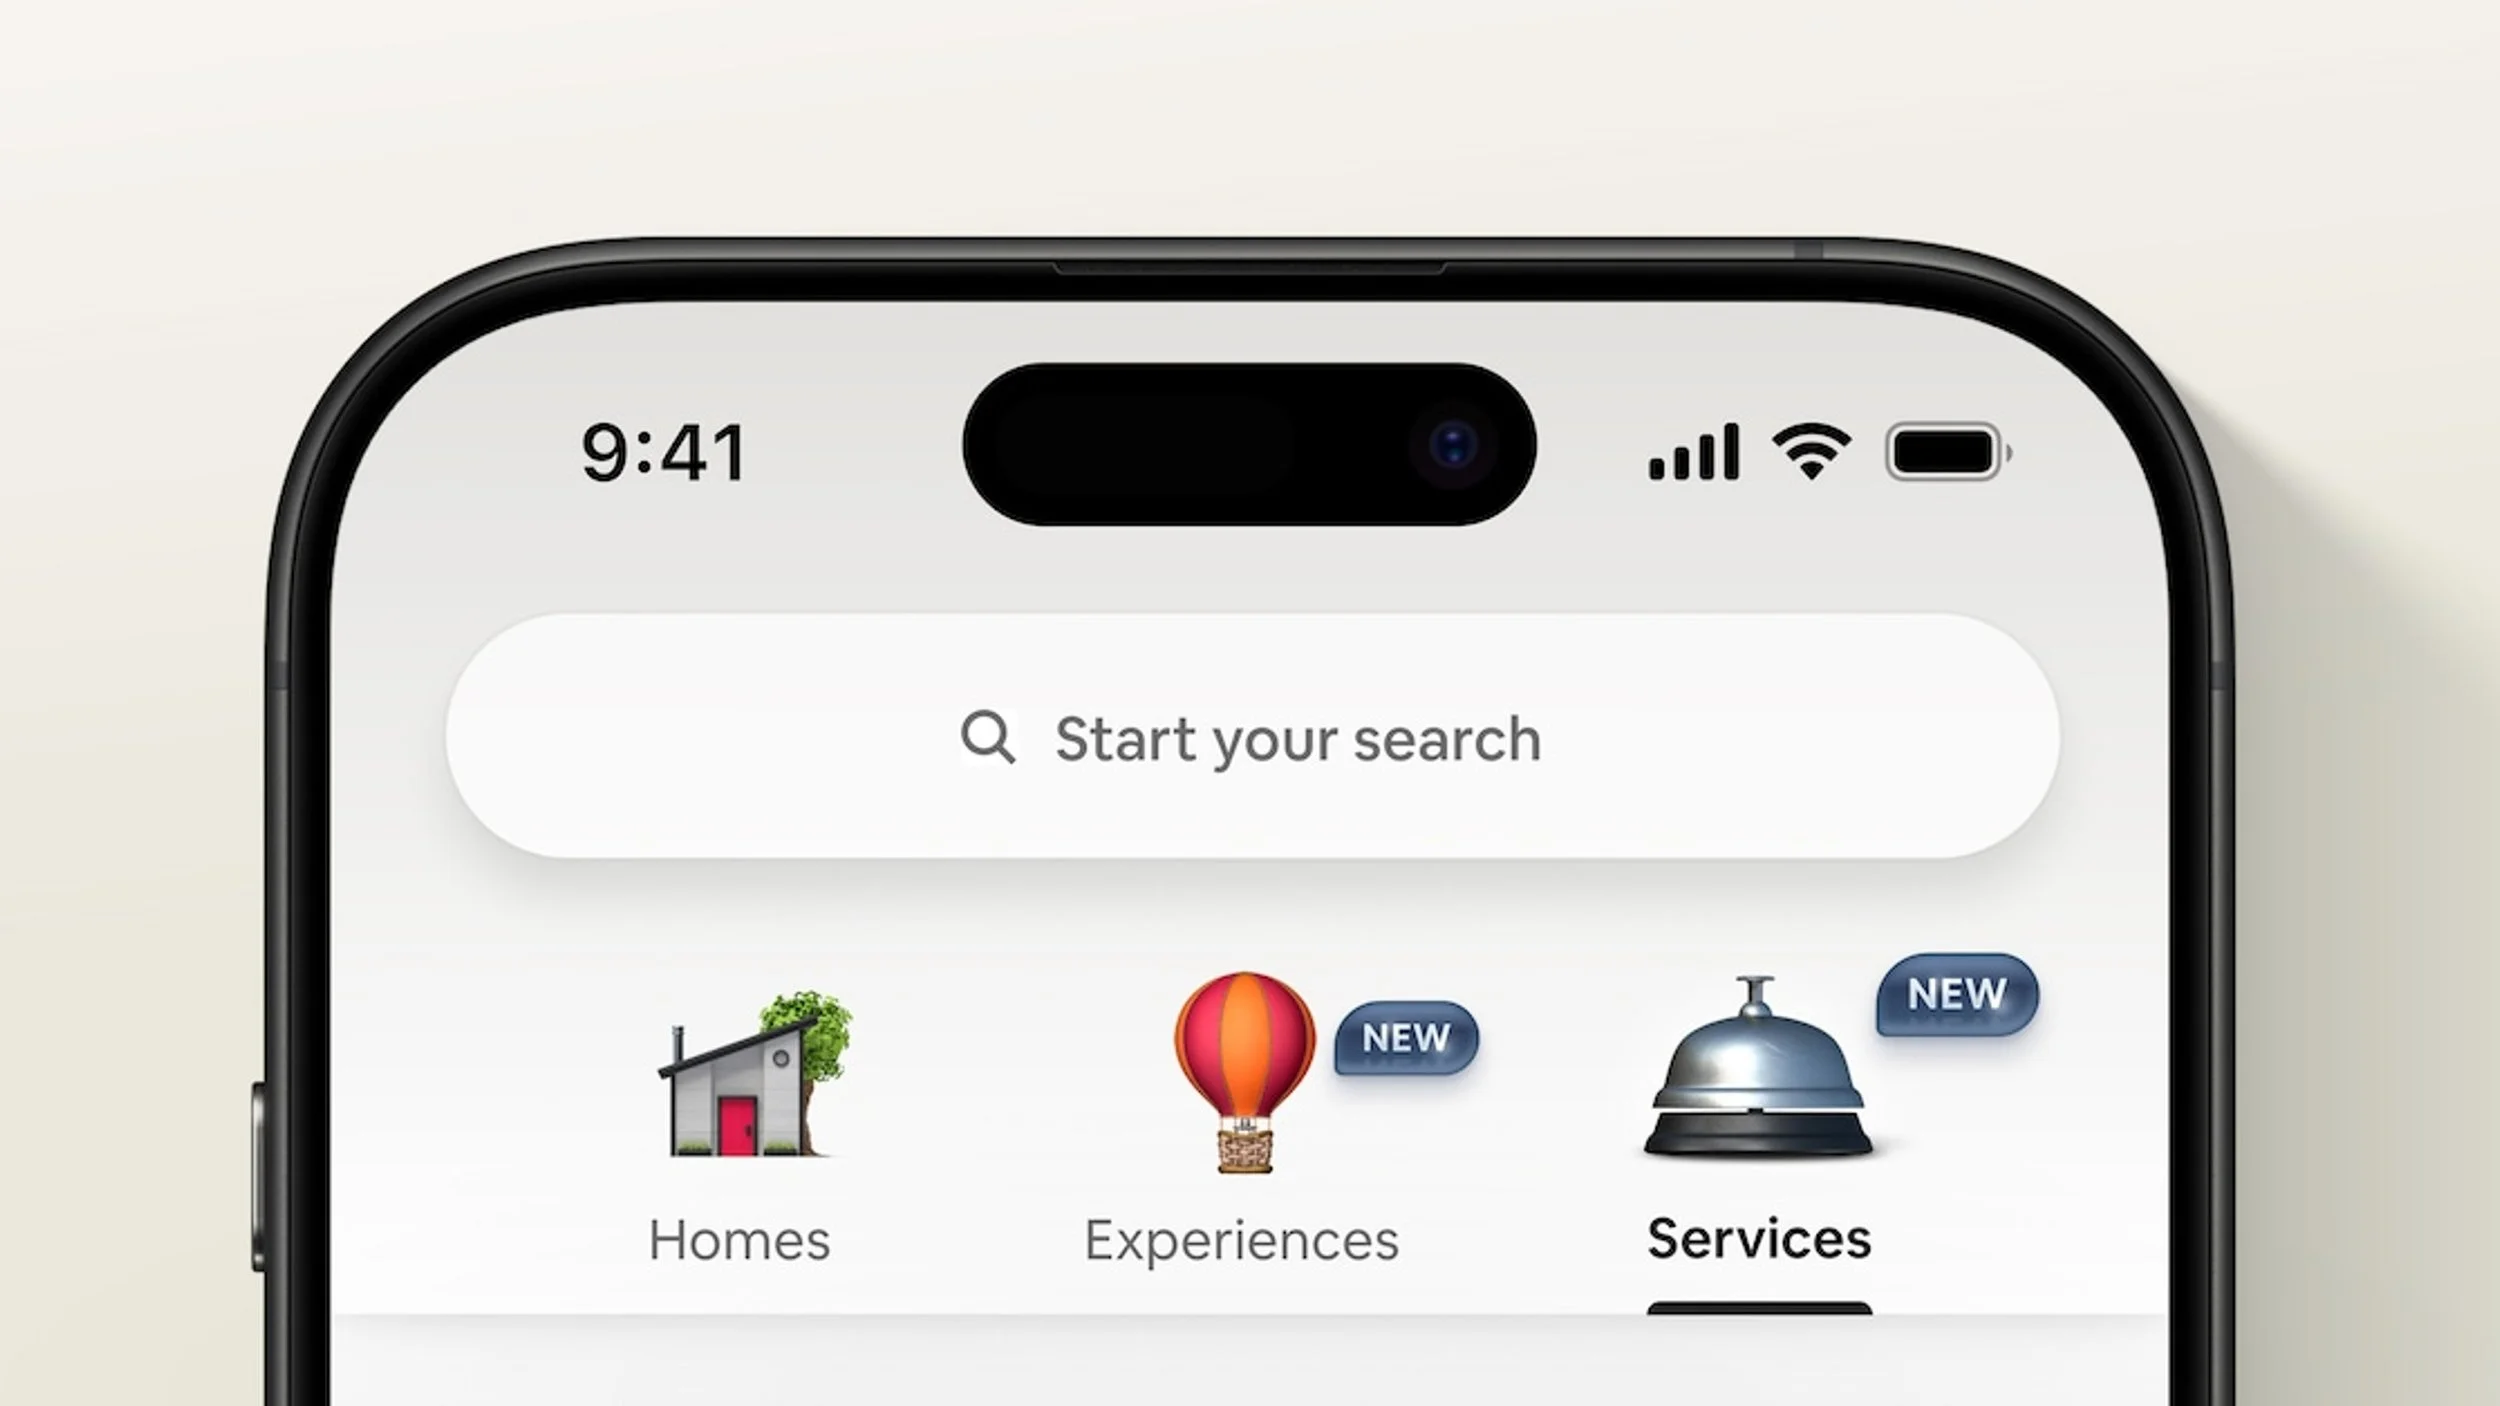
That sounds like a no-brainer launch, but it quickly turned chaotic. Social media lit up with Airbnb hosts raising alarms about insurance liability, property damage risks, and rumours that hosts would be penalised for refusing to allow Services in their properties. A lack of reassurance from Airbnb didn't help: in 2021 the company shifted from frequent updates to just two big product-release events a year, which means Airbnb's product team is right now trying to work out how to improve the Services tab ahead of their Winter 2025 Release event in Q4.
So what research should Airbnb be running to identify, contextualise, and address hosts' top concerns about the new tab? Here's one approach.
Collecting host concerns (the easy part!)
Almost immediately after Airbnb Services launched, hosts began voicing concerns en masse. A quick search turns up Reddit and Facebook posts with 100+ comments from stressed hosts, along with YouTube tutorials trying to explain the unclear opt-out process.
Some concerns repeated throughout these posts:
Increased cleaning costs and property damage risks.
Unauthorised commercial activity in residential homes.
Potential insurance and legal problems from accidents.
No opt-out process or refusal mechanism offered to hosts.

These could have been uncovered before launching Services with a few user interviews, and the whole frenzy could have been avoided. But in today's ship-fast culture these things happen, especially in multi-sided marketplaces where one stakeholder group is easily underprioritised. On the bright side, social media is now full of free feedback for Airbnb researchers (and me) to trawl through.
Creating a [s̶h̶o̶r̶t̶l̶i̶s̶t̶] longlist of host concerns
Looking through these social media posts, I created a list of 35 problem statements covering hosts' concerns about Airbnb's new Services tab:
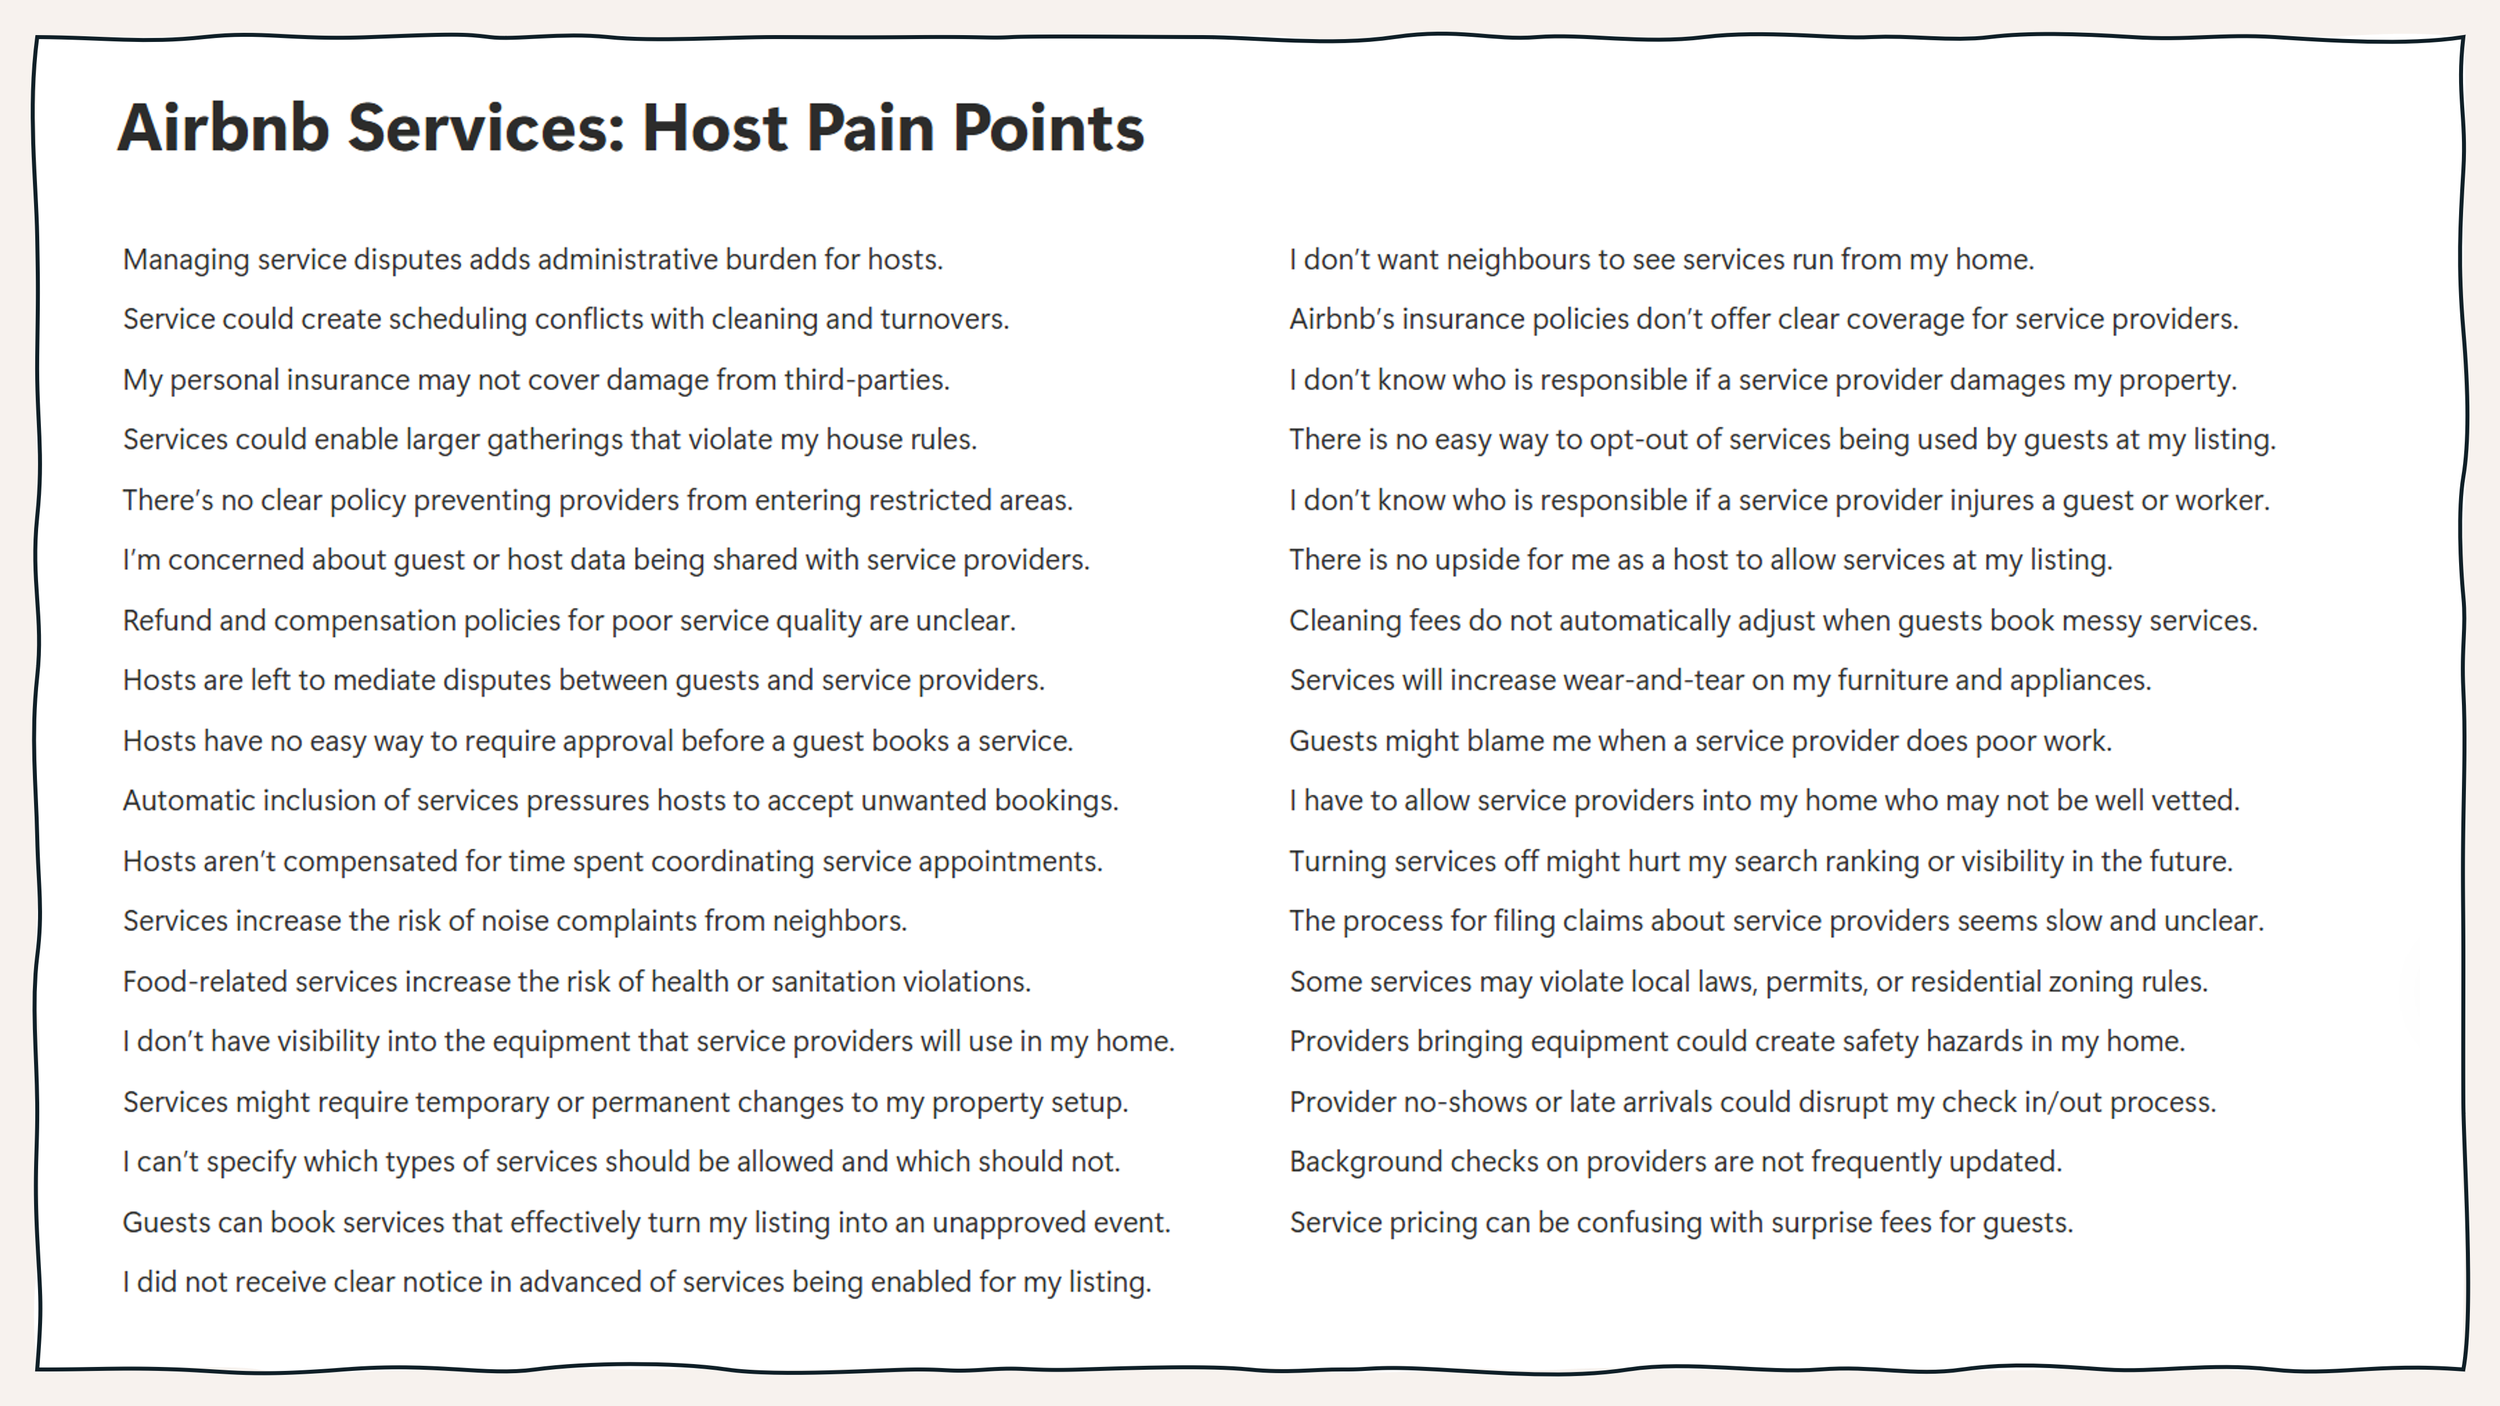
To follow the principles of writing good problem statements for customer surveys, each statement must include only one variable. An example of a two-variable statement would be: "Services increase wear-and-tear on my home and I'm not reimbursed for damages or extra cleaning." Split anything with multiple variables into separate statements → "Services may cause extra cleaning costs that aren't reimbursed" and "Services increase long-term wear-and-tear on my home."
Measuring relative importance of user concerns
Nobody can tackle all 35 of these problems at once, not even a big company like Airbnb. To prioritise the top concerns, the Airbnb product team would need to know which mattered most to hosts. A good way to rank a list of customer problem statements like this is a survey format called MaxDiff Analysis.
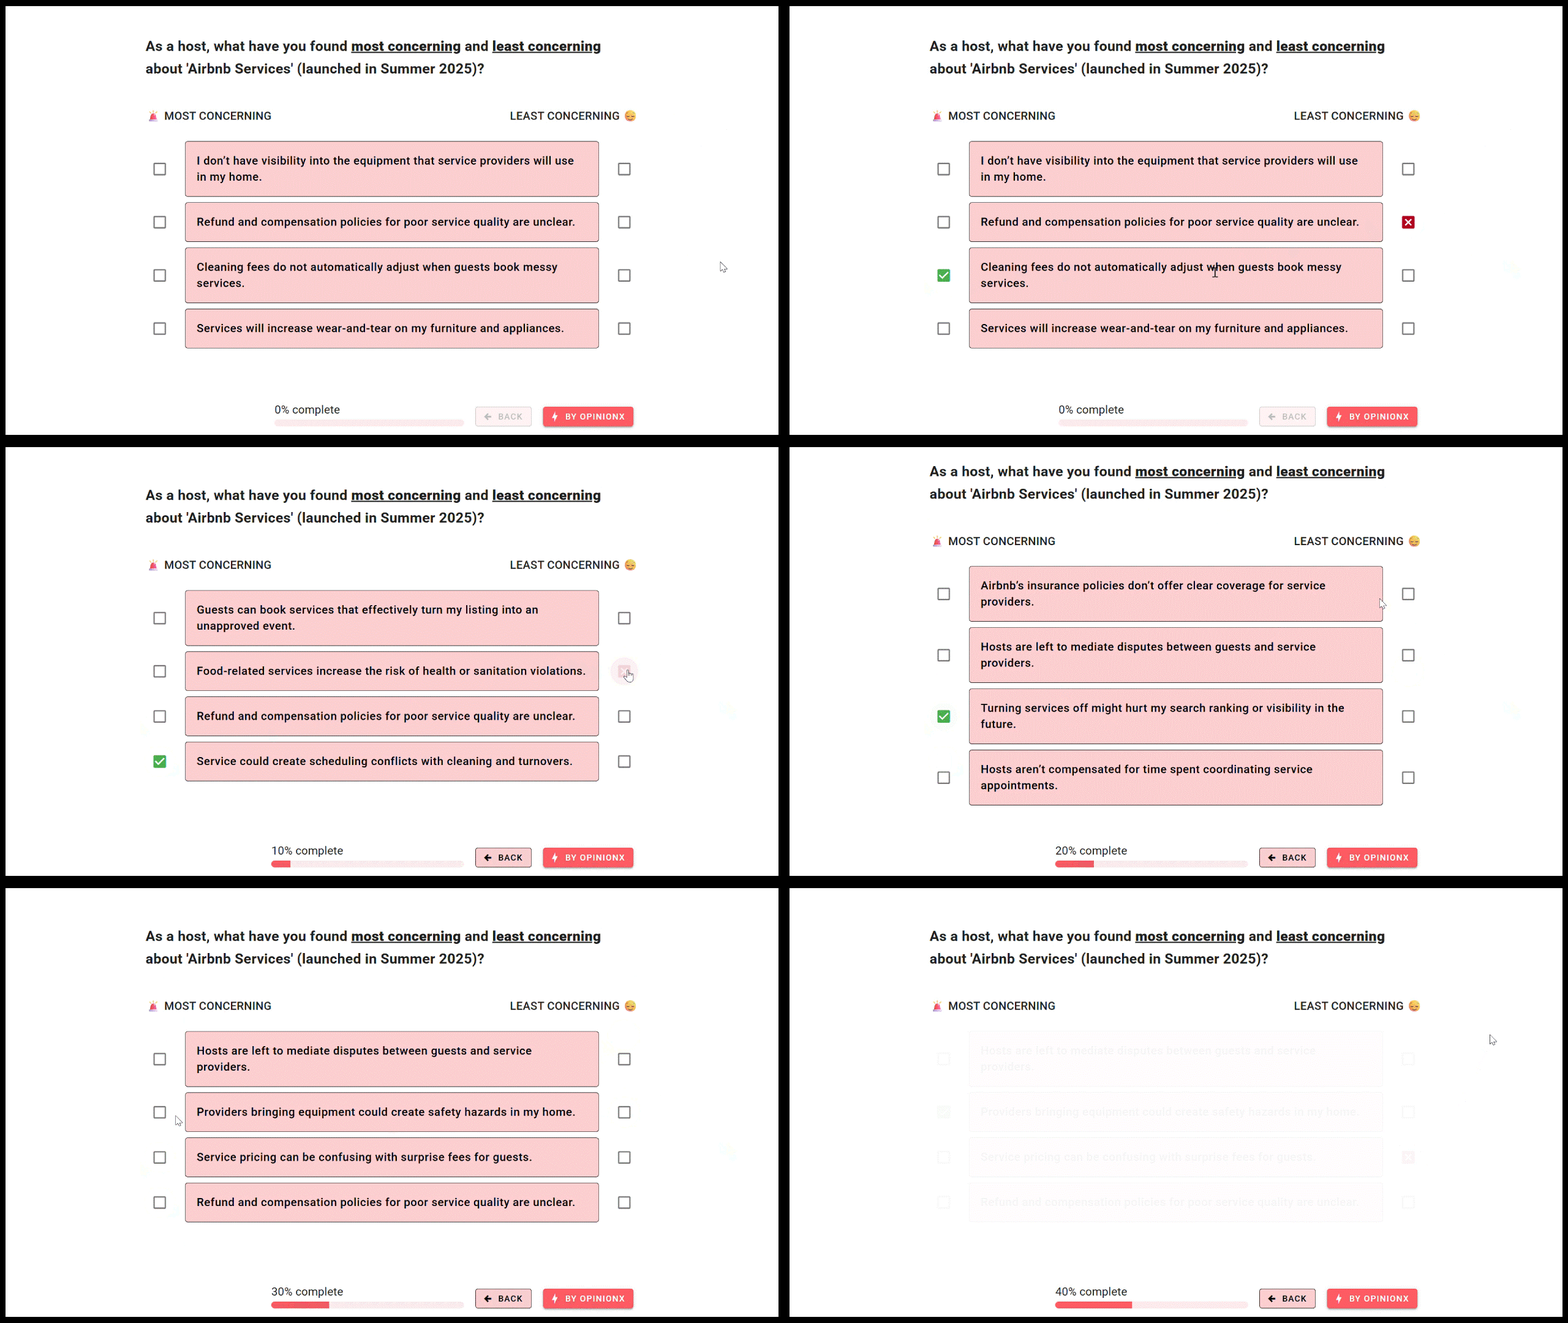
MaxDiff Analysis is a voting method that breaks a long list of options into a series of smaller voting sets. The survey shows 4 statements at a time and asks participants to pick the most concerning and least concerning option from that set.
Turning maxdiff survey votes into a ranked list
Thankfully, maxdiff surveys don't need messy spreadsheets or complex formulas. With a survey platform like OpinionX (which offers free maxdiff analysis surveys for up to 25 participants), everyone's votes are analysed automatically and the full list is ranked for you:

As you can see in the example above, MaxDiff Analysis survey results are easy to interpret, with right = higher concern, left = lower concern.
Each statement gets a score between +100 and -100, where +100 means it was picked as "most concerning" every time and -100 means it was voted "least concerning" in all the sets it appeared in. You can view maxdiff results in a bar chart or a simple data table, like in the GIF below.
Running a MaxDiff study like this and want a hand writing the problem statements and setting up the survey? Book a free 30-minute setup call and a research expert will walk through it with you, no cost, no obligation.
Comparing how top concerns vary by host type
Airbnb has many types of host: some rent individual rooms in their own home, others rent full houses, and some are professionals managing many properties for different owners. Each type likely has a different set of concerns about Airbnb Services. Filtering the maxdiff results to one host type helps me understand their specific concerns and what matters most to them.

To enable this filter, click a bar on any of the Multiple Choice charts and the survey recalculates the results for that group. Filtering this way is a good way to see how one group voted, but an even better way to spot outlier opinions is a crosstab table. A crosstab uses the same starting point as the simple data table, each row a ranking statement and its maxdiff score, but adds extra columns with scores for different participant groups:
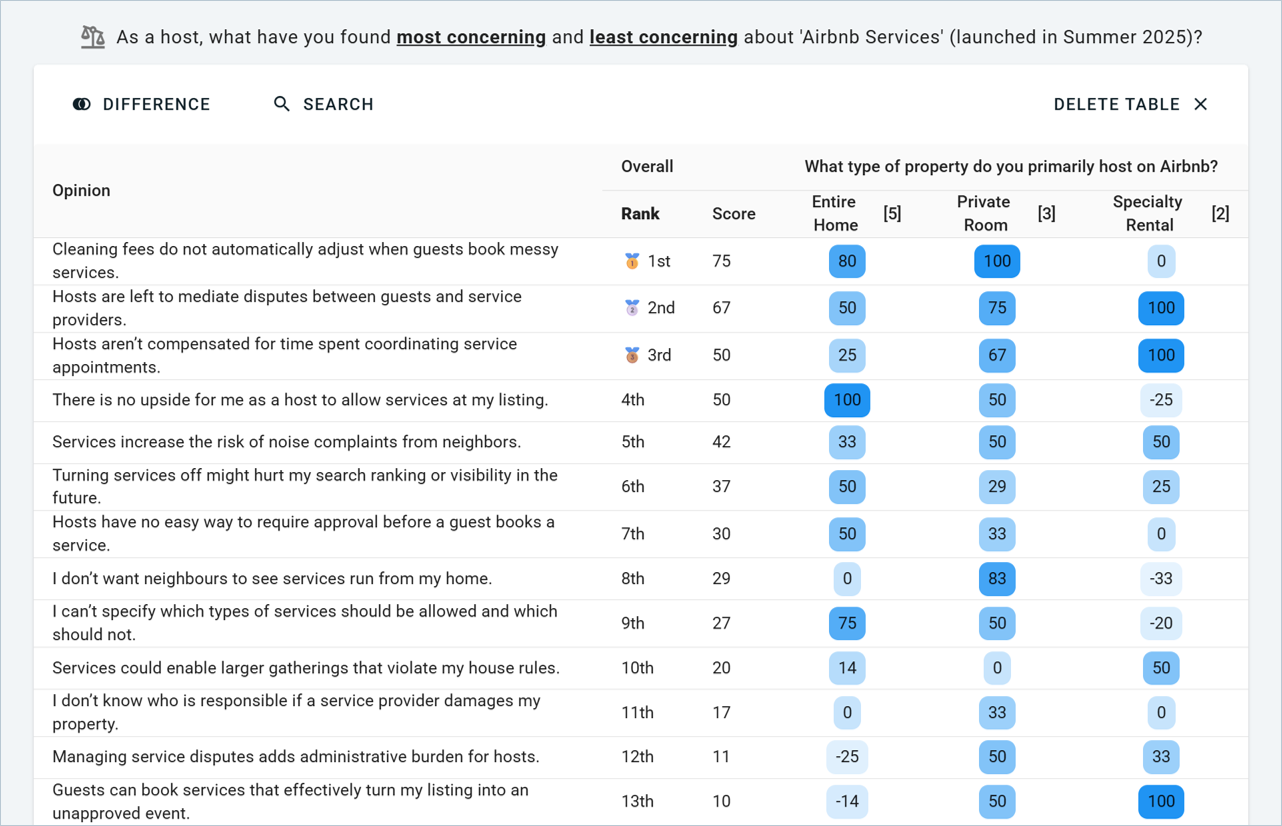
The three extra columns with blue numbers show the maxdiff results for three types of Airbnb host: entire home, private room, and specialty rentals.

Look at the statement "I don't want neighbours to see services run from my home" on the 8th row and there's a big split between host types. Those renting their entire home or specialty accommodation barely care, but live-in hosts renting a private room in their own house care a LOT, it ranks as their second-highest concern overall. Comparing how concerns vary by segment is what lets you build a targeted fix rather than a blanket one, which is why it's worth pairing maxdiff with segmentation whenever a launch goes sideways.
Reset your comfort zone expectations
Plenty of product researchers assume maxdiff analysis is a complicated method. I hope this guide shows it isn't. Any researcher, whatever their experience, can run maxdiff surveys to measure people's needs, preferences, and priorities.
OpinionX is a survey platform for strategic product research. It offers methods like maxdiff analysis to measure user needs, map customer segments, and model pricing decisions, all with built-in automations that save you from messy manual spreadsheet work.
Frequently asked questions
What is MaxDiff analysis used for? Ranking a list of options by relative importance. Participants repeatedly pick the most and least important item from small subsets, and those forced trade-offs produce a clean ranked list, which is far more reliable than asking people to rate each item on a scale.
Why use MaxDiff instead of a rating scale for customer concerns? Rating scales flatten out: people mark most concerns as "very important" and you can't tell them apart. MaxDiff forces a choice, so you learn the real order of priority, which is what you need when you can only tackle a few problems first.
How many problem statements can you rank with MaxDiff? A lot; this example uses 35. The key is writing each as a single-variable statement (one concern per item), so anything with two ideas gets split into two statements.
How do you see which concerns matter to different customer groups? Segment the results. Filter the MaxDiff scores to one group (here, one host type), or use a crosstab table that adds a column of scores per group, so you can spot where one segment's priorities diverge from the overall ranking.
How many participants do you need for a MaxDiff survey? Enough for stable scores across your segments; more matters when you're slicing by subgroup. You can run a MaxDiff survey free on OpinionX for up to 25 participants, which is plenty to test the design before scaling up.
Want more like this? Over 42,000 researchers and product people get The Full-Stack Researcher in their inbox. Subscribe for the next one.
— — —
About The Author:
Daniel Kyne is the Founder & CEO of OpinionX, the survey platform for strategic product research. Thousands of researchers use OpinionX to measure what matters most to their most important customer segments — enabling advanced research like maxdiff surveys and segmentation analysis on an easy-to-use platform.
→ Try OpinionX for free today