
The History of Web Analytics and Future Predictions (1990s-2020s)
Every time the tech industry goes through a step change, the way that we collect and analyze data follows.
By analyzing the changes that led to the product analytics category as we know it today, we can predict how new trends like Product-Led Growth, recurring revenue models and web3 will influence user analytics in the coming years.
This blog post is part one of a four-part series on Priority Analytics; exploring how emerging trends in tech are creating the conditions for an entirely new generation of the product analytics market. Check out part two, The Guessing Gatekeeper, here.
Small Beginnings: The Hit Counter
The first web analytics tool, Analog, was launched in 1995. It analyzed server logs to understand which pages a user visited on a website. Analog inspired the era of hit counters (pictured below) and made 'Page Views' the first 'North Star Metric' for the web analytics V1 world.

Hit Counter UIs graphic from the Amplitude blog
A decade of improvement followed, with new tools like Clicktale, Omniture and Urchin (acquired in 2005 by Google to become Google Analytics) improving the usability and functionality of log-file analytics, spreading it to even more developers. 'Page Views' remained in the top spot during this time as the most important analytics metric to track in web1.
Step Change 1: From On-Prem to Cloud-Based Software
The first analytics product to make funnel reports accessible was KISSmetrics.
In late 2009, Hiten Shah and the KISSmetrics founding team had just called it quits on their second failed startup idea. In an effort to find a better idea, they decide to survey online marketers. As Hiten Shah explains in his 2019 blog post, the results of this survey would go on to inspire the cornerstone feature of today's product analytics tools:
"We needed to stop building what we thought the market wanted and get back to basics. Instead of writing code, we went out and talked to customers. We spoke with people who used our largest competitor, Google Analytics. We asked them questions to better understand their needs and the current problems they were having with analytics software. They had a lot to say, so we listened.
"They needed data to help them improve the performance of marketing campaigns once people visited their websites. They were also willing to pay for analytics to help them improve website conversion rates."
This discovery marks the beginning of the second generation of web analytics and catalyzed the rise of the Marketing-Led Growth era of the 2010s.
People love to overestimate the impact Hubspot had on the rise of the Marketing-Led Growth era simply because it created the brand most associated with 'inbound marketing'. Gabriel Marguglio hints at this misconception in his 2019 post The History of Inbound Marketing — Then and Now:
"The concept of inbound marketing wasn't born until 2005, after the phrase was coined by HubSpot's co-founder and CEO, Brian Halligan. It began to show up in tiny blips and bleeps on the Internet in 2007 but it wasn't until 2012 that it really started to grow."
Why did inbound marketing take off around 2012? → Cloud computing.
In the late 2000s, cloud computing began to rapidly overtake on-premises as the preferred infrastructure for software — especially amongst new startups.

Graphic from State of Cloud 2020 by Bessemer Venture Partners
Software companies building on the cloud changed the role of a company’s website.
On-premise software was expensive to implement and therefore carried a high price tag. A high price tag meant that the buyer was typically the top dawg (CEO or CIO) and required a lot of due diligence beforehand, so their objective was to get a knowledgeable salesperson on the phone to get every question answered upfront. The on-prem model focused on getting more people to your website each month and a high percentage of those people to call/email. 'Page Views' is the only metric you needed as an on-prem company.
Cloud-based software had scale built-in. Infrastructure moved from being a fixed cost for every customer to a variable cost with economies of scale spread across the entire customer base.
While COGS fell, allowing cloud-based companies to undercut their on-prem competitors on price, the hourly rate for a salesperson didn't. A company couldn't afford to burden salespeople with the same amount of work answering questions and educating prospects if a customer was going to be spending 3x less than before. This need drove the move from sales-led to marketing-led growth.
Cloud-based companies had to change the function of their websites from being a glorified 'Contact Us' page to include content like blogs, FAQs and infographics to attract, educate and qualify sales leads. To know which content was driving the most impact on these objectives, marketers needed to be able to track a lead as they progressed along each step of the journey from visitor to qualified lead to conversion.
KISSmetrics took web analytics out of the Web1 developer tools category and democratized it for digital marketers.
Building a conversion funnel for your website in 2008/2009 was no easy task. A quick Google search for 'funnel'+'google analytics' between 2004 - 2009 shows Funnel Problems In Google Analytics as the top organic result. With a clear complexity problem, Hiten's team set out to redesign the process with digital marketers in mind:
"Before KISSmetrics, it took too much time for people to create and understand funnel reports. Our funnel reports became the industry standard that many analytics tools copied."
Hiten's team hit a number of home-run features in the company's first year — enabling profile-focused insights and building a 10x better debugger — but arguably the most important factor behind KISSmetrics' success was timing.
KISSmetrics offered the perfect solution for the cloud computing step change right as the first signs of the tidal wave of change were beginning to show. Log-file analytics and 'Page Views' were quickly replaced in the early 2010s by event analytics and funnel reports became the most important source of metrics. This change would dominate the web analytics category for the following 5 years.
Step Change 2: The Rise of The Mobile Consumer
Alas, KISSmetrics' head start as the leader of the web analytics category was short lived. By 2013, Mixpanel had stolen the top spot and KISSmetrics began fading away as an irrelevant alternative.
What enabled Mixpanel to overtake KISSmetrics as category leader? → Mobile analytics.
At the same time marketing-led growth was building steam in the B2B world, smartphones made the explosive leap from the corporate to consumer market in the late 2000s. Apple's dual launch of the iPhone and iPod Touch at the same time as the App Store unlocked a deluge of choice for a burgeoning population of consumer smartphone users.

^ Source: Statista, 2021
In an increasingly competitive mobile apps market, companies fought for ways to grab consumer attention in any way possible. The most successful tactic was to move the point of purchase further into the user journey — rather than an upfront payment, the App Store economy became heavily dependent on in-app purchases. 55% of new mobile apps listed on the App Store in Q1 2012 were free; by mid 2016 that number was 92%.

^ Source: Sensortower, 2016
Moving conversion deeper into the user journey impacted the web analytics category in many ways. Analytics tools now needed to track users and events across multiple sources (starting on social media or a landing page into actual product usage), in new mediums (desktop, mobile or a combo of both), and along increasingly complex paths (conversion became more related to key usage milestones than a predictable funnel of sequential steps).
Alternatives to KISSmetrics each picked one of these problems and built a better solution. Mixpanel and Amplitude focused on mobile-first analytics, Optimizely productized A/B testing for better downstream impact analysis, Heap's no-code solution made variable user journeys way easier to retroactively analyze.
Competitor by competitor, incremental improvement by incremental improvement, the web analytics category that KISSmetrics had redefined in 2009 was once again redefined. As data collection moved from landing pages into the deepest parts of products and apps, the web analytics category was itself given a justified rebrand to product analytics.
Step Change 3: The Empowered End-User
The consumers downloading free mobile apps on the weekend were often the same people that spent their mid-week working a 9-5 job.
As we moved into the late 2010s, an important behavioral gap began to grow — by day these people were dealing with shitty software products bought by their boss on annual lock-in contracts; by night these people were downloading apps for free and only getting their credit cards out when they reached a usage limit or built-in incentive that required them to upgrade.
The mobile app market had not only conditioned people to 'try before you buy', it had made people familiar with searching for and evaluating digital products independently. The easiest place to see this is in ecommerce, where a whopping 81% of 18-34 year olds in the US had an active Amazon Prime membership in June 2020.

^ Source: Statista, 2021
It's not ecommerce that created this step change though, it's Consumer SaaS.
Consumer SaaS normalizes the experience of paying for software outside of work on a subscription basis — particularly for people who don’t have buying power at the companies they work at.
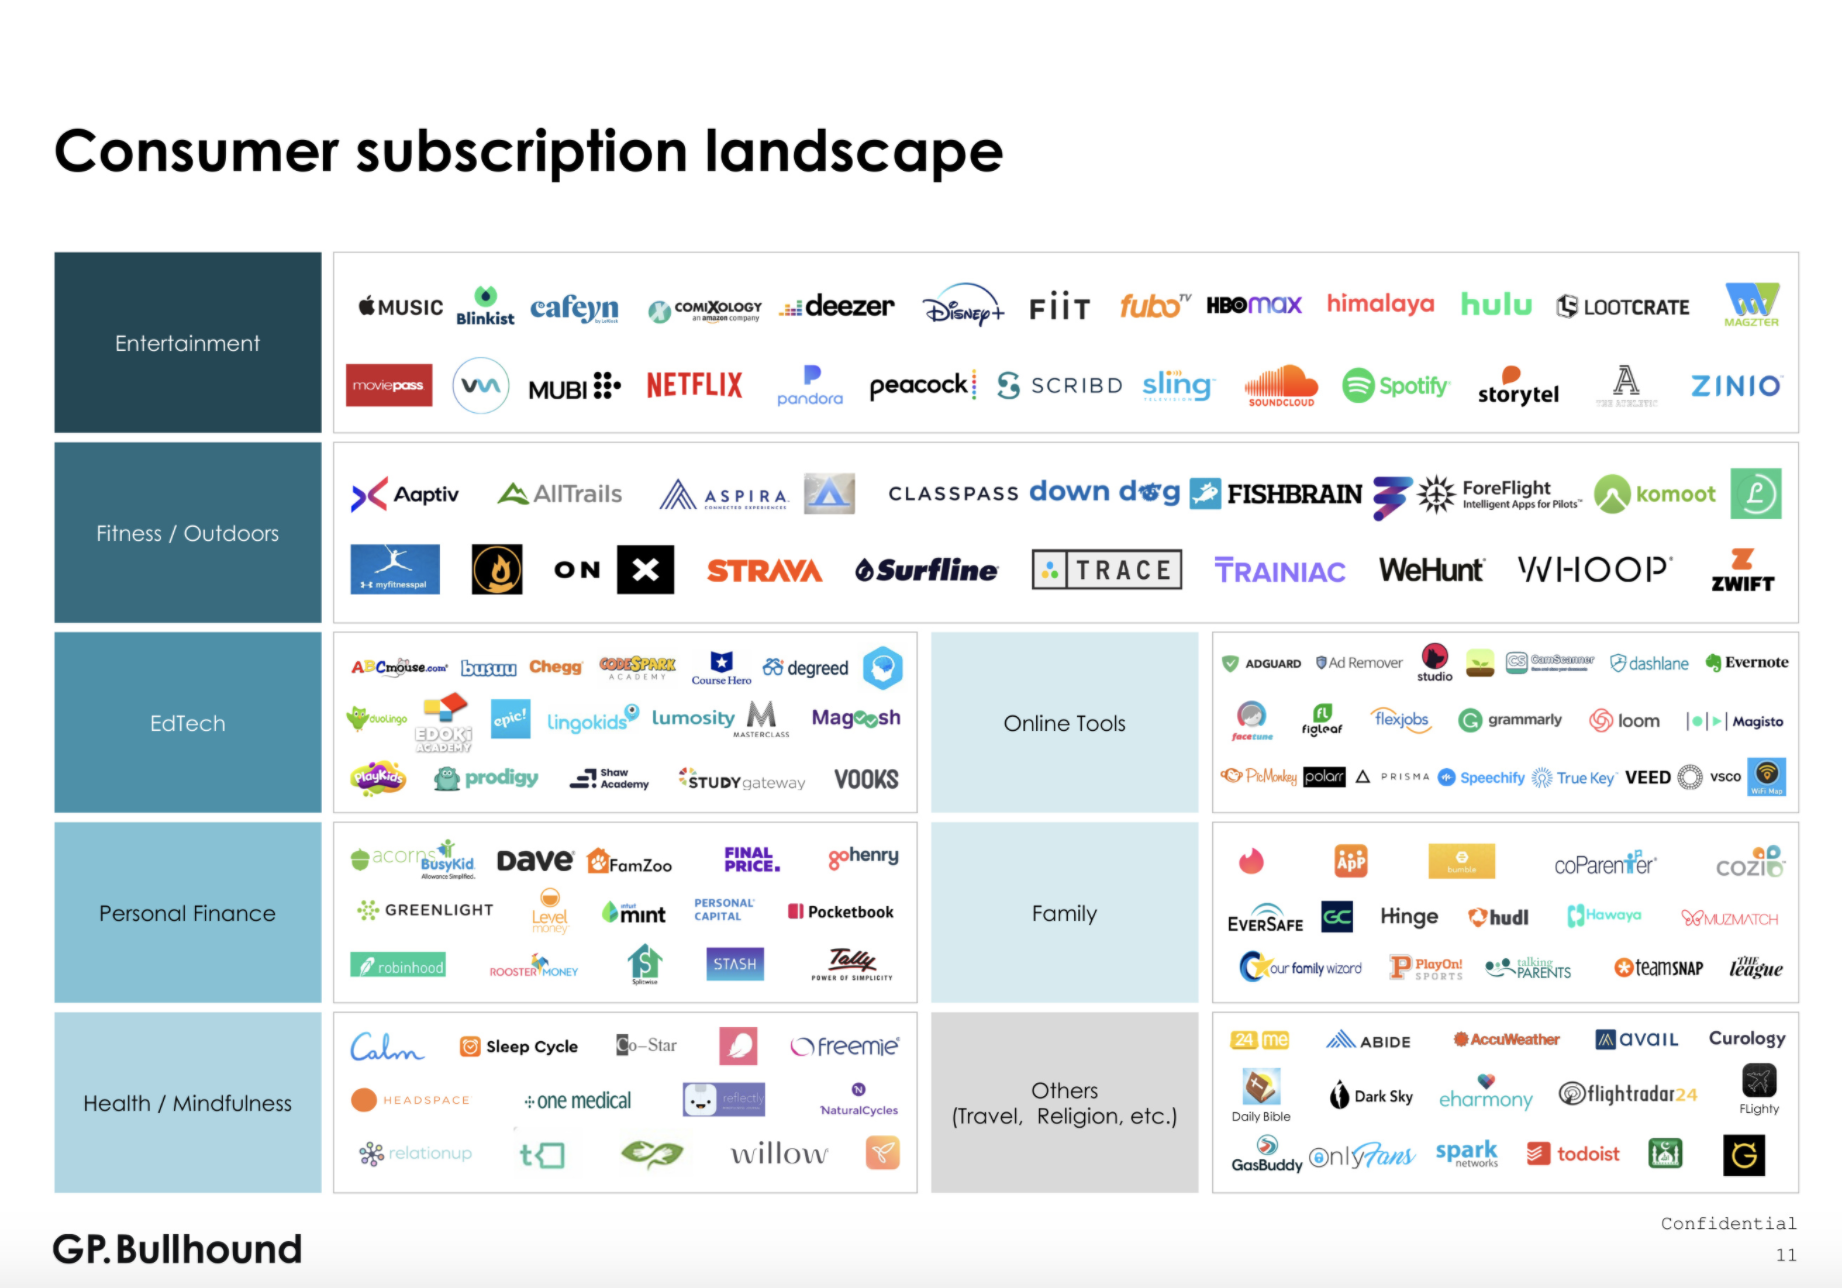
Graphic from Consumer Subscription Software Insights, September 2020 by GP.Bullhound
Imagine this example: Sam the Assistant Brand Manager in 2011 was never in a position to even consider paying for a new tool at work. But Jamie the Junior Product Manager in 2021 has premium subscriptions for Netflix, Amazon Prime, Strava, Spotify, Tinder, Calm, Grammarly, Canva and Robinhood (Jamie clearly still lives at home with their parents…). Does Jamie have the skills or experience to know how to evaluate whether a paid tool would improve their work or solve a frustrating problem they're dealing with? Of course.
So, in their personal lives, we've given people (1) the knowledge and skills to search out and pay for digital solutions to their biggest pains, (2) the expectation that they should be able to try a product before they buy it, and (3) an understanding that subscriptions reduce the upfront burden of paying for software products that have been expensive to build and maintain.
These factors — the emergence of the end-user who expects a frictionless self-serve onboarding and subscription by default — are the source of the most recent step change in the analytics category.
Recurring revenue requires recurring impact
Moving from a single sale to recurring revenue means we have to rethink the entire idea of a sales funnel.
The idea of a funnel is a set of steps that lead to a 'closing' event, like a prospect signing a contract and paying for the product. The funnel assumes that some leads will be lost at each step along the way, but that a subset of the leads you start with will successfully arrive at the all-important final step.

^ The traditional sales funnel. Source: Marketing Insider Group
But getting a user to make a once-off payment is not the primary objective for a product team with a recurring revenue model — their aim is to retain that customer every time the subscription is due to be renewed.
The 'V' shape of the funnel isn't even relevant anymore either. SaaS companies are not just measured by total revenue, they're compared using a metric called 'Net Revenue Retention Rate' (NRR). NRR is like adding up all the money you got from new customers that started a paid subscription in January 2021 and then seeing whether you're making more or less money from those same customers a year later in January 2022. A quick and easy example below to explain NRR further...
100 paying customers subscribe to your monthly SaaS product in January 2021 at $10/month, which gives you $1,000 in monthly recurring revenue (MRR).
By January 2022, only 90 customers remain (10% churn rate) but collectively those customers are now paying an average of $15/month (eg. some customers added extra seats to their workspaces, increasing their monthly bill), which leaves us with $1,350 MRR for the same cohort a year later.
This would give us an NRR score of 135%. For context, Slack had an NRR of 125% in Q2 2021. Here's a great article from Product Tranquility with a bunch of data on NRR benchmarks broken down by ACV, funding stage and more.
If the focus shifts from an initial purchase to increasing the value of an account over time so as to compensate for churned revenue, then our funnel should actually look a lot more like a bowtie.

Sales Bowtie graphic by Jacco van der Kooij, from Winning By Design
Bottom-Up = Emotional...
Most product-led startups use a bottom-up approach to acquire new customers.
Think of the hierarchy of a company mapped as a big triangle. A top-down approach would target the executive leaders at the top of the triangle who would distribute the product down through the company using their internal authority. A bottom-up approach focuses on the operational layers of employees at the bottom of the triangle. These employees will share the tool with their colleagues for status (being seen as ✨ the early adopter ✨ of a cool new tool) or functional reasons (needing a teammate to collaborate with you).
Choosing a top-down or bottom-up approach to product distribution is a fundamental ingredient in a company's overall strategy; it will go on to influence everything from the objectives of each team to the design of each function in the company (this is the topic of part two of this series, subscribe to get early access).
When a team uses a bottom-up approach, the person they are trying to acquire is the same person who will be using the product (aka the 'end-user'). Unlike the CEO, the end-user isn't comparing different products based on how they could boost company profits — they just want to solve an annoying problem they've been dealing with recently.
These two drivers of new product adoption are 'Rational Impact' (bottom-line profit) and 'Emotional Impact' (solving a burning pain point).

A bottom-up strategy typically uses emotional impact to acquire new users, but both emotional and rational impact need to be considered for the impact + growth flywheel.
Impact and Growth have an interlinked compounding relationship; the end-user is most likely to take actions that will grow the overall value of the account each time they achieve meaningful impact using the product.
There are five growth levers that can be achieved within an existing account: (1) status-driven internal referral, (2) usage-based expansion, (3) unlocking feature requirements, (4) functionally-driven internal referral, (5) enterprise sales. These five factors lie on a sliding scale from emotional impact to rational impact — the more a lever is driven by emotional impact, the less influence the traditional decision-maker (the VP or Head of X) has over the growth of the account.
Let's dig into each a little further:
Status-Driven Internal Referral
This is the lever most influenced by emotional impact. Imagine the end-user is close to tears because they have been so frustrated by X taking them 6 hours a week to do manually and then they discover your tool which automates the process of X down to 6 minutes a week.
If they know 10 other people in their company with the same problem, you bet they'll tell every one of them about your product. That referral costs them nothing, requires no management sign-off and earns them a whole bunch of social cred as the 'cool person who knows all the best new tech'.
Usage-Based Expansion
There are two types of usage-based expansion. Infrastructure products like Amazon AWS and Stripe earn more revenue the more you use them — that's not the growth I'm talking about here (it's a massive growth lever, but we're specifically looking at end-user impact here). Instead, this lever is most commonly about the organic discovery of additional use-cases.
Imagine the Account Manager who starts using Calendly to reduce the friction and time spent getting sales calls booked with their inbound leads. It works so well, that they share their Calendly link with their boss for finding time for their next quarterly review, they use it to organize a catch-up with the marketing team, they use it to figure out the most suitable time to throw the next Friday social event. It just worked so well, you want to use it for everything.
Unlocking Feature Requirements
Carrying on from the last example, that Account Manager is now using Calendly for a bunch of different use cases. The free version of Calendly only lets you use one event type though. Having a blanket approach of blocking 30-minutes off isn't ideal when those marketing team catchups are only 15 minutes while a quarterly review is 90 minutes long. But to have multiple event types, they'll have to upgrade to Calendly Essentials. This is where we start to move from emotional impact (makes me feel or look good, reduces stress) to rational impact (saves me time or money, improves output quality).
Functionally-Driven Internal Referral
Like 'Status-Driven Internal Referral', this lever is based on the end-user sharing your product with their colleagues, however it's driven more out of necessity than social credit. On Miro, you invite your colleagues because you need to capture their ideas on your brainstorming board. On Segment, you invite a developer to help you with integration. Adding these people may not initially create revenue growth, but it still drives the compounding growth cycle by starting the whole bowtie process again with a new batch of users.
Enterprise Sales
To scale the value of an account, some companies use a bottom-up strategy to attract multiple users within a team and then adopt a top-down outbound sales approach where they pitch the decision-maker responsible for that group of end-users. This approach is most useful when there is additional rational impact that can be unlocked by formalizing an enterprise contract, such as unlocking features that will improve the productivity of their collaboration or enable those users to generate additional value from the features available only to enterprise tier users.
What becomes clear as we map the beginning and end of this bowtie funnel is that understanding end-user needs is critical to acquiring, converting and growing customer account value when a company uses a bottom-up distribution strategy.
Introducing Priority Analytics
The empowerment of the end-user, the expectation of a self-service experience, the lack of friction for recurring revenue conversions — these are irreversible behavioral changes to how people buy products. Yet we still treat product analytics in almost the exact same way as we did 10 years ago.
Like the move from log-file analytics to event analytics in the late 2000s, we need to rethink the core data we’re trying to procure today. If this new customer journey is a self-serve experience powered by a segmented understanding of end-user needs, then our analytics should also be focused on the discovery, segmentation and measurement of end-user needs.
This is where priority analytics comes in.
Priority analytics is a quantitative form of user data like product analytics, except rather than focusing on user behavior (what they’re doing / the ‘what’), you focus on user priorities (what they’re thinking / the ‘why’).
The data produced by priority analytics serves every function and every step of the sales bowtie — understanding highest priority needs informs the positioning used to attract new users, the messaging used by sales teams, the segmentation of self-service onboarding, the rationale for picking certain referral methods.
Today, identifying the most important user needs is almost entirely a qualitative exercise. The gold standard is a handful of user interviews on Zoom and some messy Notion docs full of customer quotes. To build a world-class startup today, you need a robust, quantitative source of data on end-user needs that is as easy and reliable to set up as it was to create a funnel report on KISSmetrics back in 2009.
That’s our vision at OpinionX — to help companies to discover and rank their users’ priorities in minutes. Over 1,000 product and UX teams at companies like Instacart, Lucid and Canva already use OpinionX to better understand their users’ most important needs. Get started on OpinionX for free today.
This post is part one in a four-part series on Priority Analytics. Check out part two → The Guessing Gatekeeper.