
Gabor Granger Pricing Surveys on OpinionX (July 2026 Updates)
We’re expanding our range of pricing study methods available as part of our mission to make OpinionX the number one tool for in-house researchers to run advanced market research methods without needing any specialists to help them! The latest update includes a purpose-built Gabor Granger question type along with a bunch of additional platform fixes and improvements.

1. Gabor Granger Pricing Surveys
We've added Gabor Granger to the list of pricing research methods available on OpinionX! You'll find it under the Advanced section of the question type menu, alongside Conjoint Analysis, MaxDiff Analysis, and Van Westendorp (which we launched just two weeks ago).
Gabor Granger is a willingness-to-pay research method that helps you find the specific price that maximizes revenue for your product. Instead of asking respondents to name a price (which they're bad at, since they'll strategically lowball or pluck a round number out of thin air), Gabor Granger shows each participant a specific price and asks a simple yes/no: would you buy at this price? Then it does it again at a different price in the direction they indicated. From those yes/no answers, OpinionX automatically builds a picture of exactly how much of your market is willing to pay at every price point you tested.
It's a great fit when you already have a rough sense of your pricing range and want to find the specific number inside that range that maximizes revenue. It’s a flexible research method that works for one-time purchases and subscriptions alike, products and services, and more.
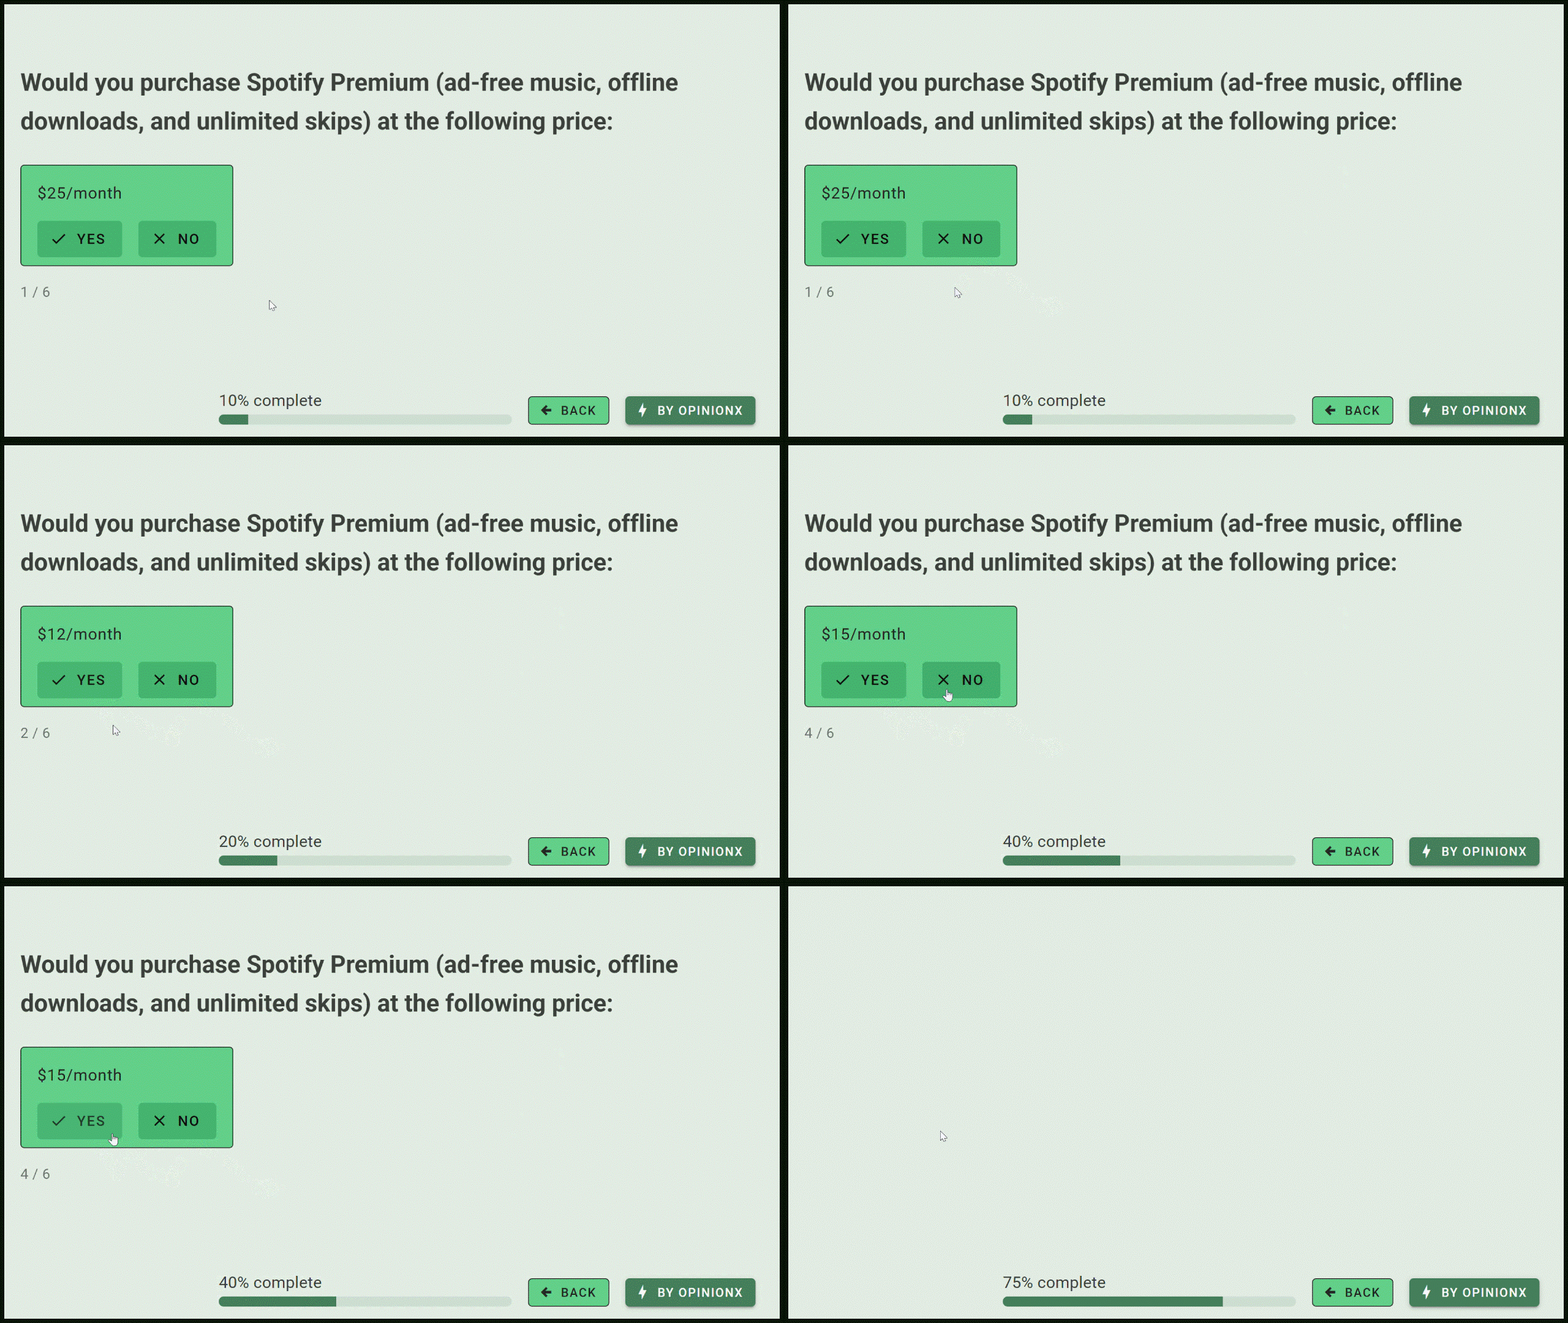
Screen recording of the participant voting experience on a Gabor Granger survey hosted on OpinionX
The most efficient Gabor Granger tool on the internet
Every other survey tool that offers Gabor Granger uses either sequential ordering (go up one price point after a 'yes' vote, down one price point after a 'no' vote) or randomized ordering (jump to a random price within the remaining range) to decide which price to show a participant next. Both of these are very inefficient: a participant might need to answer 15+ questions just to identify their willingness to pay.
OpinionX uses a smart, efficient approach instead called binary search. After each vote, we send the participant to the midpoint of their remaining possible prices, cutting the search space in half every time. That means:
A Gabor Granger survey with 15 potential prices resolves in a maximum of 5 questions per participant.
A survey with 100 potential prices results up to just 8 votes at most per participant.
A survey with 1,000 potential prices results up to just 11 votes at most per participant.
The math is logarithmic, which is the technical way of saying "you can test way more prices without burning through respondents' patience." This is just one of the many ways we’ve paid extra attention to detail when building this Gabor Granger question type. On many survey platforms, Gabor Granger is just a templated mess of branching logic between a bunch of separate question blocks. On OpinionX, we’ve put everything neatly inside a purpose-built method, automated in every way possible, made extra efficient, and optimized for mobile and touchscreen respondents.
These details make OpinionX the most efficient and smoothest Gabor Granger tool available on the internet, helping you get more precise pricing data with fewer questions per participant. And the best part is that Gabor Granger surveys are available on OpinionX’s free plan!
Middle-third randomized starting price
The first price a person sees in a Gabor Granger survey acts as an anchor that colors every answer after it, so if everyone starts at the same price, anchoring bias is baked uniformly into your results with no way to detect or correct it.
OpinionX uses a different approach, where the first price each participant sees is drawn randomly from the middle third of your price range. By spreading the starting price across a range of values, anchoring noise averages out across your sample instead of shifting your whole demand curve in one direction. This 'middle third' setting is always on and there's no toggle to disable it, because it makes your data meaningfully more reliable at zero cost to the participant experience.
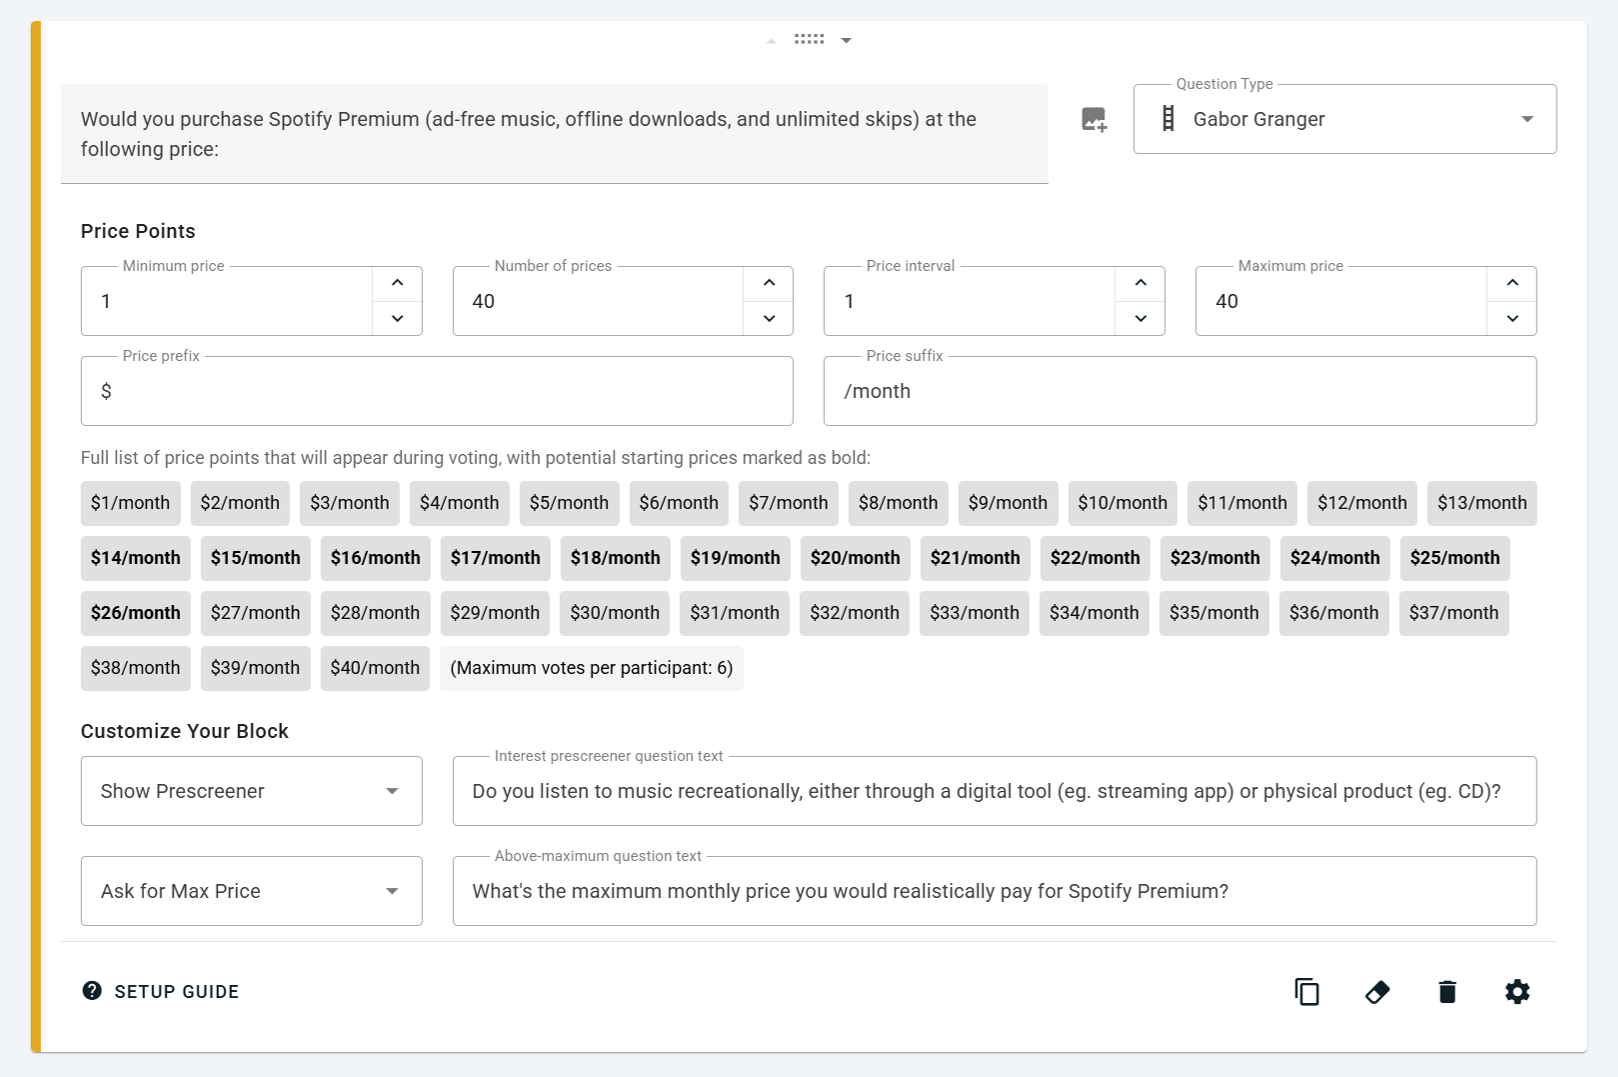
Screenshot of OpinionX’s survey setup screen when configuring a Gabor Granger survey
The Optimal Price chart
Every Gabor Granger survey produces one main chart on the results dashboard, showing two lines:
Demand (blue, right axis, %) → the share of your market willing to buy your offering at each price point.
Average revenue per target customer (orange, left axis, currency) → price × demand at each price, averaged across all survey respondents.
The 'average revenue' line is typically a bump-shaped curve. The top of the bump shows you the key insight from a Gabor Granger survey — the Optimal Price which produces the most revenue overall.
Above the chart, you'll see four boxes that summarize your results:
Optimal Price → The price at the peak of the average revenue curve.
Not Interested → The percentage of participants who opted out via the interest prescreener at the start of the Gabor Granger section.
All Rejected → The percentage who said 'no' to every price they were offered, including the minimum price you chose.
No Ceiling → The percentage who said 'yes' to every price, including the highest option.

Segmentation and comparison
Gabor Granger works with OpinionX's full segmentation analysis engine — you can filter your results, compare two groups side by side using the Compare Tab, or generate a crosstab of loads of segments using the Segments Tab to spot which customer types will pay way more or much less than everyone else.
For a full walkthrough of everything covered above, including setup instructions and analysis tips, check out our Gabor Granger knowledge base article. If you're looking for a beginner's guide to the Gabor Granger method itself, we've also written a guide to Gabor Granger for pricing research on our blog.
👆 Try it for yourself! Vote in the embedded Gabor Granger sample survey above and then see the interactive results page afterwards :)
— — —
2. Other Updates
There were a bunch of other changes included in this second batch of July 2026 updates:
Hide Back Button → New toggle on your survey settings page that hides the 'Back' button from participants across your entire survey. Useful when you want to prevent respondents from reviewing or changing earlier answers, particularly on research studies where order effects, first-instinct answers matter for data quality, or advanced branching logic exposes sensitive routes through the survey when people retreat and revote.
Van Westendorp Auto-Translation → OpinionX's multi-language auto-translate feature now covers the price prefix and price suffix text on Van Westendorp blocks too, so if you're running a Van Westendorp survey in multiple languages, currency symbols and unit labels like per month or /seat translate alongside your question text automatically.
Van Westendorp Branching → You can now configure conditional branching logic on OpinionX using Van Westendorp answers, including conditions like "greater than or equal to [price] for [Q1-4 of the VW block]". This means you can route participants to different follow-up questions based on how price-sensitive their Van Westendorp answers show them to be — for example, sending everyone with a Costly answer above $50 to a specific product comparison question, or excluding participants whose Marginal Cheapness is above your Optimal Price.
Conjoint Empty State → We've updated the prefilled text when a Conjoint Analysis block is added to your survey so that the setup is clearer, especially for new users who are running their first conjoint study.
MaxDiff Simulator Preview Image → Added a preview image of the MaxDiff Scenario Simulator to the MaxDiff 'Change Chart Type' modal, so you can see what the simulator looks like before switching to it.
MaxDiff Simulator Sample Size → Moved the sample size count on the MaxDiff simulator into a column header position, making it easier to see how many participants each simulated scenario is drawing from at a glance.
{Block} Templates → Renamed the 'Design Inspiration' component that shows one-click templates on the empty-state version of every survey block to '{Block Name} Templates' to make the feature's purpose more obvious for users setting up a new block for the first time.
Random Split Component Width → Fixed formatting issues on the Random Split component in branching logic that were affecting users on smaller screens.
Cancellation Email for Workspace Admins → We now automatically email all workspace admins to let them know when their workspace subscription renewal is changed to 'cancelled', so no one gets caught out by an unexpected end of billing.