
Marginal Willingness To Pay (Conjoint Analysis) 🫰
'Marginal Willingness To Pay' is a new advanced chart for Profile Rank (conjoint analysis), available to all premium-tier customers on OpinionX ⚡
This one requires a few quick explainers:
The block type "Profile Rank" on OpinionX is a conjoint analysis survey method. Unlike the other ranking methods where each option is independent, a conjoint analysis survey is ranking two things at the same time — a list of categories (eg. brand, price, size) and a list of options within each category (eg. small, medium, large, XL for the "size" category).
Profile Rank comes with a bunch of advanced charts that automatically turn your conjoint data into useful reports, such as a scenario simulator, preference chart, and ranked concepts list.
If one of the categories in your Profile Rank block is price, then OpinionX will use the preference scores that survey participants gave to each price point to calculate a financial value that participants associate with each feature based on each option's relative importance score.
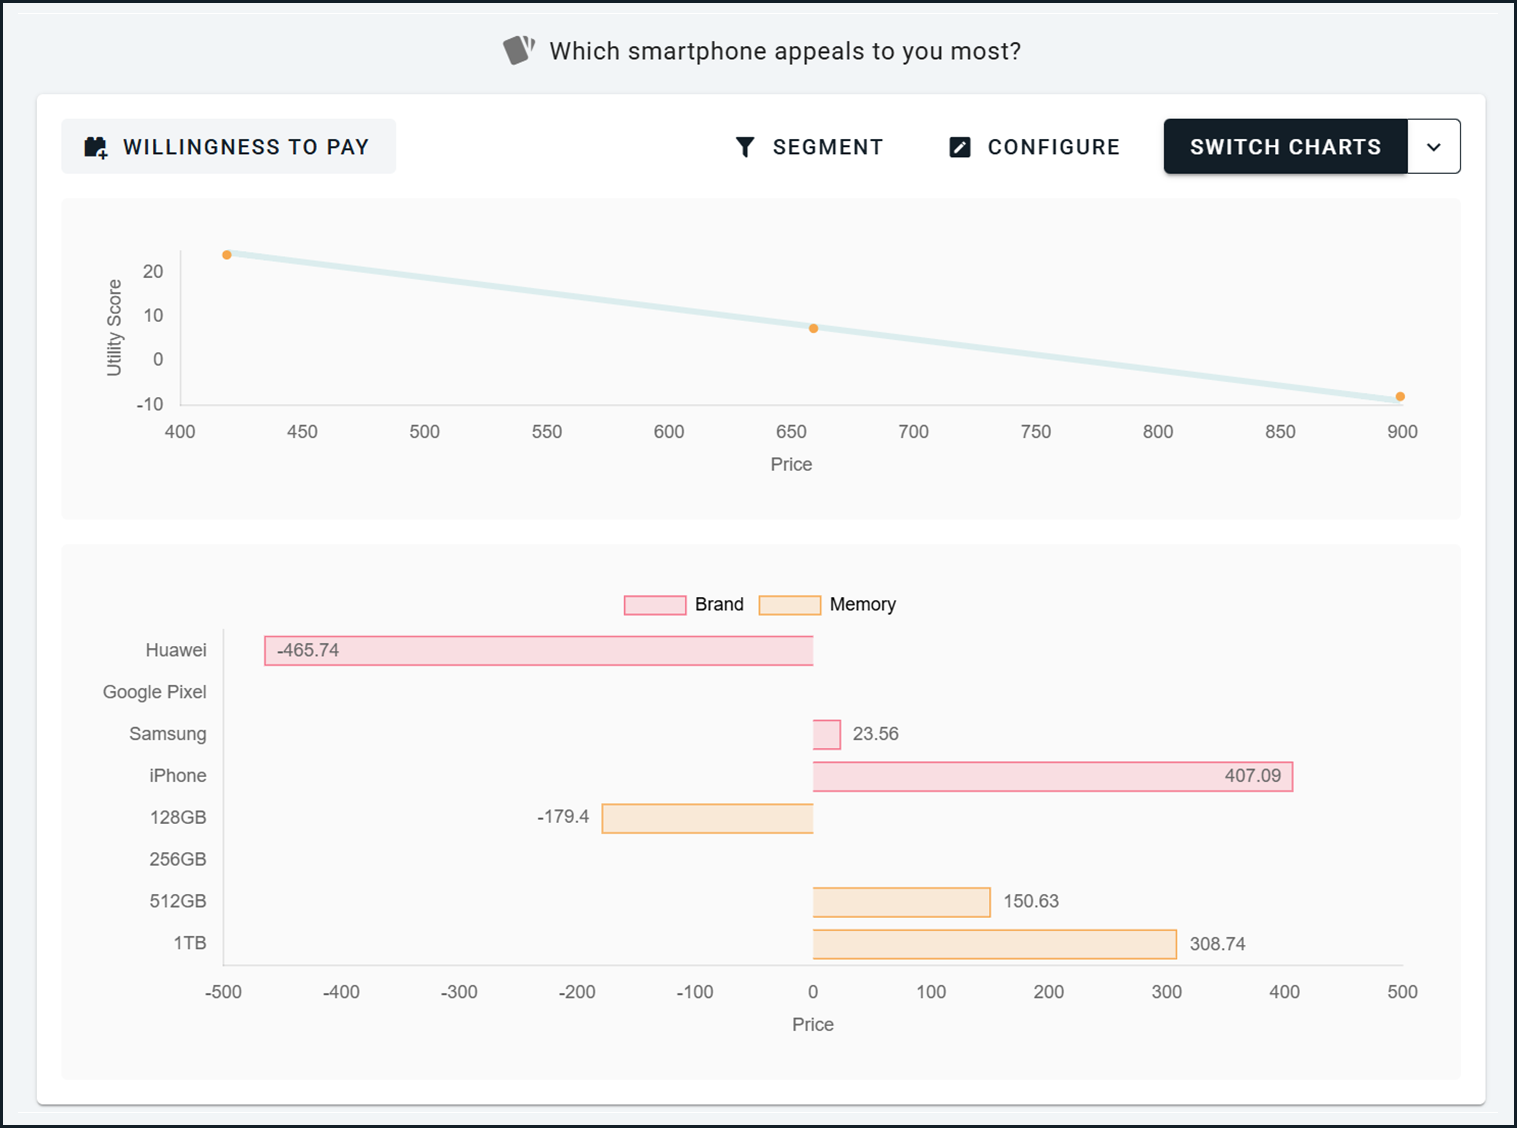
The "Marginal Willingness To Pay" report tells you how much a customer would pay to upgrade one specific feature of a product to a different option (eg. from size "small" to "large").
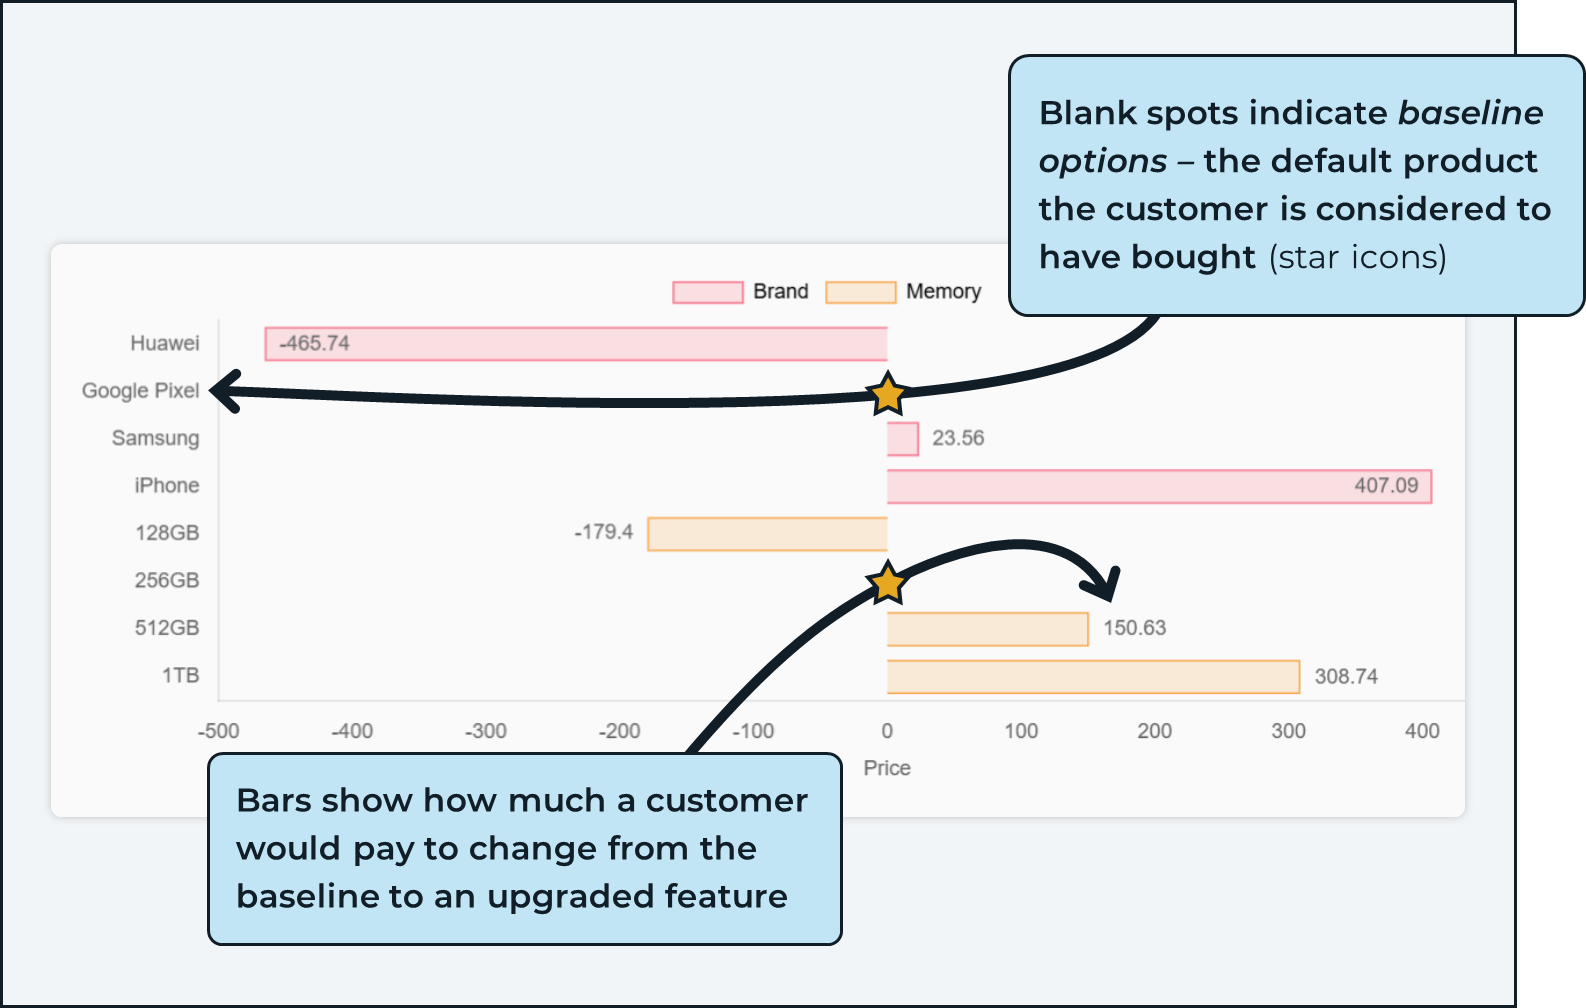
In the screenshot example, the "baseline product" is a Google Pixel smartphone with 256GB of storage, and it shows us that respondents would pay $150 extra to upgrade to a Google Pixel with 512GB of storage. Here's how you can read that from the chart:
How are these numbers calculated from the pricing data? That's where the line chart comes in...
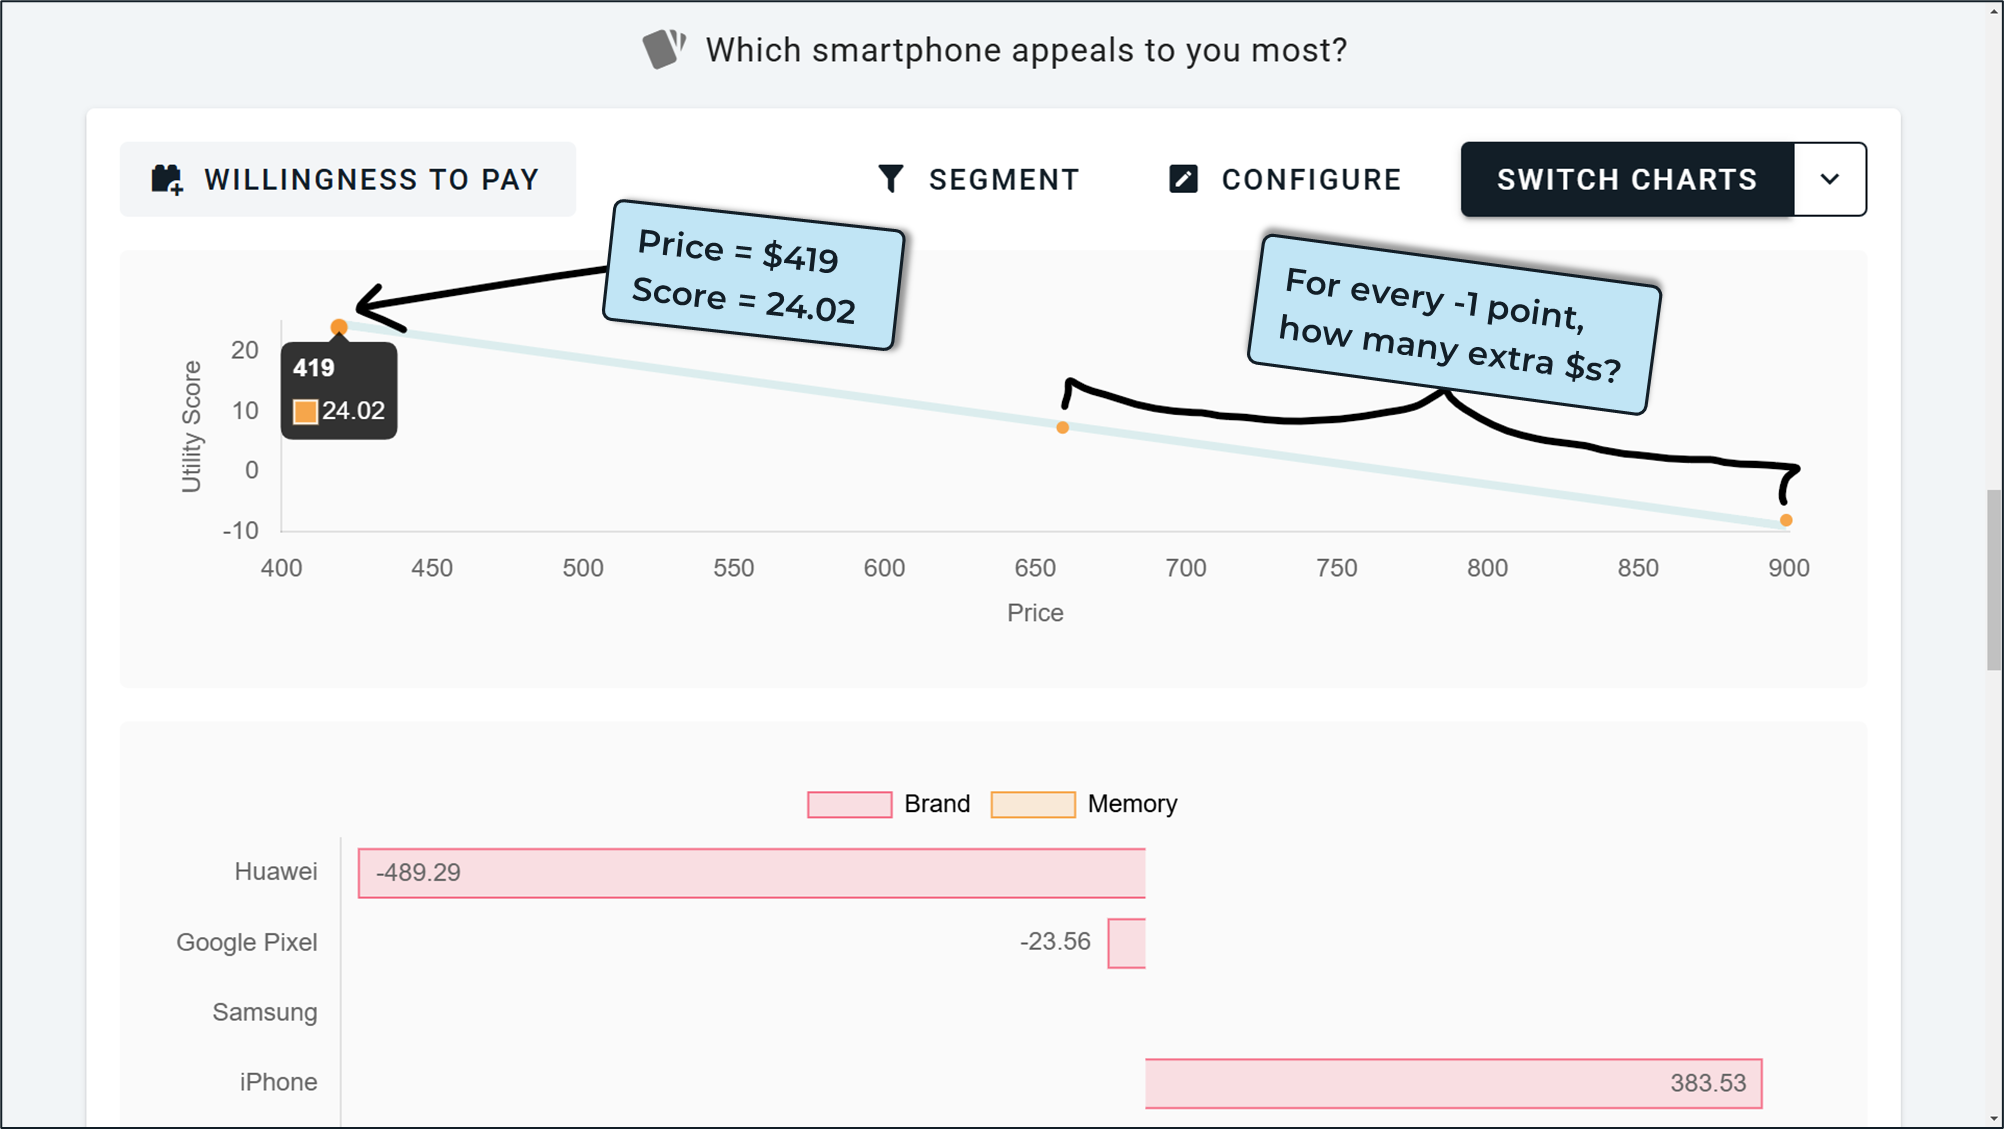
This line chart shows price points from the survey on the x-axis and preference scores on the y-axis. Each point is a specific price from the survey (eg. $419 had a preference score of 24.02). A trendline is plotted between these prices and that is used to calculate the marginal utility per dollar, which basically means "how many extra dollars on the price results in -1 point on the preference score".
By looking at the score difference between options (256GB vs 512GB storage), we can use this marginal utility per dollar to calculate the financial value customers associate with upgrading here.
When viewing this chart, you can change which option in each category is considered the "baseline" by either (a) clicking a new bar on the bar chart to make that option the new baseline, or (b) using the Configure button at the top of the chart. The Configure window also shows some important data about the trendline used as the basis of the financial calculations.