
What is Psychographic Segmentation [Guide & Examples]
Psychographic segmentation is a research method that identifies groups of customers with a similar way of thinking about a specific topic or issue.
A lot of what’s written online about psychographic customer segmentation makes it seem like a complicated and overwhelming task, but this is not the case. I’ve been helping teams do this research for 3+ years and can confirm that psychographic segmentation is actually quite simple. Here’s my approach along with some real-life examples…

What is psychographic segmentation?
There are three ways you can segment customers:
Descriptive → who they are
Behavioral → what they’re doing
Psychographic → why they’re doing it
Descriptive segmentation uses things like demographics (age, gender, job title), firmographics (company size, industry), and geographics (country, language) to create customer ‘personas’ that describe what a target customer looks like.
Behavioral segmentation uses existing customer data from sources like a product analytics platform (pages visited, time on page), payment history (average spend, purchase frequency), or attribution data (acquisition channel, cost of acquisition) to identify which types of existing customers produce the best outcomes for your business.
Psychographic segmentation uses data about people’s needs, pains and desires to identify groups of people that think similarly about a topic. It seems difficult primarily because teams often don’t know what psychographic data is or how to collect it.

How do I gather psychographic data?
It’s widely agreed that psychographic factors (people’s needs, pains and desires) are what actually drive customers to behave the way they do. Most guides to psychographic segmentation use very vague instructions like “run a survey” or “interview customers” as methods to collect psychographic data because they’ve likely never run a study like this and don’t know what else to say!
First, what is not considered psychographic data?
Generic customer personas named after broad interests like “Eco Warrior” or “The Explorer”.
Demographic personas that assume all “marketing managers” care about the same stuff.
A handful of customer interviews and the interesting quotes mentioned during them.
To create a proper segmentation plan, we need real quantitative data about the triggers that drive people’s behavior. That means we’ve got to figure out two things:
What are the triggers that drive customer behavior?
How do you measure these triggers quantitatively?
Psychographic Levers
Another mistake that many guides to psychographic segmentation perpetuate is that the best data for this kind of research is a personality test that measures things like ‘introversion vs extroversion’. Knowing whether your customer is an introvert or extrovert is unlikely to help you sell a product like B2B software!
Instead, we focus on the triggers that cause someone to search for a new product, buy that product, and continue using it over a long period of time. These are called psychographic levers. Here are some of the most commonly used ones…
Positive Levers
💰 Value — what’s worth most to them
❤️🔥 Motivation — what’s their biggest driver of action
🏆 Preference — what do they like most
Negative Levers
🤕 Pain — what’s their biggest unmet need
🚧 Friction — what’s their biggest barrier to action
⚠️ Risk — what concerns them most
If we can figure out what someone’s main driver is within one of these levers — for example, the pain point that they’re most urgently trying to solve — then we can see what similarities people who all care about that pain point share. This leads us to our second ingredient; measurement.
Measuring Psychographics
If you’re trying to behaviorally segment customers, you can rely on existing data from your product analytics tool or your payments platform. That’s not the case for psychographic segmentation!
Things like customer motivation or friction are intangible — they can’t be directly measured on a well-defined scale. So we need a way to turn these intangible factors into quantified data. That’s where discrete-choice modeling comes in.
Discrete-choice modeling is a category of research methods that uses comparison-based decisions to measure the relative importance of a set of options. It creates a series of choices and tracks which ones the participant picks to figure out what is important to them.
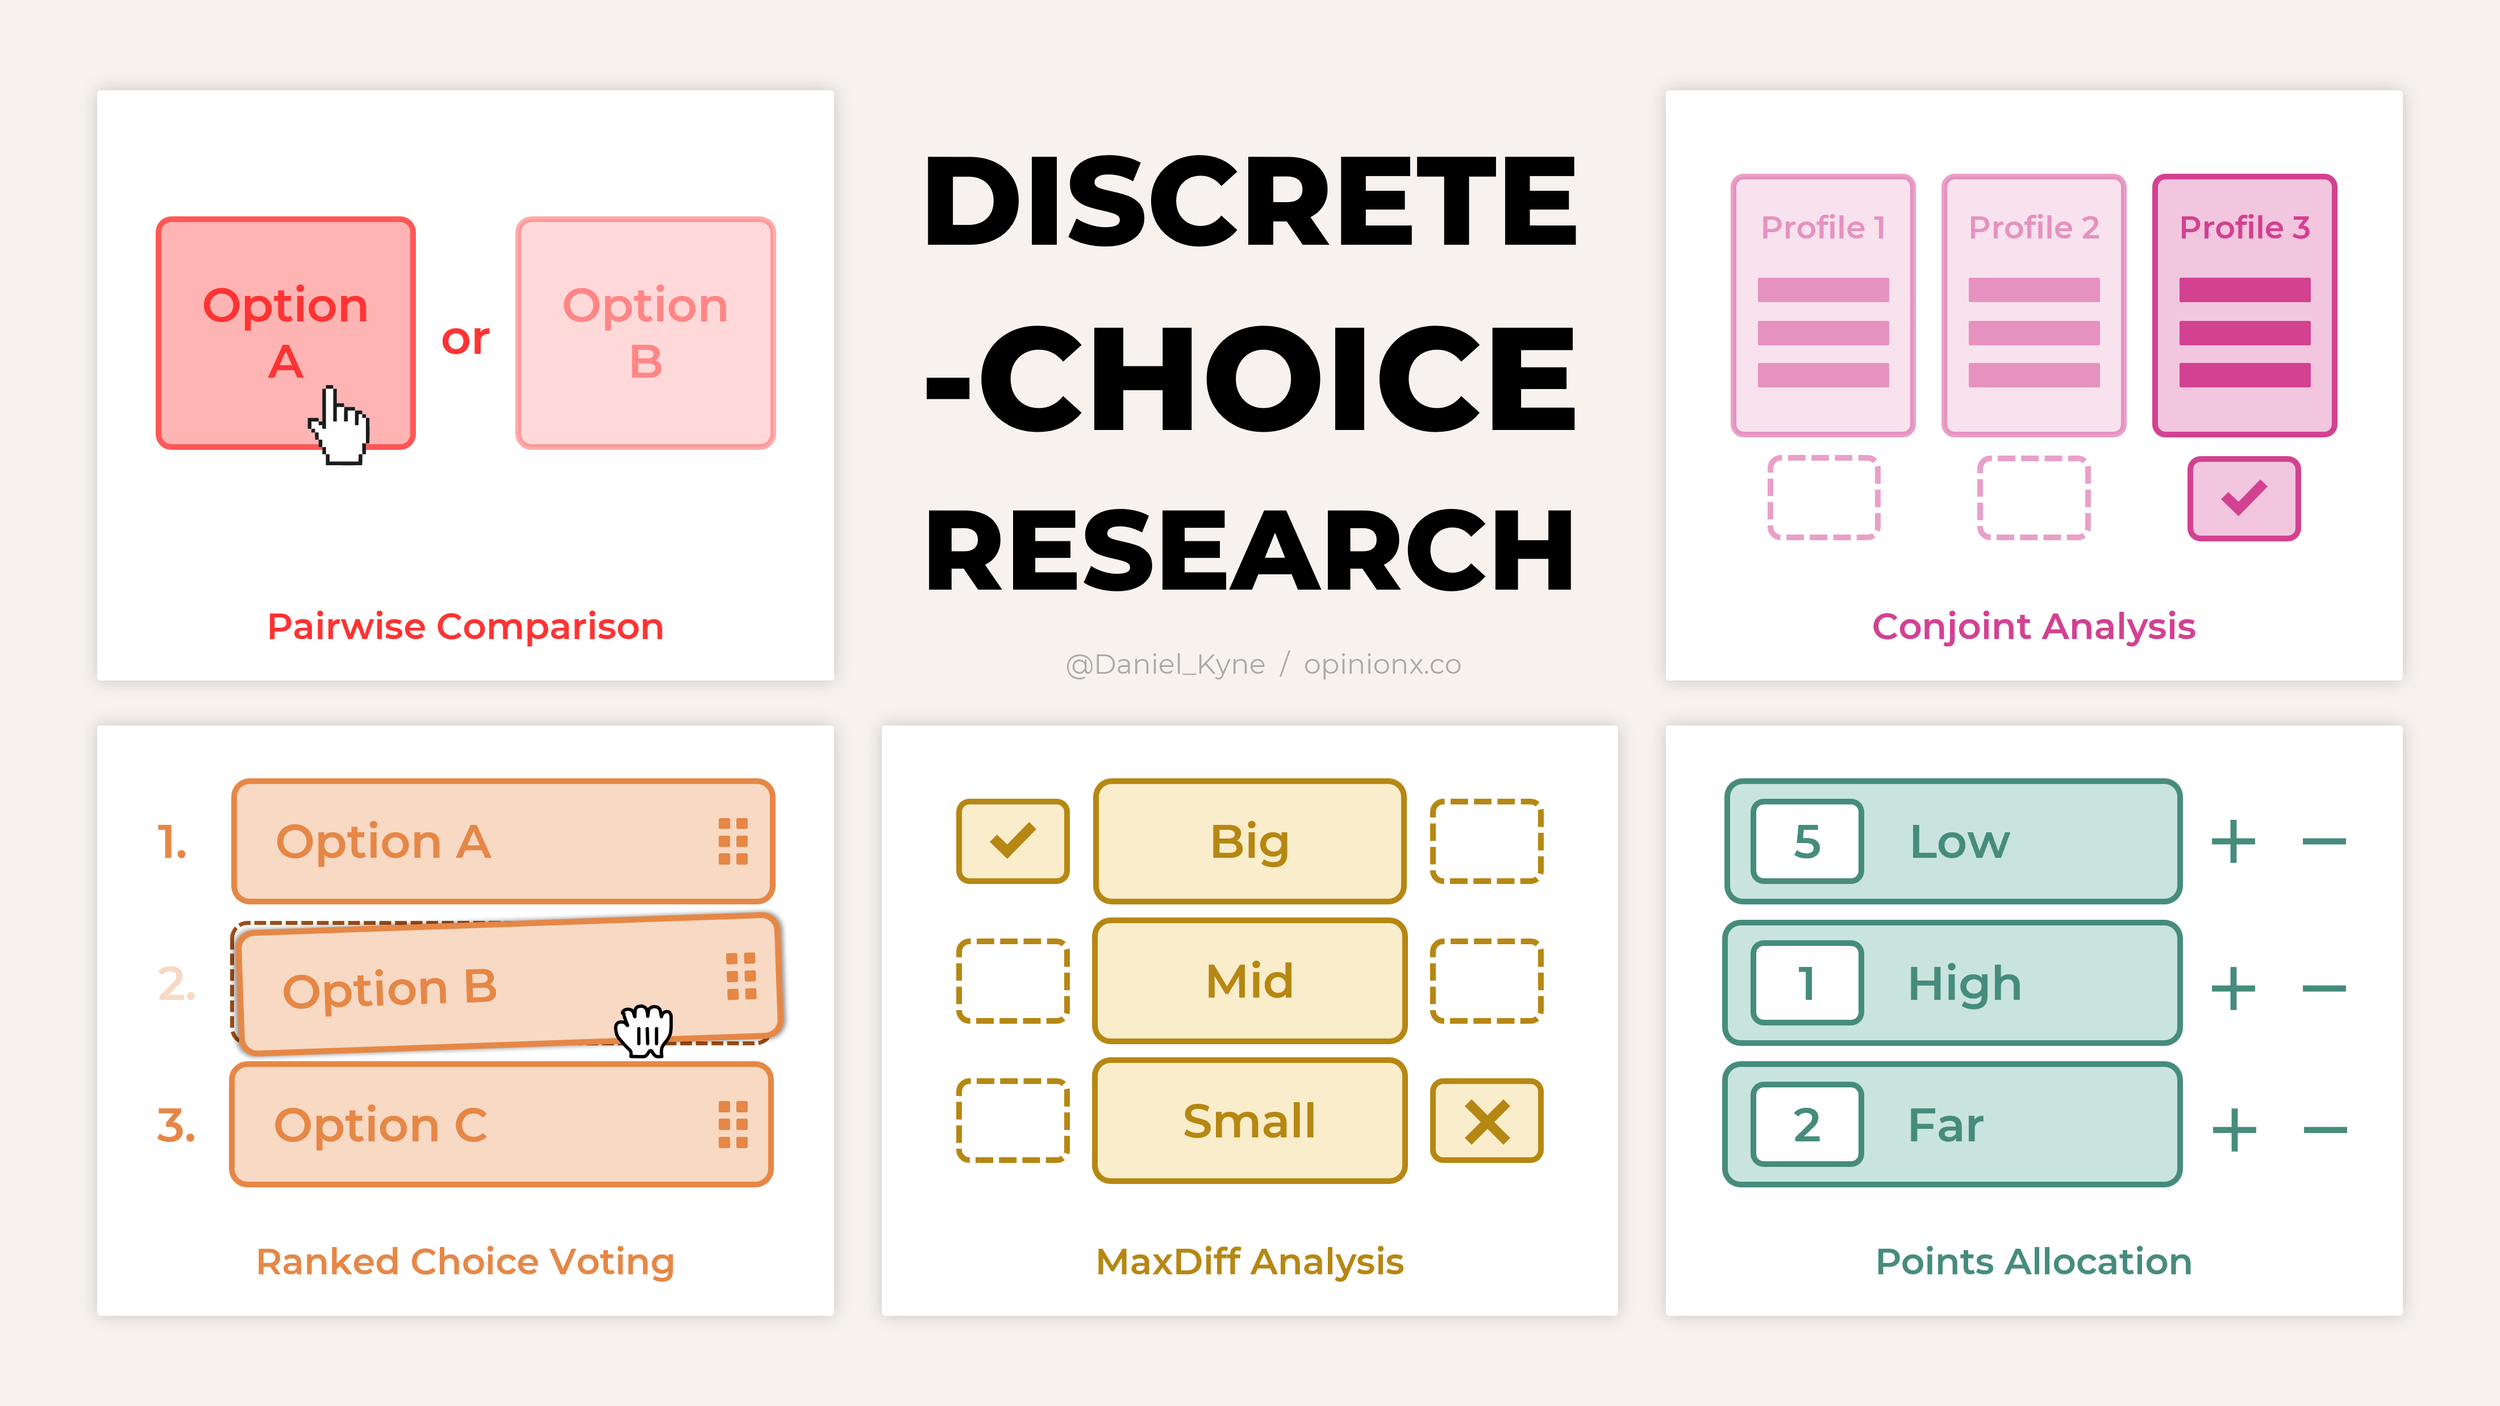
There are a bunch of different discrete-choice survey formats you can pick from for this research. Here are some popular formats, starting with the easiest to use…
Discrete-Choice Survey Methods
Ranked Choice Voting — put the list of options in order based on your personal preferences.
Points Allocation — distribute a pool of points according to your personal preferences.
Pairwise Comparison — shows two options at a time in a series of head-to-head votes.
MaxDiff Analysis — pick the best and worst options from a list of 3-6 choices.
Conjoint Analysis — pick the best ‘profile’ (made up of a series of category-based variables) to identify the most important category and the ranked order of variables within each category.
Step-By-Step Guide To Psychographic Customer Segmentation
Now that we know what psychographic data is and the methods we can use to measure it, let’s move on to the actual research process. These are the six steps I follow when designing a psychographic customer segmentation study:
Topic — what is the context or focus of your research?
Audience — who is participating in the research?
Lever — what lens are you viewing that topic through?
Options — what is your set of options for them to consider?
Format — what research method are you using?
Identifiers — what identifying data will you collect/import?
Let’s break each one down in more detail along with a running example…
1. Topic
To understand the differences and similarities in how a group of people think, we first need to set a common frame of reference for everybody. For customer segmentation, that reference might be an entire market category, it might be a specific scenario, it might be their experience of your product.
Example: People searching for a better CRM.
2. Audience
Who will take part in your research? You can engage existing customers, new leads who know what you do but haven’t tried your product yet, or complete “blank slate” participants from a research recruitment provider.
Example: My existing customers.
3. Lever
Which psychographic lever are we interested in? If my objective is to improve conversion, I might look at “value” to understand what drives people to convert to a paid plan. If I’m trying to acquire new users, I can look at “pains” to understand why they’re searching the market for a product.
Example: Pains.
4. Options
Discrete-choice surveys require respondents to compare options and pick the ones that are most important to them. That means we need a list of options. If I was using the “pain” lever, I would write a list of problem statements. For the “value” lever, I can use a list of features, or value statements about what the product enables for customers.
Example: Problem statements about their past solution’s shortcomings.
5. Format
I have a few tips for picking from the list of discrete-choice survey formats. Ranked Choice Voting is quick and easy for very short lists (3-6 options), but any longer is not fit for purpose. Beyond 6 options, I prefer Pairwise Comparison for keeping things simple for the participant, being a reliable simulation of how real-life decisions are made (binary choices), and for producing easy-to-understand data. For highly-considered purchases, I like Points Allocation — it allows people to tap into the conscious reasons that drove their behavior and show clearly the influence each option had towards their end decision.
Example: Pairwise Comparison (directly ranking problem statements is not easy for people!)
6. Segmentation
The voting data from this survey will let us rank the list of options, but it won’t tell us anything about who cares most about which problems. To do that, we’ll need some descriptive or behavioral data to associate against each participant. Once we have that, we can see what the ranked results look like when we look at just one segment (like filtering to show only our highest-paying customers).
Example: I’ll include some multiple-choice questions asking which pricing tier the customer is on and what department they work in.
Putting All 6 Steps Together
Most survey tools offer some basic ranking methods, like drag-and-drop ranked choice voting, so you can follow these steps in any survey tool you’d like. OpinionX is purpose-built for customer ranking and segmentation research, so it comes with all the question formats and analysis types you need to complete a psychographic study. Create a free segmentation study on OpinionX today.
Displaying Psychographic Segmentation Results
The best way to display your segmentation results is via a segmentation matrix, which displays all the ranking options participants voted on as rows, and each profile-based datapoint as a column. I generally create two versions — one with the average score of each segment and a second one with the score difference.
1. Segment Score
The average score shows the relative importance of each ranking option when including only people from that segment (for example, looking only at customers on the “Enterprise” pricing plan).
2. Score Change
The Score Change matrix visually shows how an individual segment’s score for a specific option compares to how all other participants scored that same option. It helps you to identify topics where a segment diverges from the rest of your participant population.
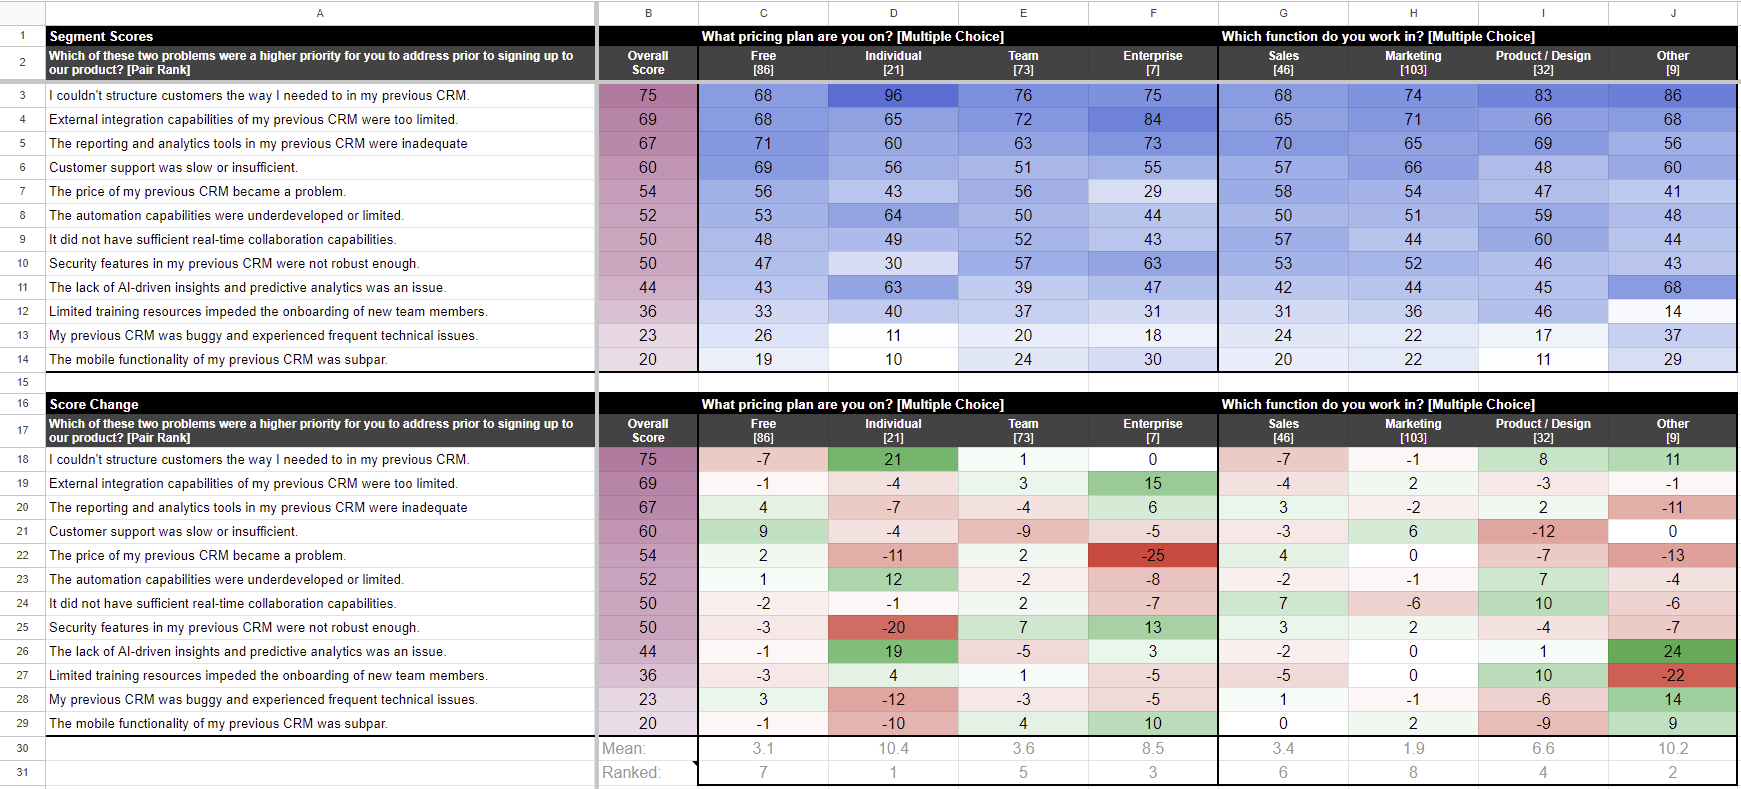
The results in the screenshot above show that almost all customers on the “Individual” plan struggled with restrictions in their previous CRM tool related to customer structuring (96% of them picked this statement during pair voting of the 12 problem statements).
OpinionX has built-in filtering and comparison views that let you segment your ranked results without needing to export everything to an external spreadsheet. You can activate a filter as easily as just clicking any answer from a multiple-choice bar chart. Here’s an example:
Tips For Psychographic Customer Segmentation
1. The more descriptive datapoints, the better
The big mistake people make in psychographic segmentation is prescribing the demographic or firmographic segments up front by only including a tiny selection of each. There’s a big risk made by picking too few datapoints — you may pick a category of data that shows no clear difference in priorities between segments. For example, you may assume that segmenting by department (sales vs marketing vs design) will obviously show big differences in preferences, only to later realize that these users all pick your product for the same reason and their priorities actually differ based on industry, company size, or geography. It’s better to have too much data than too little.
2. Customer segments will change over time
As you ship new features, expand into new use cases, or have new competitors launch in your market, the way your customers think about their problems or interpret your product’s value changes. Refreshing your psychographic segmentation at least once per year is necessary to ensure that your insights are up-to-date and relevant.
3. Qualitative research comes first
Psychographic studies using discrete-choice modeling product quantitative data (numerical results). To build a good discrete-choice survey in the first place, you need to understand the range of options that participants would expect to consider within your range of options. The only way this can be accomplished is through qualitative research. Conducting continuous user interviews is the gold standard, but a solid batch of one-off interviews before launching your study will also work. Alternatively, you can include a text-response question in your survey and add new ranking options to the list as you go — relying on early participants to “plug the gaps” in your ranking list.
Real-Life Example of Psychographic Customer Segmentation
Thousands of gyms around the world, from small family studios to national franchises, use Glofox to schedule their classes, manage memberships, track attendance rates, automate payments, and more.

Francisco Ribeiro, a Product Manager at Glofox, was working on a new feature for Glofox during the summer of 2021 and had already conducted a bunch of user interviews to understand the customer need that this new feature would address. But there was a problem; Francisco couldn’t spot a clear pattern in the needs that customers were talking about during these interviews.
In one interview, a customer would complain about not being able to track engagement with their members and then the next interviewee would say that they have no problem tracking engagement, but that their main challenge was knowing whether members were churning or not.
When we first talked to Francisco, he was taking a step back and had recognized that he was dealing with some frustrating inconsistencies. He decided to run a quick psychographic study on OpinionX to measure which needs were felt strongest by customers. By the end of that same week, Francisco had figured out the cause of his confusion — the size of the customer determined the highest-ranked problem!
Using OpinionX to get customers to rank their needs, Francisco split up the results based on the size of the customer’s gym operations. Francisco then calculated Glofox’s bottom-line financial impact for each segment’s highest-ranked problem to understand which one to focus on solving first. With this information on hand, he was able to inform his roadmap prioritization with real data and could easily explain his rationale to the rest of his team.
Use Cases for Psychographic Segmentation
Psychographic segmentation is relevant to every team in a company. By better understanding the needs, pains and motivations driving your customers’ behavior, you can be better placed to proactively serve them the solutions and support they need.
Product
Prioritize your roadmap by measuring the importance of a list of product-specific problems and splitting the results out by customer segment, allowing you to focus on the problems affecting your most important segments.
User Research
Conducting an annual customer segmentation study helps user research teams align the various internal departments around a common understanding of who the customer is and what they care about. Getting this locked in at the start of each year sharpens up the definition of the Ideal Customer Profile and serves as the foundational research that informs every team’s strategy for the following 12 months.
Marketing
Software buying today is focused on problem/solution fit — target customers have a problem they’re looking to address, and they’re evaluating your product as a potential solution. Understanding the most common problems your product addresses for customers is table stakes these days. To truly stand out, you need to figure out which questions to ask during onboarding or lead capture that identify exactly which problem each new user is trying to address.
Sales
The adoption of LLM-based AI tools means that people’s inboxes are full of half-assed personalized emails. Everyone can now write outbound sales emails that are tailored to who you are and what company you work for. But being able to predictively map target accounts to specific pains or an understanding of their perception of value will give you a new advantage in an increasingly competitive market.
Strategy
According to Patrick Campbell, founder of ProfitWell, teams should be updating their pricing every six months. How do you figure out which features or offerings are best at converting or expanding accounts? Do you have features with low adoption rate but a high perceived importance within a subset of users? In both of these cases, a value-adoption study will give you the exact data you need to improve your pricing strategy.
Design
As the Glofox story explained above, it’s not uncommon to find yourself deep in feature delivery when you realize that you don’t really know what pain, friction or risk you’re addressing or which customer you’re building it for. Running rapid assumption tests using discrete-choice survey methods and segmenting your results to compare by customer type can give you the data you need to deliver a better feature faster, all in just a matter of hours/days.
Founding Team
Too often, founders validate that customers experience a problem without figuring out whether that problem is a high priority for those customers to solve. This approach, coined “Customer Problem Stack Ranking” by Shreyas Doshi, is a core framework today for validating new product or feature ideas.
OpinionX is a free research tool for ranking and segmenting your customers’ priorities. Thousands of teams from companies like Google, Disney, Shopify and LinkedIn use OpinionX to understand their customers’ and how they break into distinct segments so they can inform their roadmap, strategy and prioritization decisions with better data.
Create your own psychographic segmentation project (free!)
If you enjoyed this guide, subscribe to our newsletter The Full-Stack Researcher for actionable user research advice that we regularly share with thousands of product managers and founders: