
“A pairwise ranking tool breaks a long list into two-way votes so people can rank fifty options without giving up halfway. This guide tests six of them, including free single-user calculators, an unmaintained open-source wikisurvey and a patented decision platform that quotes by phone call. It covers how the method works, the three ways results get scored, how many votes each survey needs, and which tool fits which job.”
What is Pairwise Ranking?
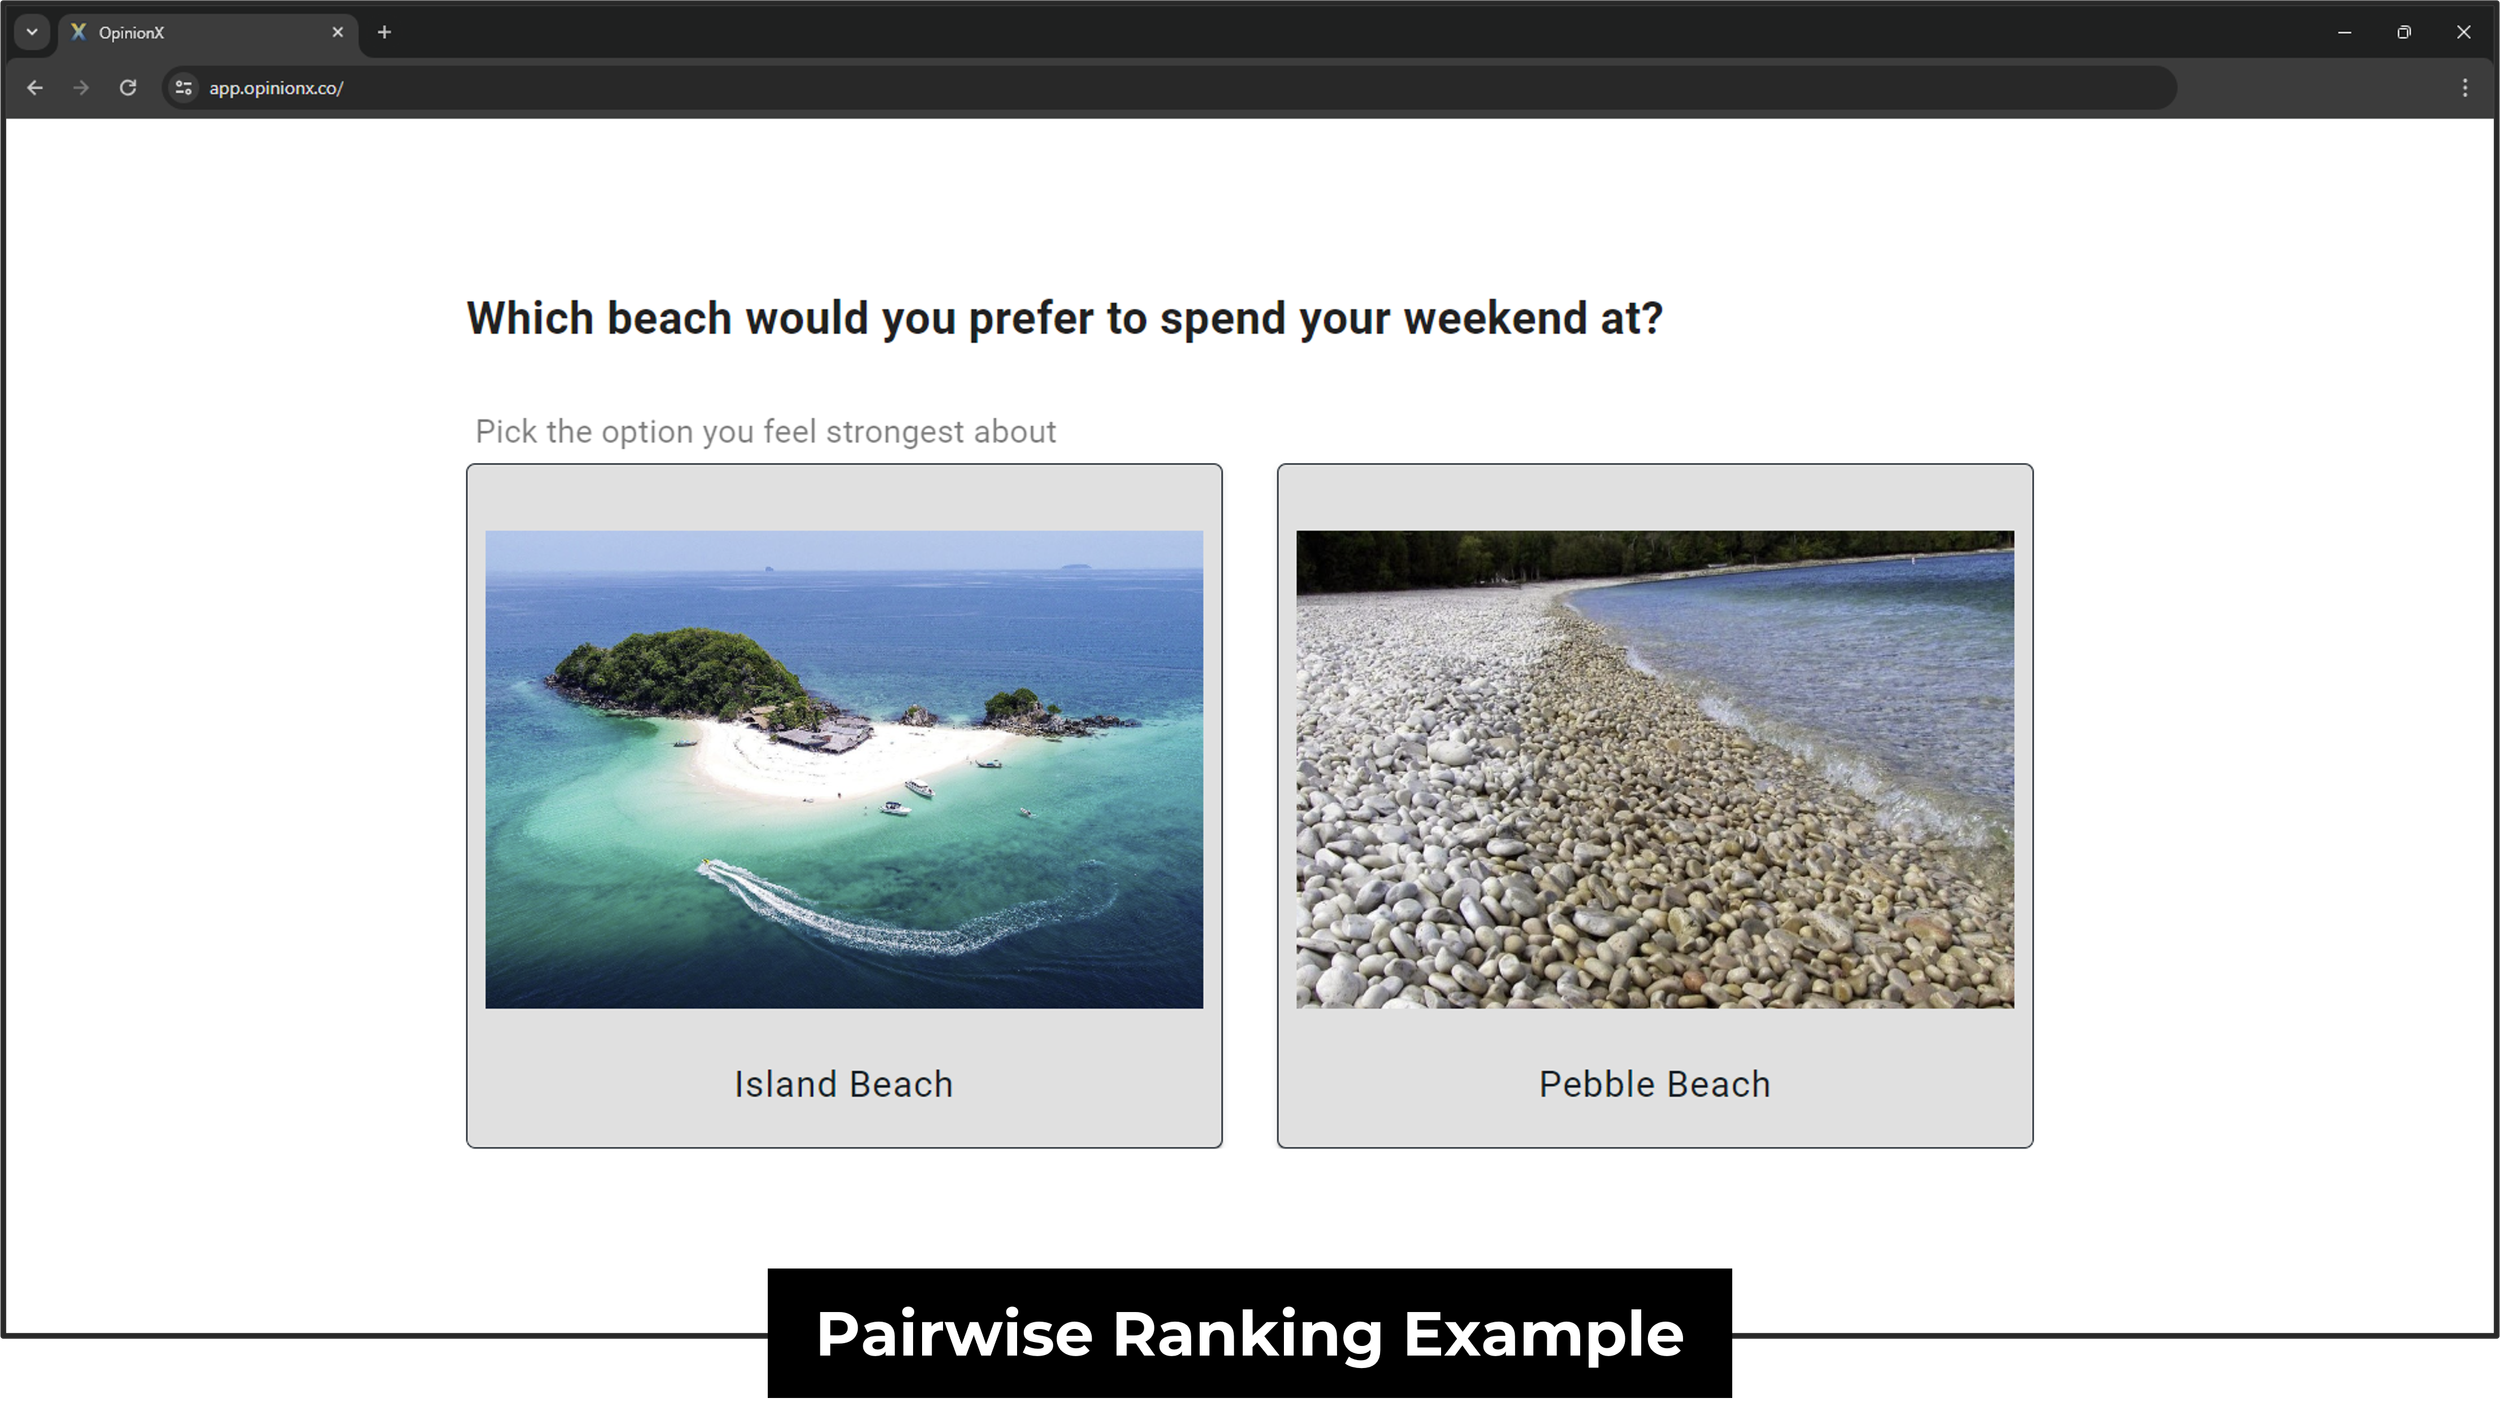
Pairwise ranking is the process of ranking a set of options using head-to-head pairs to judge which one is preferred overall. Also known as "pairwise comparison", it's a research method for ranking preferences, informing strategic decisions and running voting at scale.
This guide covers every common question about pairwise ranking:
What is pairwise ranking?
How does pairwise ranking work?
Why do people use pairwise ranking?
How do you calculate pairwise ranking results?
What is the best pairwise ranking tool?
What sample size does a pairwise ranking survey need?
Are there different types of pairwise ranking?
Examples of pairwise ranking in real-life scenarios
How do I design a pairwise ranking survey?
What is the history and origins of pairwise ranking?
How does pairwise ranking work?
Pairwise ranking works by breaking a set of options down into a series of head-to-head votes. Once a participant picks their preference from the two options, their vote is recorded and a new pair is shown for the next vote.
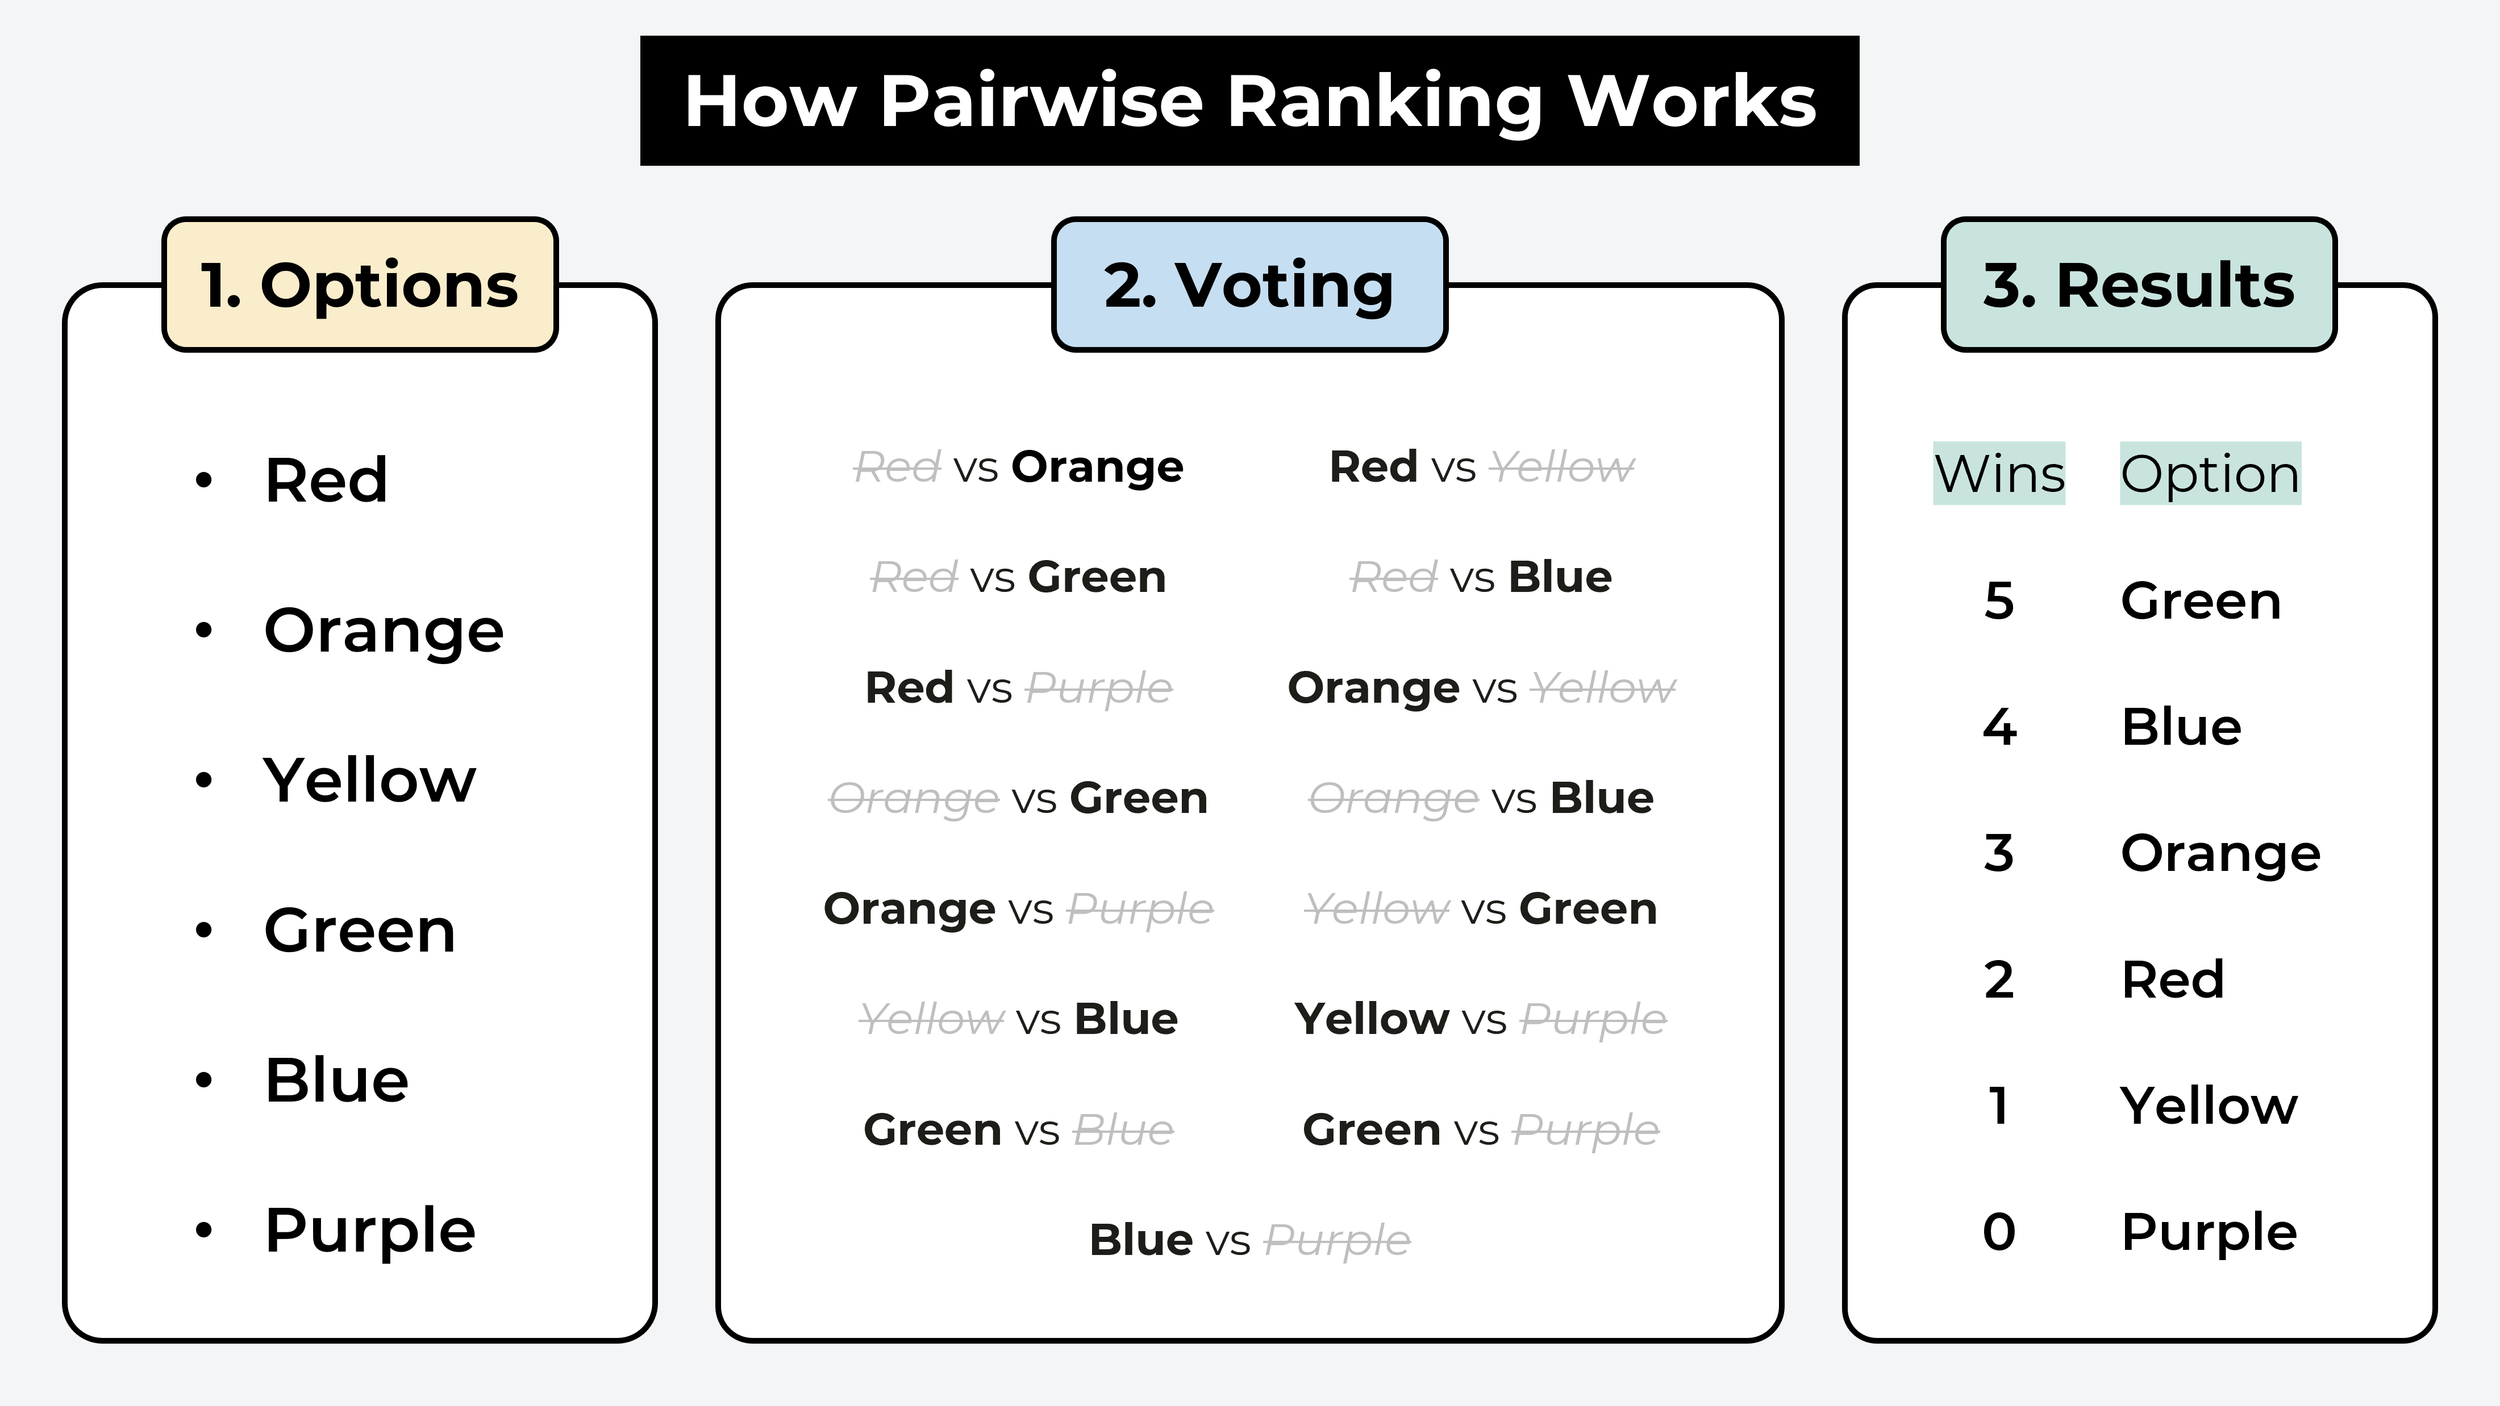
Imagine you're starting a new podcast and you've brainstormed a list of 20 names. There's no measurable way to rank a subjective list like that, so ordering all 20 at once is very difficult.
Breaking the names into pairs and picking the one you prefer from each pair takes a couple of minutes and produces a list ranked from most to least preferred.
In a pairwise ranking survey, one participant can vote on every possible pair combination, or a group of people can each be given a sample of pairs, which is later combined to calculate the group's overall preferences.
The total number of possible pairs from a list of options is n(n-1)/2, where "n" is the number of options. A set of 10 options has 45 possible pair votes, or 10(9)/2. Further down, this guide explains the difference between a survey showing every possible pair and a partial ranking survey.
Why do people use pairwise ranking?
Easy input
Comparing two options at a time is a quick decision anybody can make, even when the options are complex. The format is simple enough that participants need no training upfront.
It works on a phone
Pairwise ranking is far easier on a phone than a drag-and-drop ranking question. Around 58% of survey responses are now collected on mobile devices (SurveyMonkey), and mobile surveys have been found to run about 10% higher completion than desktop (Kadence). Any pairwise ranking tool you pick should be tested on a phone before it goes out.
Long lists
Asking people to rank a long list by personal preference creates a lot of cognitive load, which decreases completion rates and increases junk data submissions. A common recommendation is a maximum of 6 to 10 options for drag-and-drop ranking questions. Pairwise ranking handles anywhere from two options up to hundreds in a single survey.
Numerical results
Pairwise ranking takes qualitative options like text statements or images and attaches numerical data to them, which makes them more useful for informing big decisions.
Closer to how people decide
The format mimics how people decide in real life, by forcing participants to compare and compromise.
How do you calculate pairwise ranking results?
There are three ways to score pairwise ranking data.
Win rate
Win rate is the most common way to calculate pairwise ranking results. It counts how often an option won out of all pairs it appeared in, and displays that as a percentage or a 0 to 100 number. An option that appeared in 10 pair votes and won 8 of them has a win rate of 80%, so the score is "80".
Win rate can also be read as the likelihood of an option winning against any other randomly selected option from the same set.

^ Example of pairwise ranking voting and results (via OpinionX). The results screen shows the Win Rate number under the “Score” column.
Probabilistic
Probabilistic scoring methods use Bayesian algorithms to analyse voting patterns and predict an option's importance relative to a baseline starting point. The best-known probabilistic algorithm for pairwise ranking is ELO, famous for scoring competitive chess players. These models typically start at a baseline of 1500, which moves up or down with the outcome of each comparison.
Other, more complex probabilistic methods include Glicko and TrueSkill, best known for their use in multiplayer games like Halo, Counter-Strike and Dota. The format works in gaming, where raw scores are hidden from users, but it makes survey results difficult to interpret.

^ The formula shown has since been updated to Glicko-2, which adds a variable for outcome volatility.
Manual
Tracking pairwise ranking votes in a manual table works if two conditions are met: only one person votes, and there is only a small set of options.
The pairwise ranking matrix is a table showing your options along both the header row and the column. You start on a row and compare that option against each column. The row gets a 1 if it wins and a 0 if it loses.
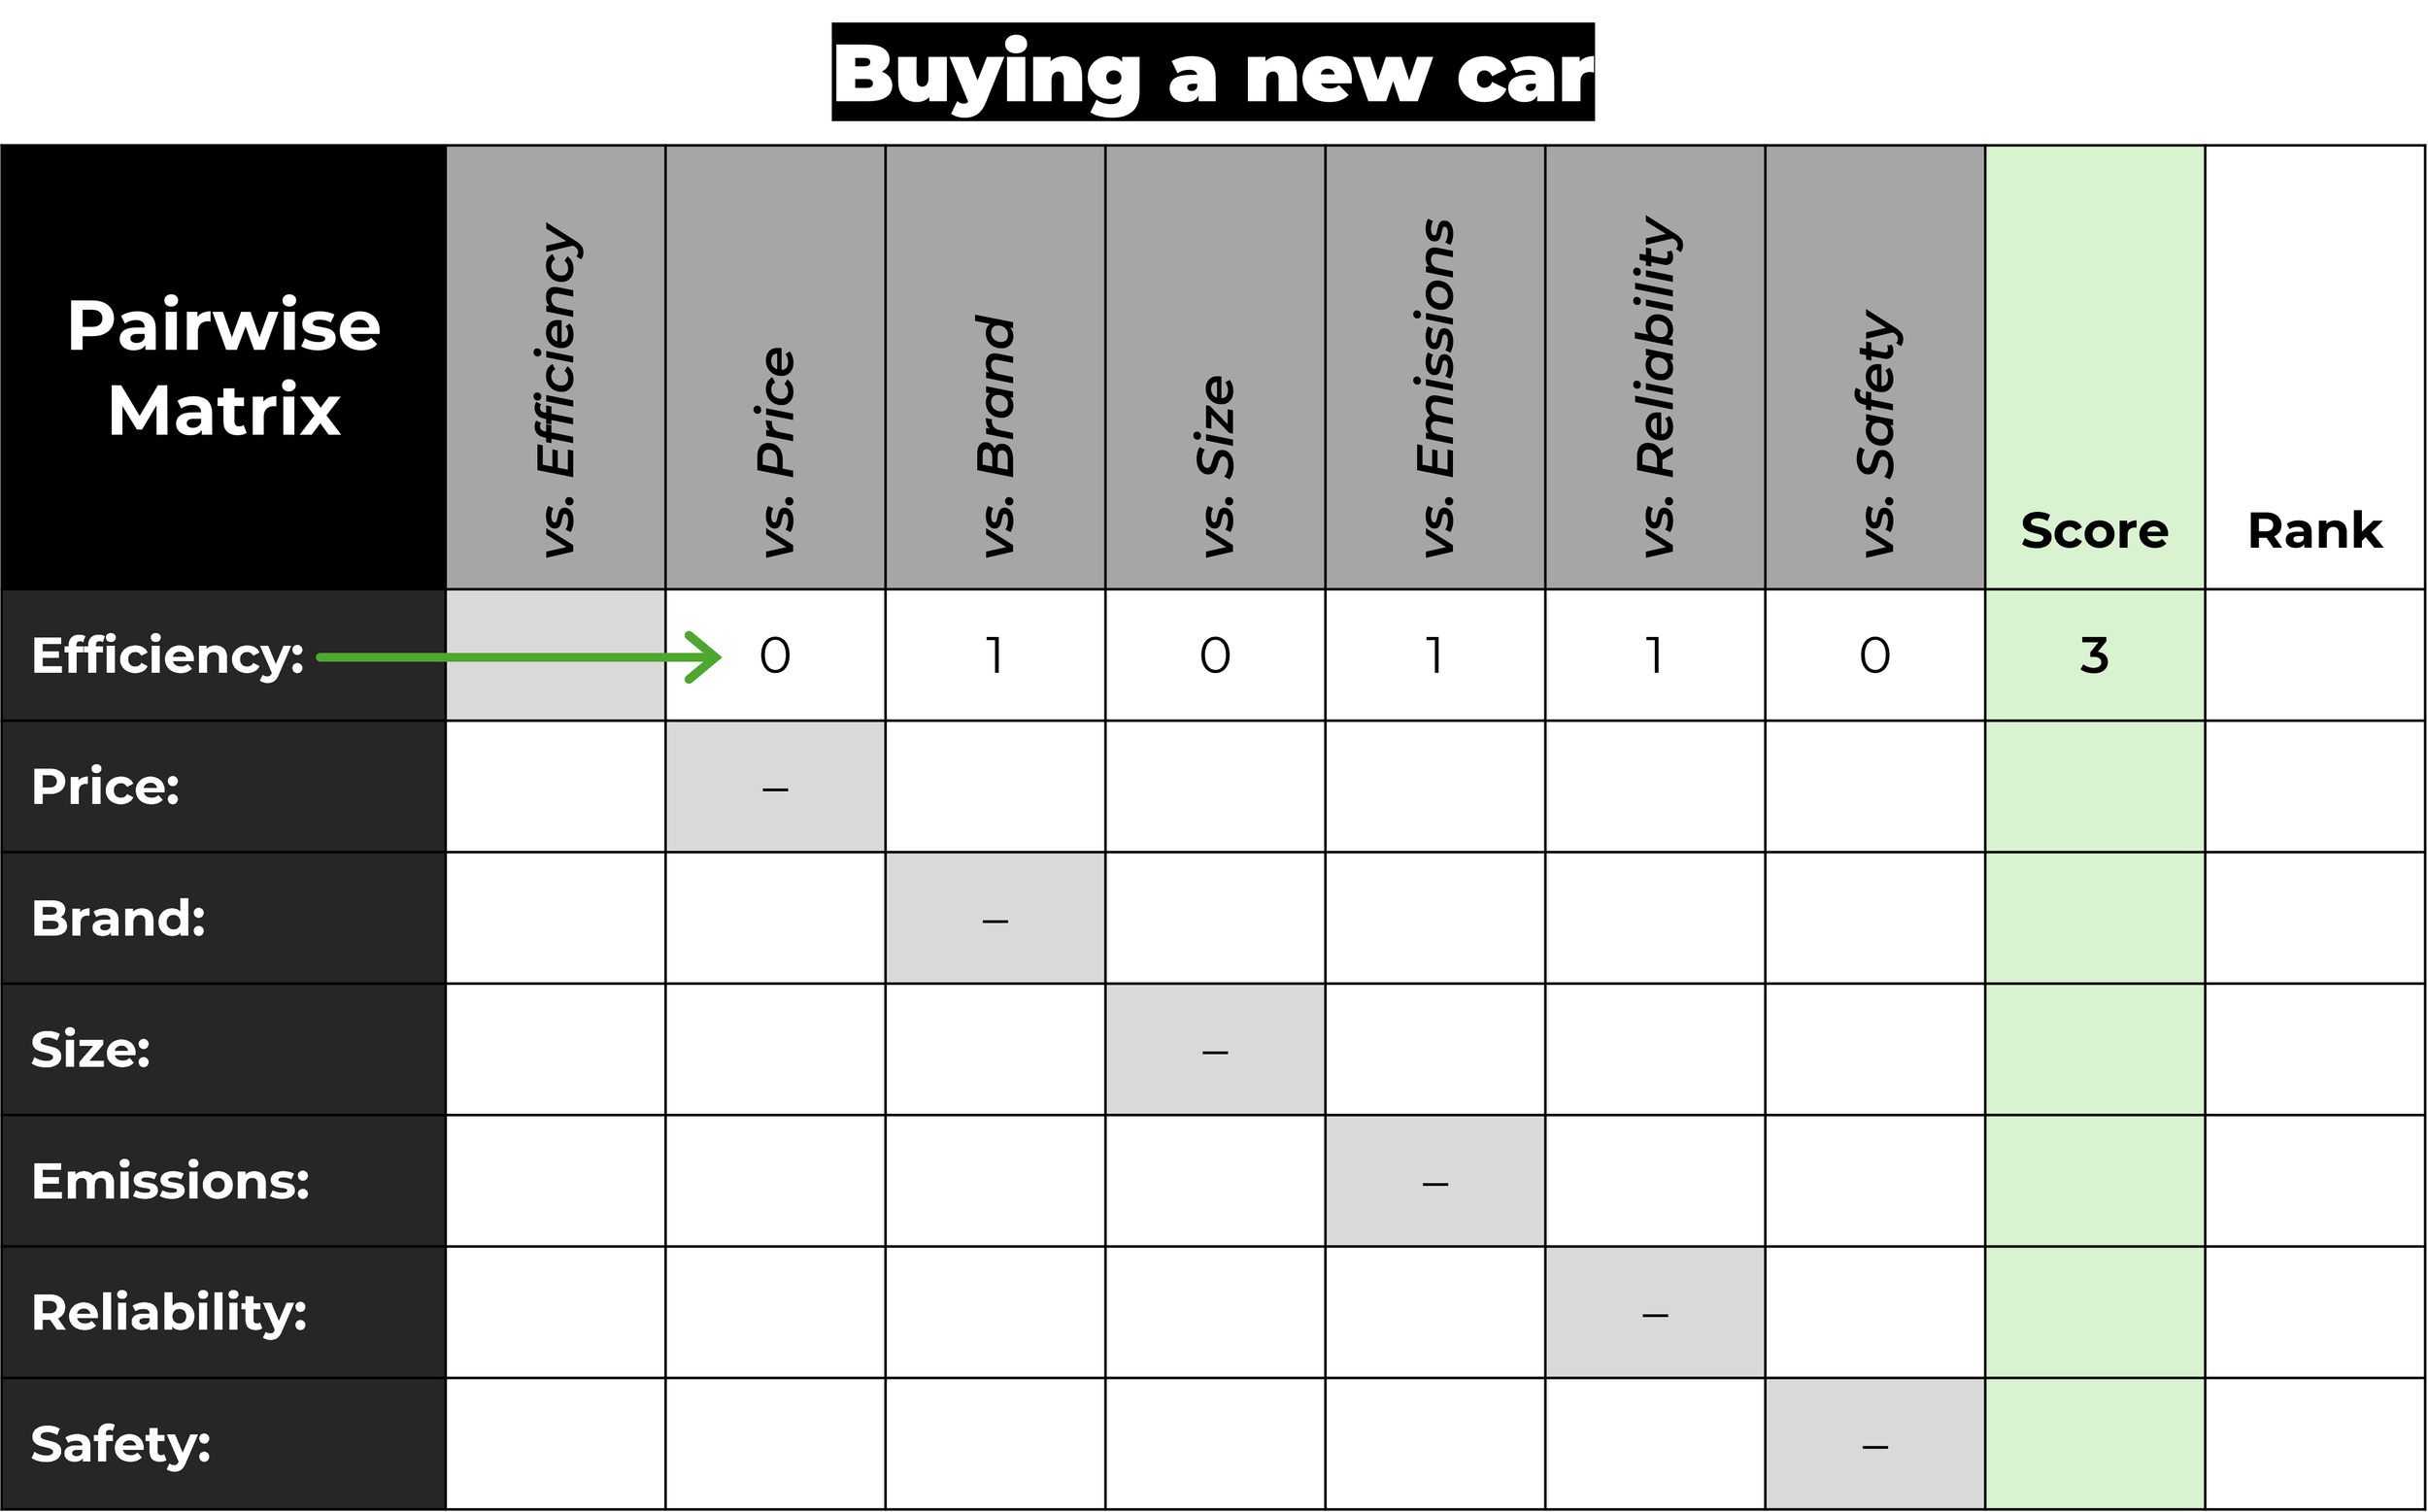
Once all comparisons are made, the options can be ranked from highest to lowest score. Some versions give 0.5 to both options in the case of a tie. Paired matrices generally follow the principle of transitivity: if you prefer A over B and B over C, it is assumed you prefer A over C.
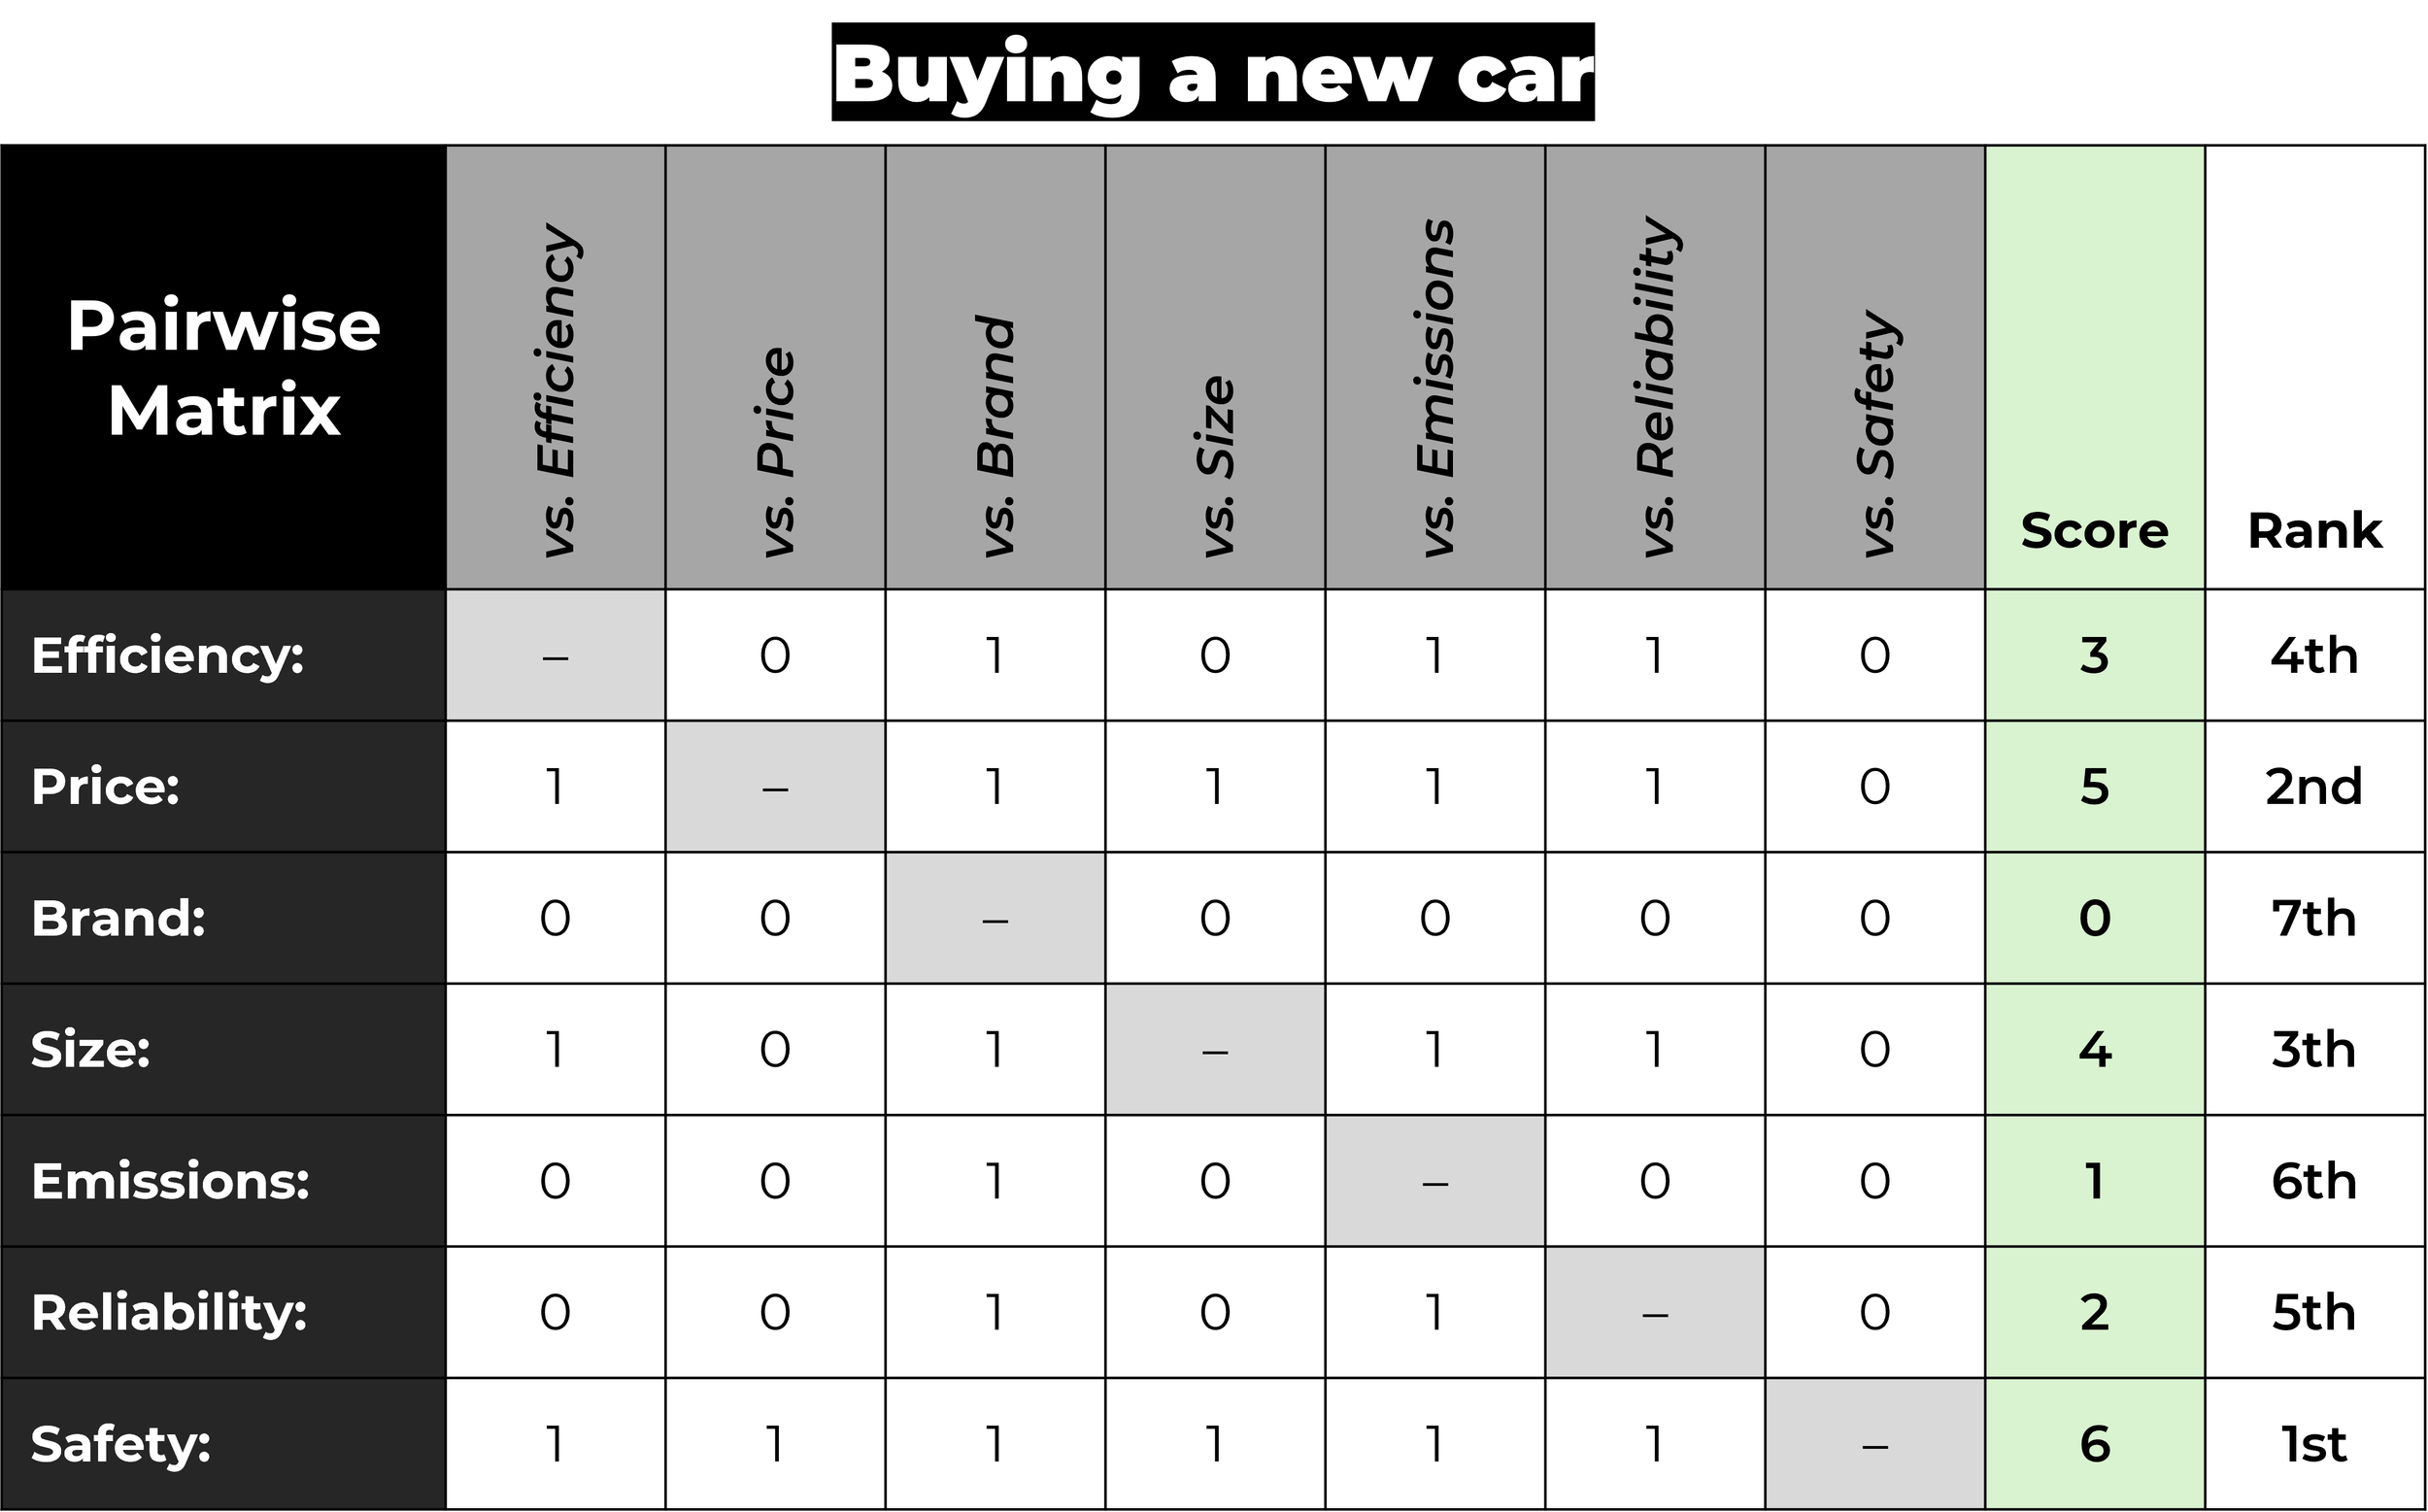
Of the three, win rate is the most widely used calculation method for surveys and research, because it's easy to interpret while still being mathematically sound. Probabilistic methods tend to be used in gaming, and the manual matrix is mostly used in school math questions.
What is the best pairwise ranking tool?
1. OpinionX

OpinionX runs ranking surveys, including pairwise ranking. Teams at Disney, Google and LinkedIn use it. "Pair Rank" questions use the win rate scoring method and let you customise the question with settings for forced ranking or a custom number of pair votes per participant.
The free tier includes unlimited surveys, every question type including text and image pairwise ranking, unlimited ranking options and unlimited researcher seats on a shared workspace, capped at 25 participants per survey. Paid plans start at $900 a year for unlimited participants.
Vote on 10 pairs, then click the button that appears to see the overall results for everyone who has completed the survey. No login required.
What this pairwise ranking tool adds on top of the voting is analysis built specifically for ranked results:
Filter by group. Restrict results to votes cast by participants from one country, plan or role, in one click.
Compare two segments side by side. See how the ranking changes between, say, European and American participants, using needs-based segmentation.
Read one person's ranking. Participant-level data shows you exactly who cares about a specific option, so you know who to interview next.
See every segment at once. One table showing results for all participant segments, which is where the useful splits usually surface.
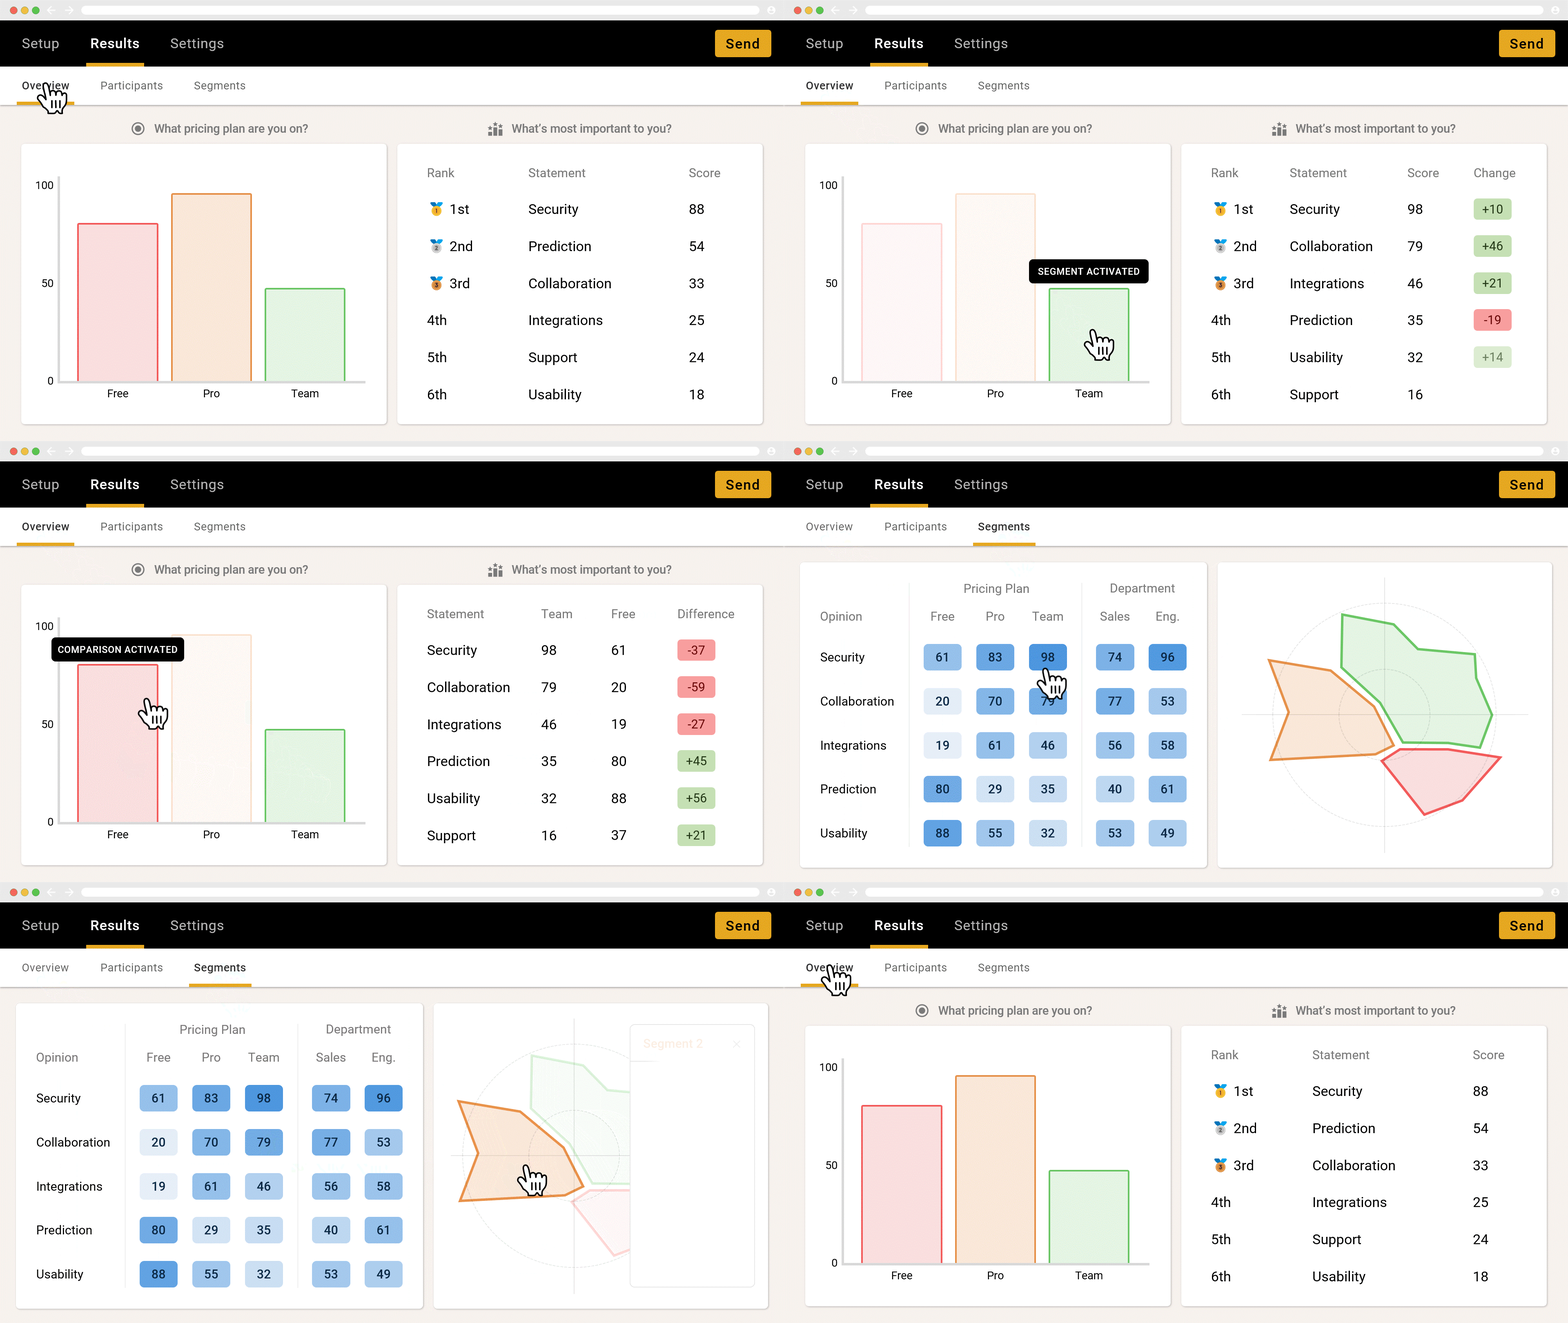
Verdict: the only option on this list that handles multiple participants, segmentation and exports together. Create a free survey at app.opinionx.co.
2. PickedShares
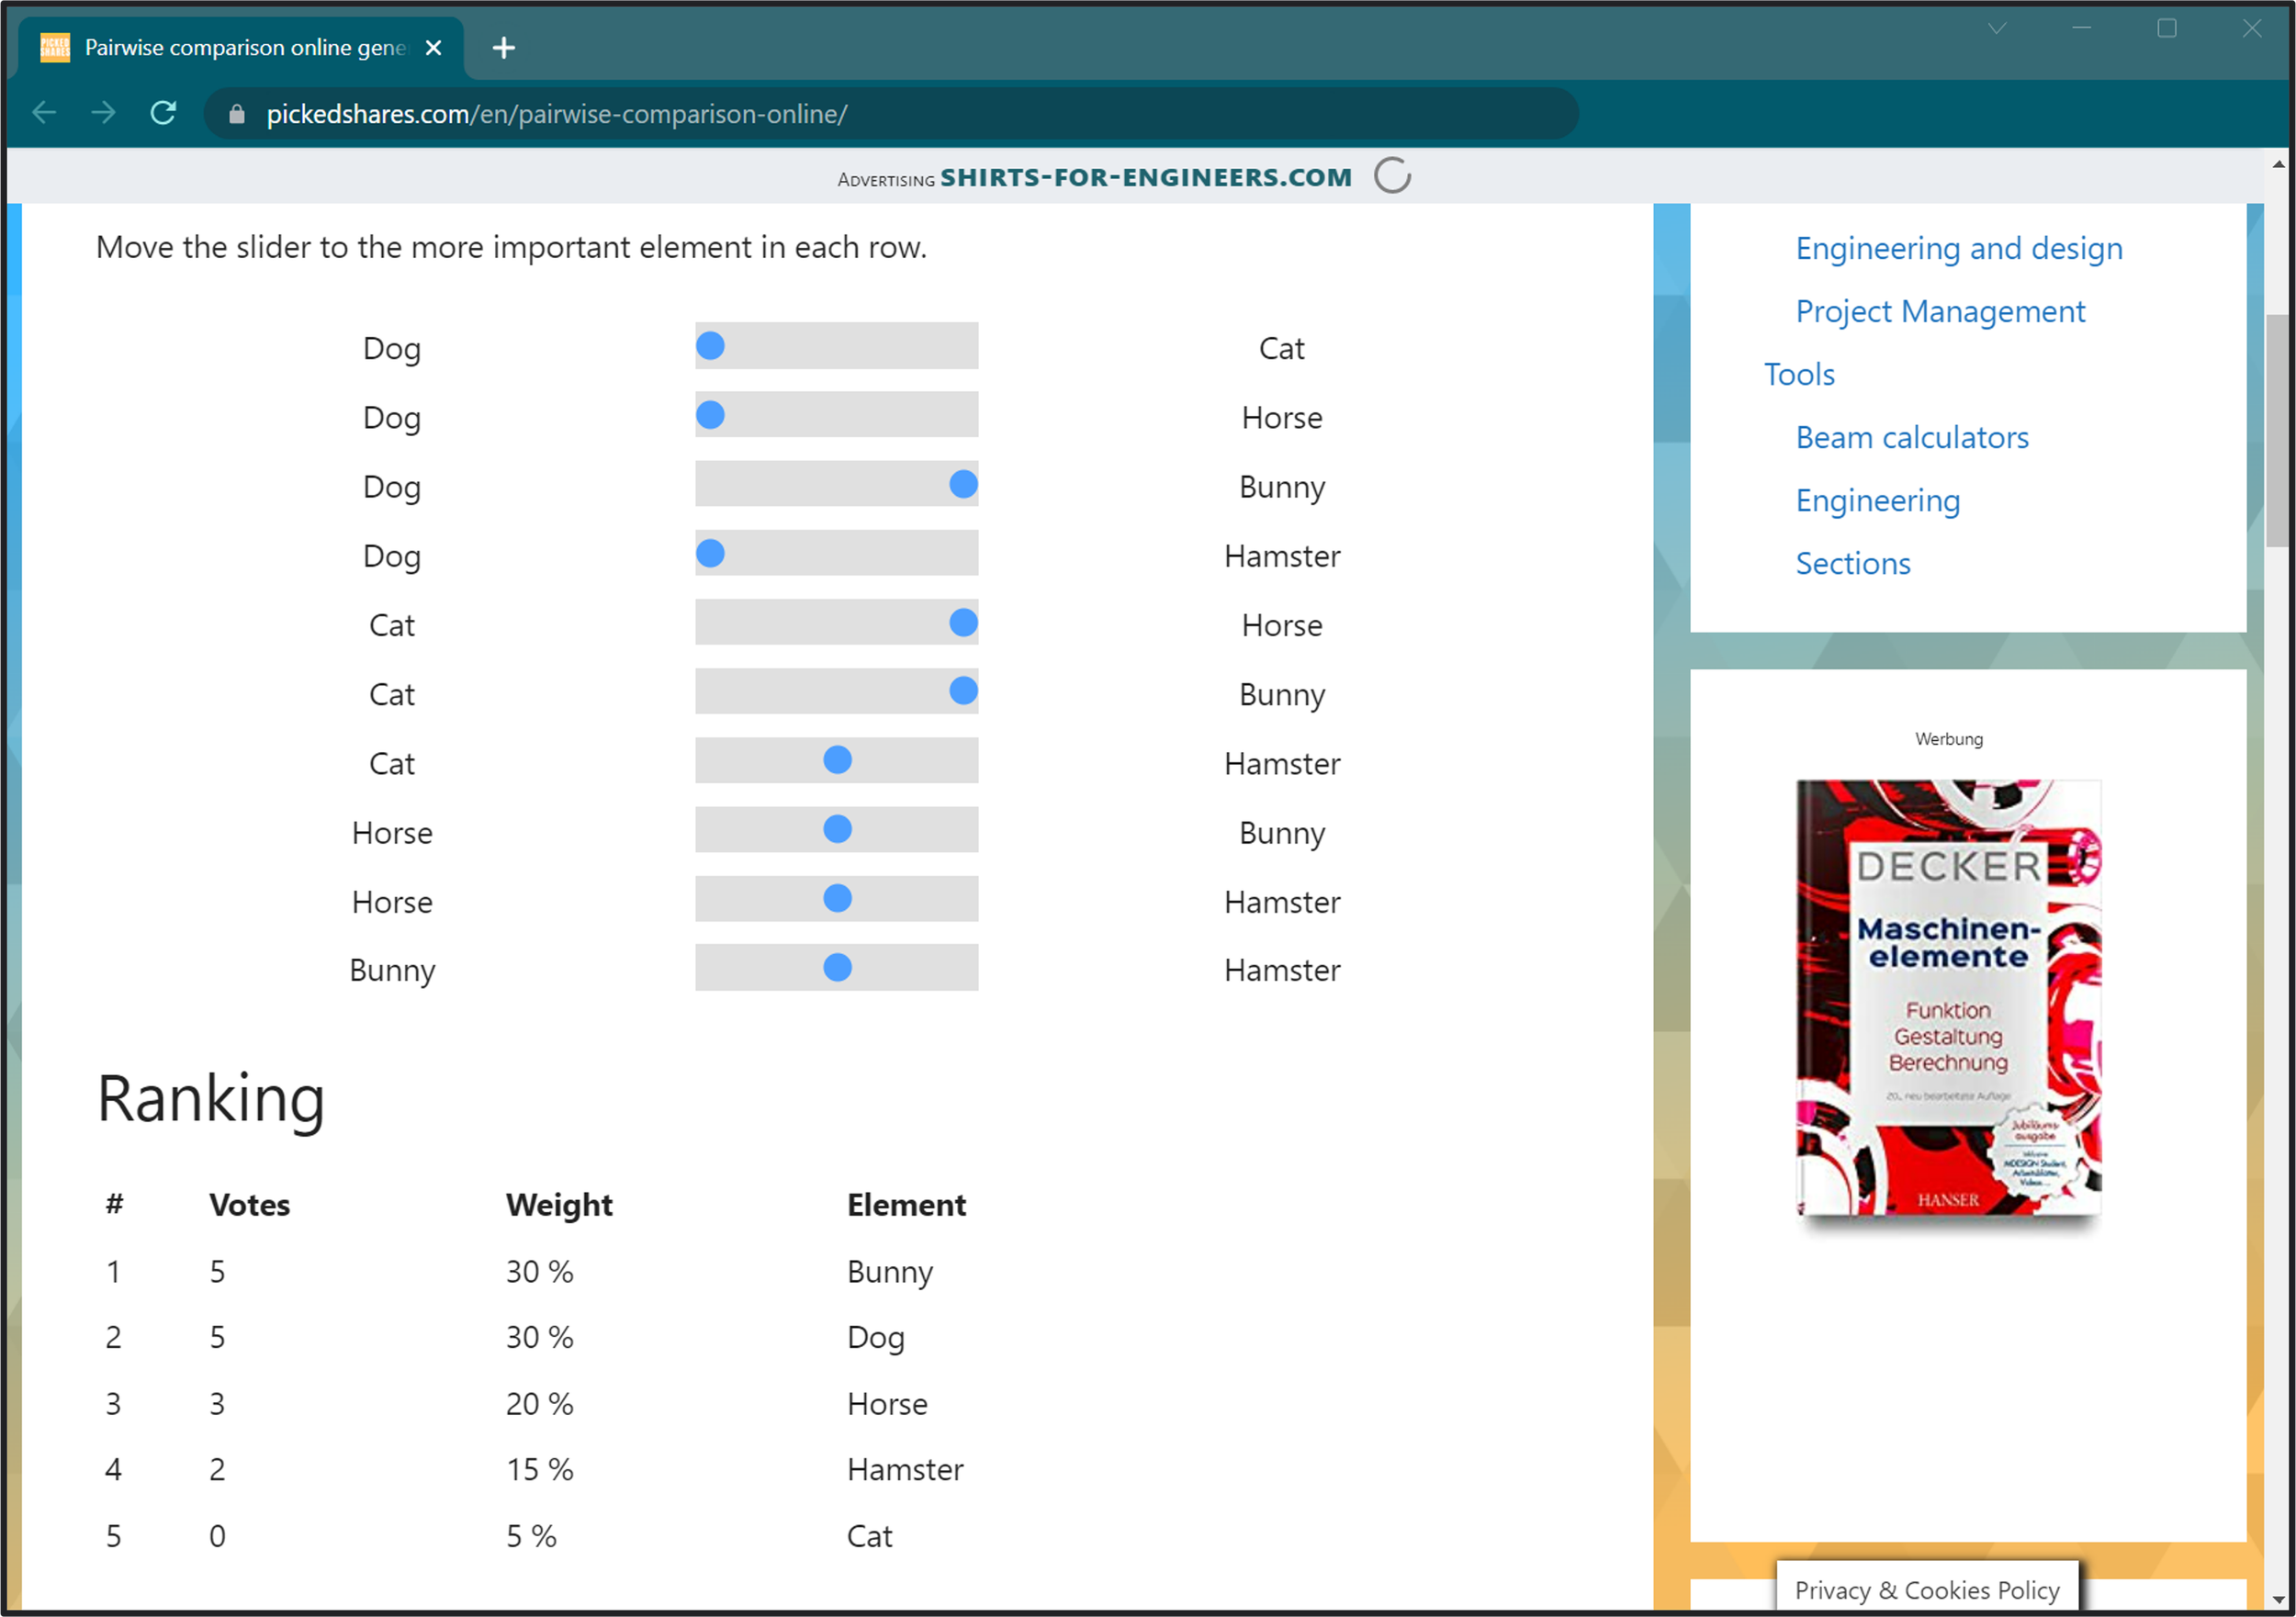
PickedShares is an online library of tools, frameworks and project management advice for mechanical engineers. Its free pairwise ranking tool displays all possible pair combinations on a single page with interactive toggles for casting votes.
The design is built for ranking your own priorities. It doesn't handle voting from multiple participants. Voting is visually easy to follow and quick to complete, since everything sits on one page. It's essentially an automated version of the manual matrix described above.
Verdict: fine for one person ranking their own list. The page carries a lot of advertisements, which is distracting while you're voting.
3. PollUnit

PollUnit is an online poll maker with a pairwise ranking tool built into it. The free tier allows up to 20 options per poll and up to 40 participants. Paid plans are billed monthly.
The survey design is dated, unless you're a fan of animated backgrounds with shooting stars and fireflies. The company plants trees for each purchase made.
Verdict: workable for a small free poll. The 40-participant cap makes it unsuitable for research.
4. AllOurIdeas

AllOurIdeas is a free open-source pairwise ranking tool for running wikisurveys, meaning surveys where participants add the options they vote on themselves. OpinionX also supports adding participant-submitted options to the ranking list mid-survey.
AllOurIdeas is free to use, but the team stopped maintaining it several years ago and some features no longer work. Results appear as a simple ranked list, with no analysis features and no export options.
Verdict: avoid for anything you need to analyse. Still worth knowing as the original academic wikisurvey tool.
5. 1000minds

1000minds is a decision-making tool created in 2002 for academics and governments needing a bespoke decision-insights platform. It's based on Multi-Criteria Decision Making (MCDM), an advanced relative of pairwise ranking. Voting is analysed with a proprietary method called PAPRIKA, which maps the relative importance of variable co-dependencies and overall priorities. PAPRIKA is patented, so it isn't a publicly available algorithm you can inspect, though the data science behind it is documented.
1000minds does not publish prices. The company charges an annual licence fee set per customer, so you have to book a call with their sales team before you can get a quote. A limited free trial is available for an unspecified period. Ours lasted 21 days before access to the projects was lost.
Verdict: the right pick for experienced professional researchers running formal multi-criteria decision analysis with budget for an annual licence. If that describes your project, choose 1000minds over anything else here, including us. Anyone with less experience will find it hard to navigate without support.
6. Pairwise-Ranking-App

This open-source tool is similar to PickedShares in that it handles a single participant only, but it uses a survey-style design for voting on one pair at a time. Unlike the other options here, the results page shows a breakdown of wins and losses instead of an overall score.
Verdict: a clean single-user pairwise ranking tool if you want the survey feel without the ad clutter.
Which pairwise ranking tool should you pick?
| If you need | Pick |
|---|---|
| Formal multi-criteria decision analysis, with budget | 1000minds |
| To rank your own priorities, nobody else voting | PickedShares or Pairwise-Ranking-App |
| A small free poll with under 40 people | PollUnit |
| A wikisurvey, and you accept unmaintained software | AllOurIdeas |
| Multiple participants, segmented results and exports | OpinionX |
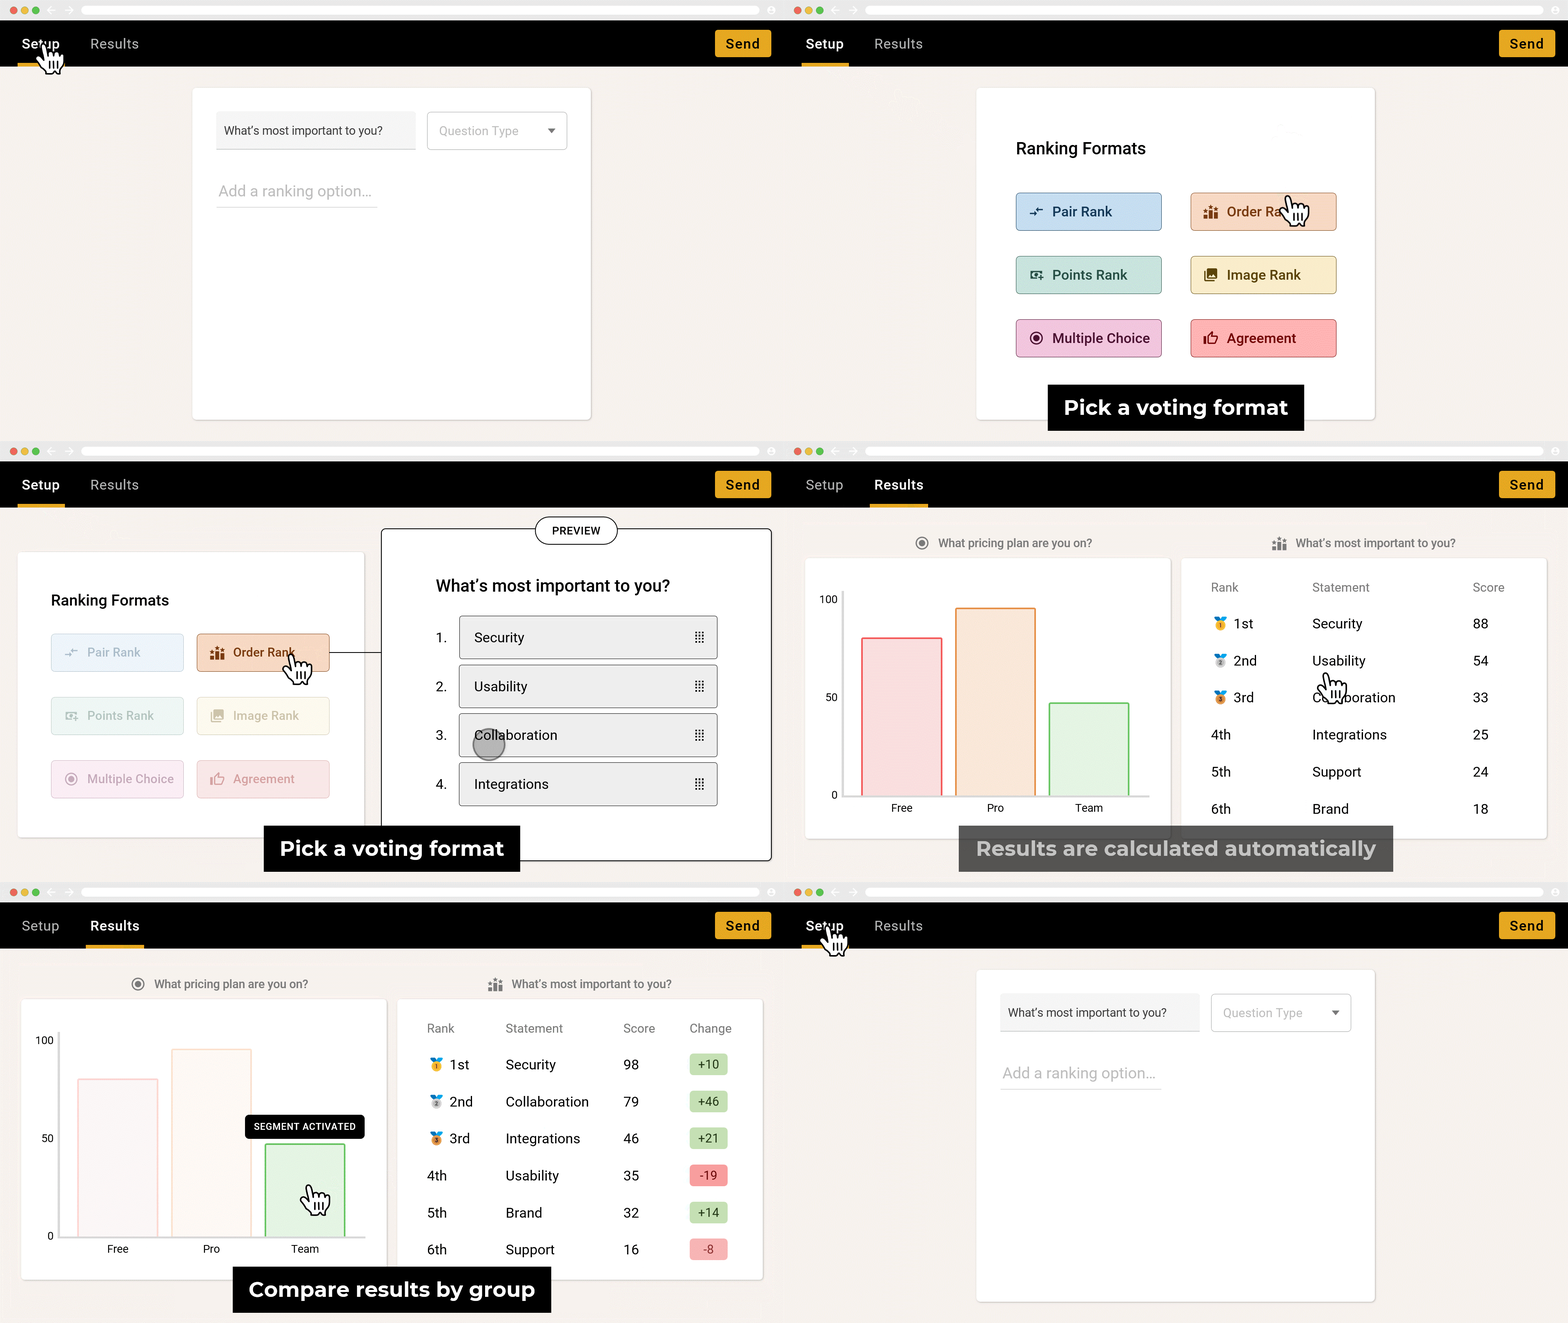
^ GIF via opinionx.co
Are there different types of pairwise ranking?
Yes. Pairwise ranking always follows the core principle of head-to-head voting, but there are several ways to customise a survey. These formats are not mutually exclusive and can be combined.
Complete pairwise ranking
In a complete pairwise ranking, each participant sees every possible pair from the list. The resulting data is an accurate picture of that individual's preferences. The total is n(n-1)/2, so 15 options gives 15(14)/2 = 105 possible pairs.
Complete pairwise ranking is generally used when a survey has a very limited pool of participants, when a single person is ranking their own preferences, or when the voting list is short, usually 15 to 20 options at most.
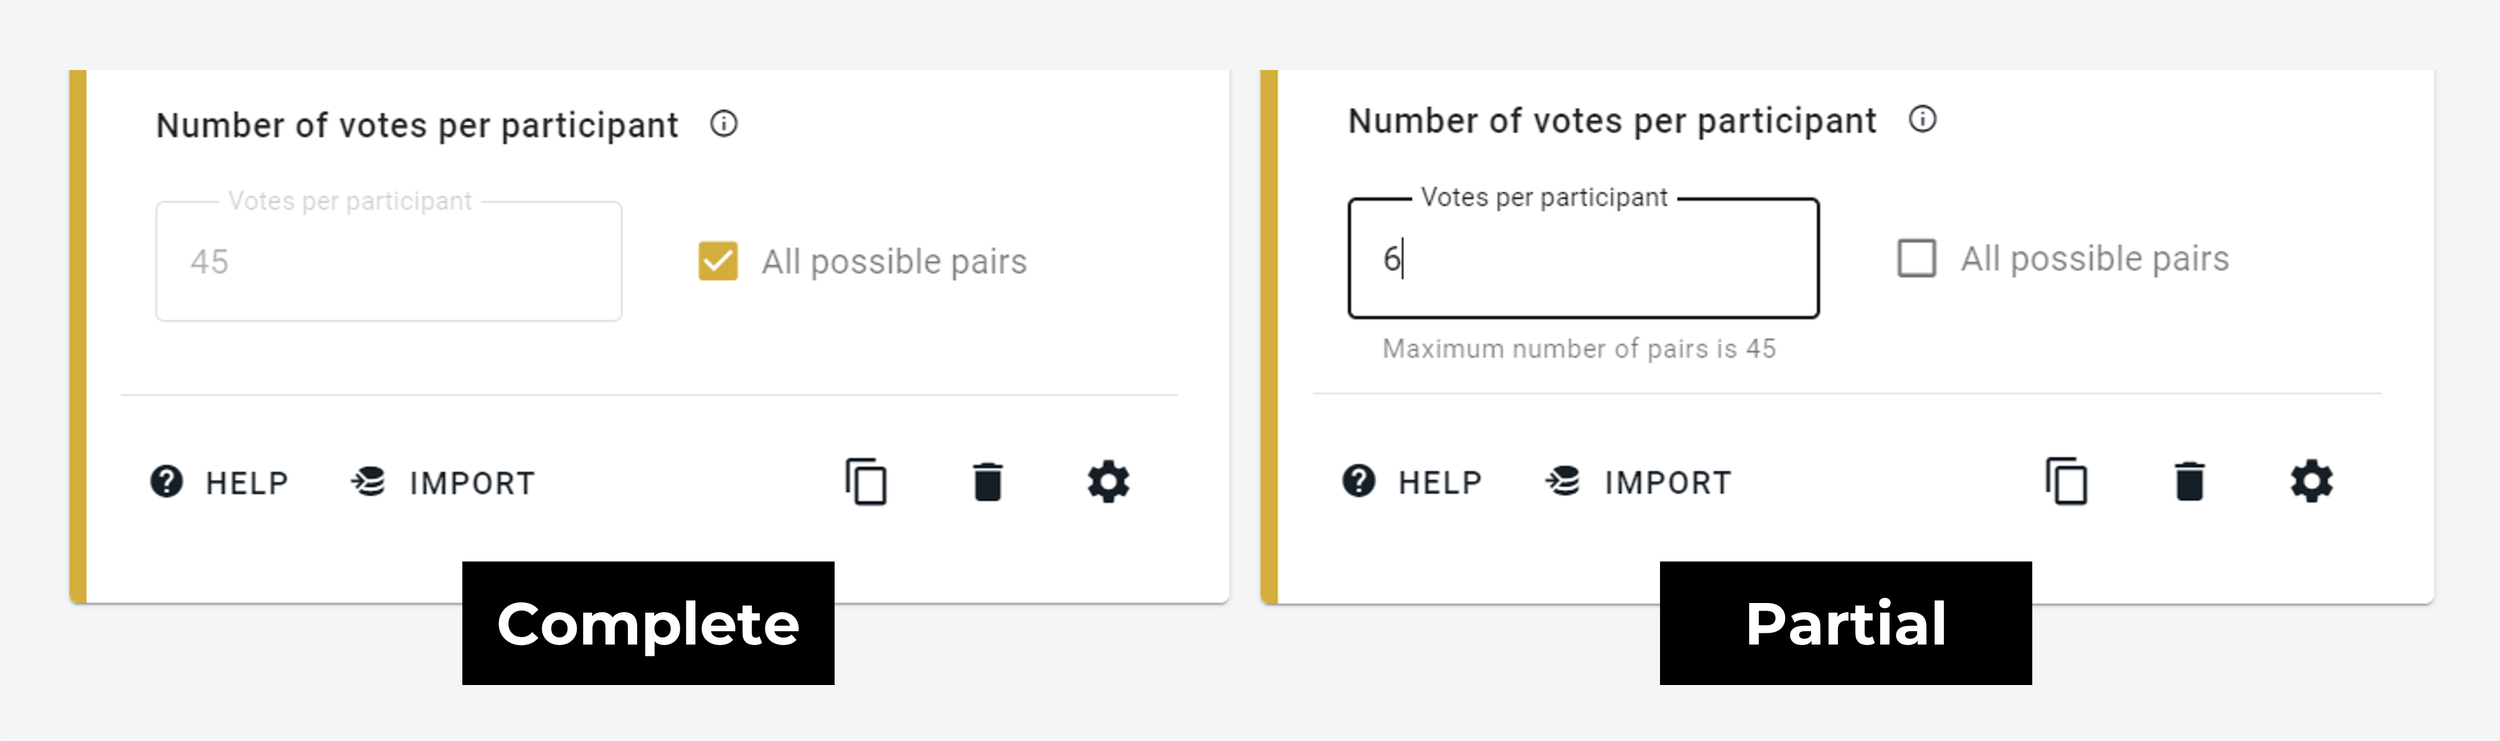
^ Configuring the number of votes on a pairwise ranking survey with 10 options (via opinionx.co)

Partial pairwise ranking
When surveys engage larger groups, or when there are 20+ options to rank, researchers use a partial pairwise ranking. Each participant sees a sample of all possible pairs instead of the complete set.
The rule of thumb is to make sure your overall dataset gets as many votes as 3x the total number of possible pairs. Calculate it with 3n(n-1)/2, then divide by your estimate of the minimum number of participants expected to complete the survey. Partial pairwise ranking is used far more often than complete pairwise ranking on OpinionX surveys.
This calculator is built into every OpinionX survey that includes a pairwise ranking question.
Forced pairwise ranking
Pairwise ranking surveys usually show the two options alongside a third "skip" option, which stops participants voting on irrelevant or incomparable pairs. Removing skip forces participants to complete every comparison. This is forced pairwise ranking.
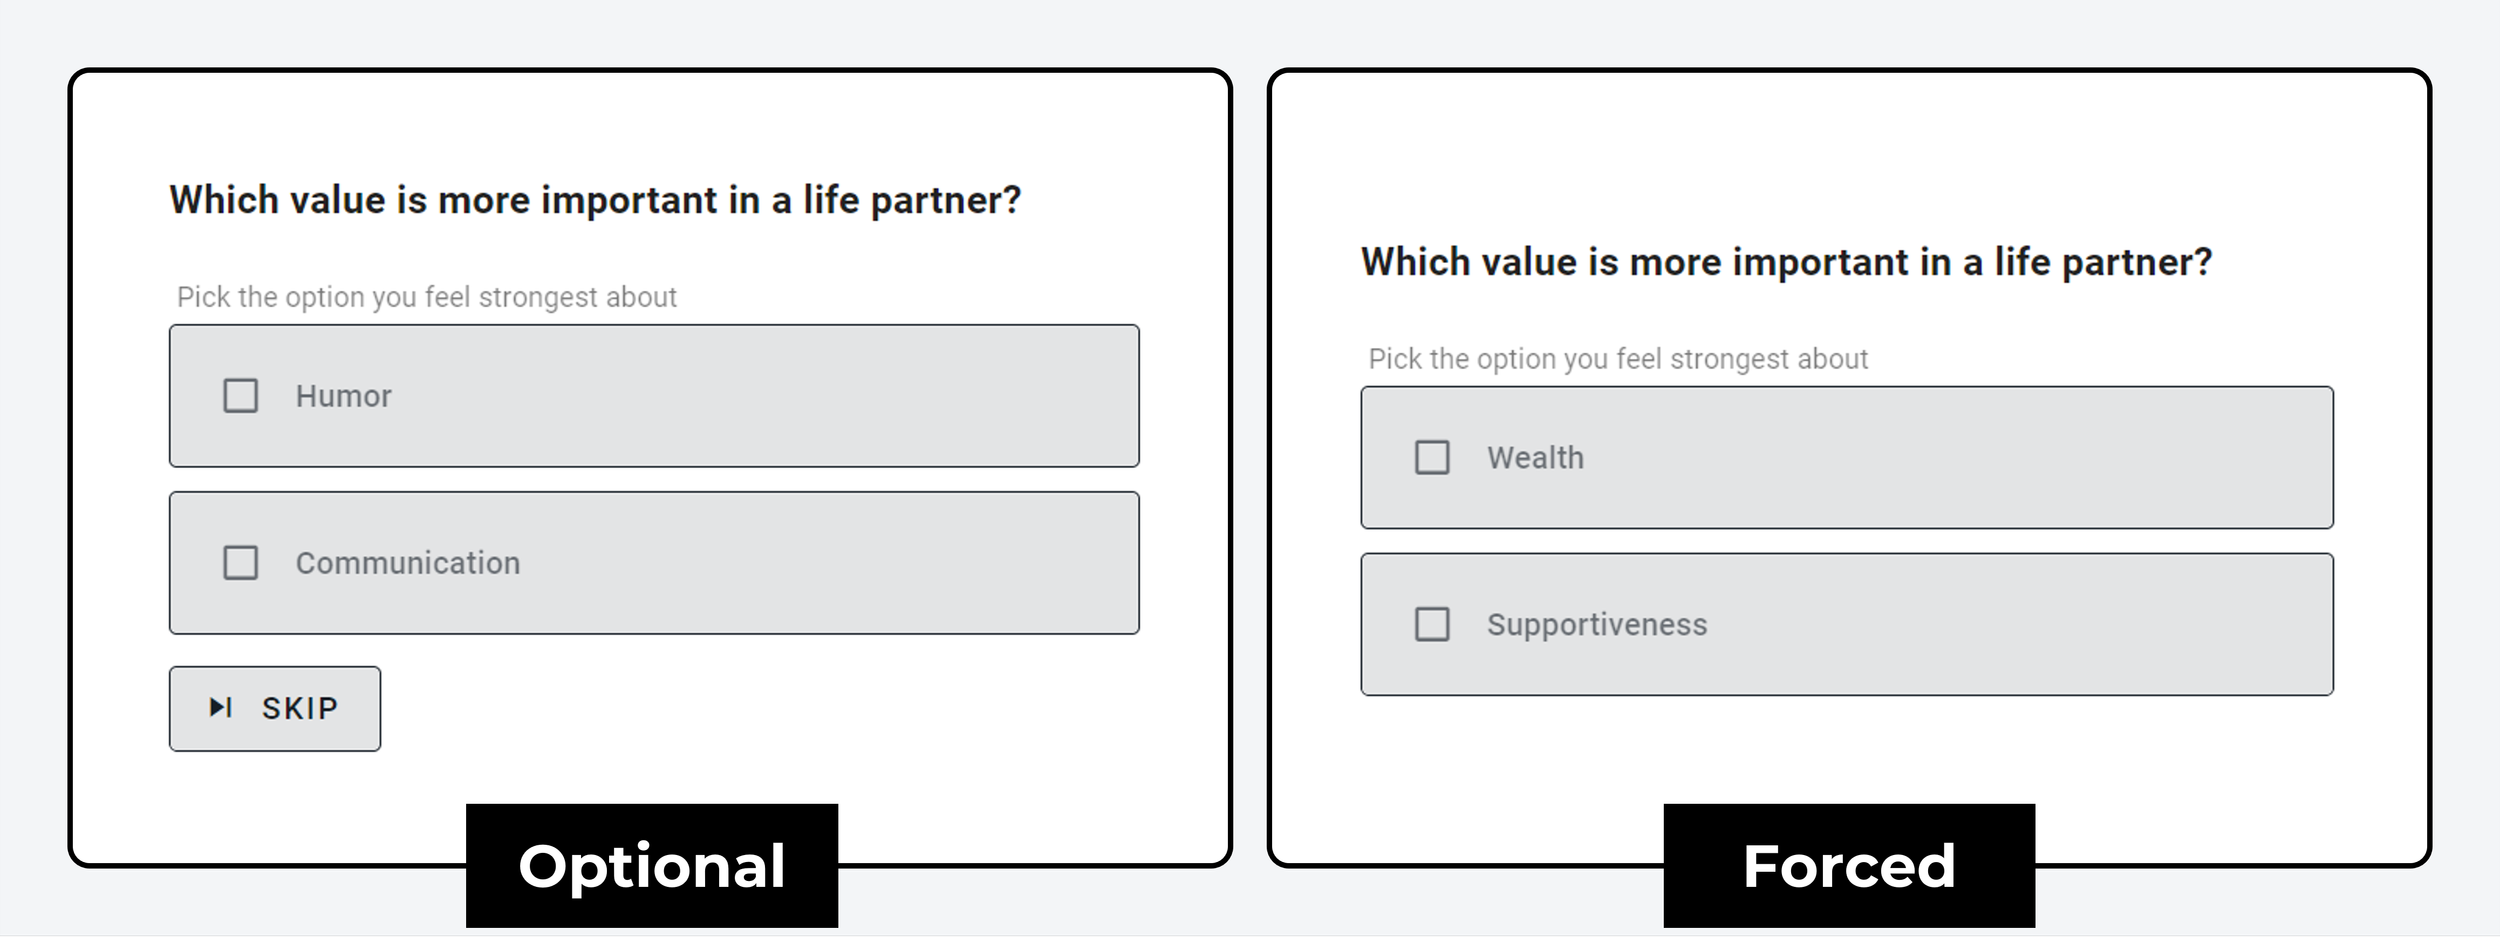
Image pairwise ranking
Pairwise ranking is not restricted to text. You can also use images or GIFs. Image ranking is commonly used for concept testing, where researchers want to understand preferences across a set of visual options.

Adaptive pairwise ranking
Adaptive pairwise ranking means the survey uses what it learned from past votes to choose which options to pair next. This can work on transitivity, so if you picked A>B and B>C it assumes A>C and skips that pair, or on the overall dataset, making sure options get an even or prioritised spread of votes.
What sample size does a pairwise ranking survey need?
If your survey shows every possible pair to each participant, there's nothing to worry about. A complete pairwise ranking is as sound a representation of someone's personal preferences as you can get.
Most surveys don't do this. The option list may be too long, since 30 options requires 435 pair votes. There may be many participants, in which case a sample of votes from each person is enough to calculate the aggregate. Or the participants aren't paid enough to sit through 100+ votes.
For these partial rankings, aim for a minimum number of votes so every pair combination appears 3x across the survey, or 3n(n-1)/2. Divide that by the lowest estimate of how many participants will finish, and you have the number of votes to ask of each person.
There is generally no need to require fewer than 10 pair votes, which takes 30 to 60 seconds. The formula helps in cases where the recommended number sits above 10.
It works in both directions: give it the number of options and it tells you how many participants to recruit, or give it the number of participants and it tells you the maximum number of options you can include.
Examples of pairwise ranking in real-life scenarios
Pairwise ranking turns up in academia, government, commercial research and quick ranking exercises.
Ranking everything in the world
YouTuber Tom Scott ran a viral experiment in 2020 that gathered 1.2 million votes using pairwise ranking to rank everything in the world. It's a good example of partial pairwise ranking: the list was 7,188 options long, meaning 25,830,078 possible pair combinations. Scott correctly identified that you don't need every possible pair voted on, because the real result is each option's win rate. The top 10 included "pizza", "sleep" and "gravity".
Assumption testing at Labster
What do you do when your sales team is certain customers desperately want a specific new feature and you're not sure you agree? That was the situation facing Tudor Cristian Bogdan, a UX researcher at Labster. He ran internal workshops to gather recent customer feedback, then ran a pairwise ranking survey to test the hypothesis. The problem the team was certain about didn't finish in the top 10. The result changed how the team tests internal assumptions.
Message testing at OpinionX
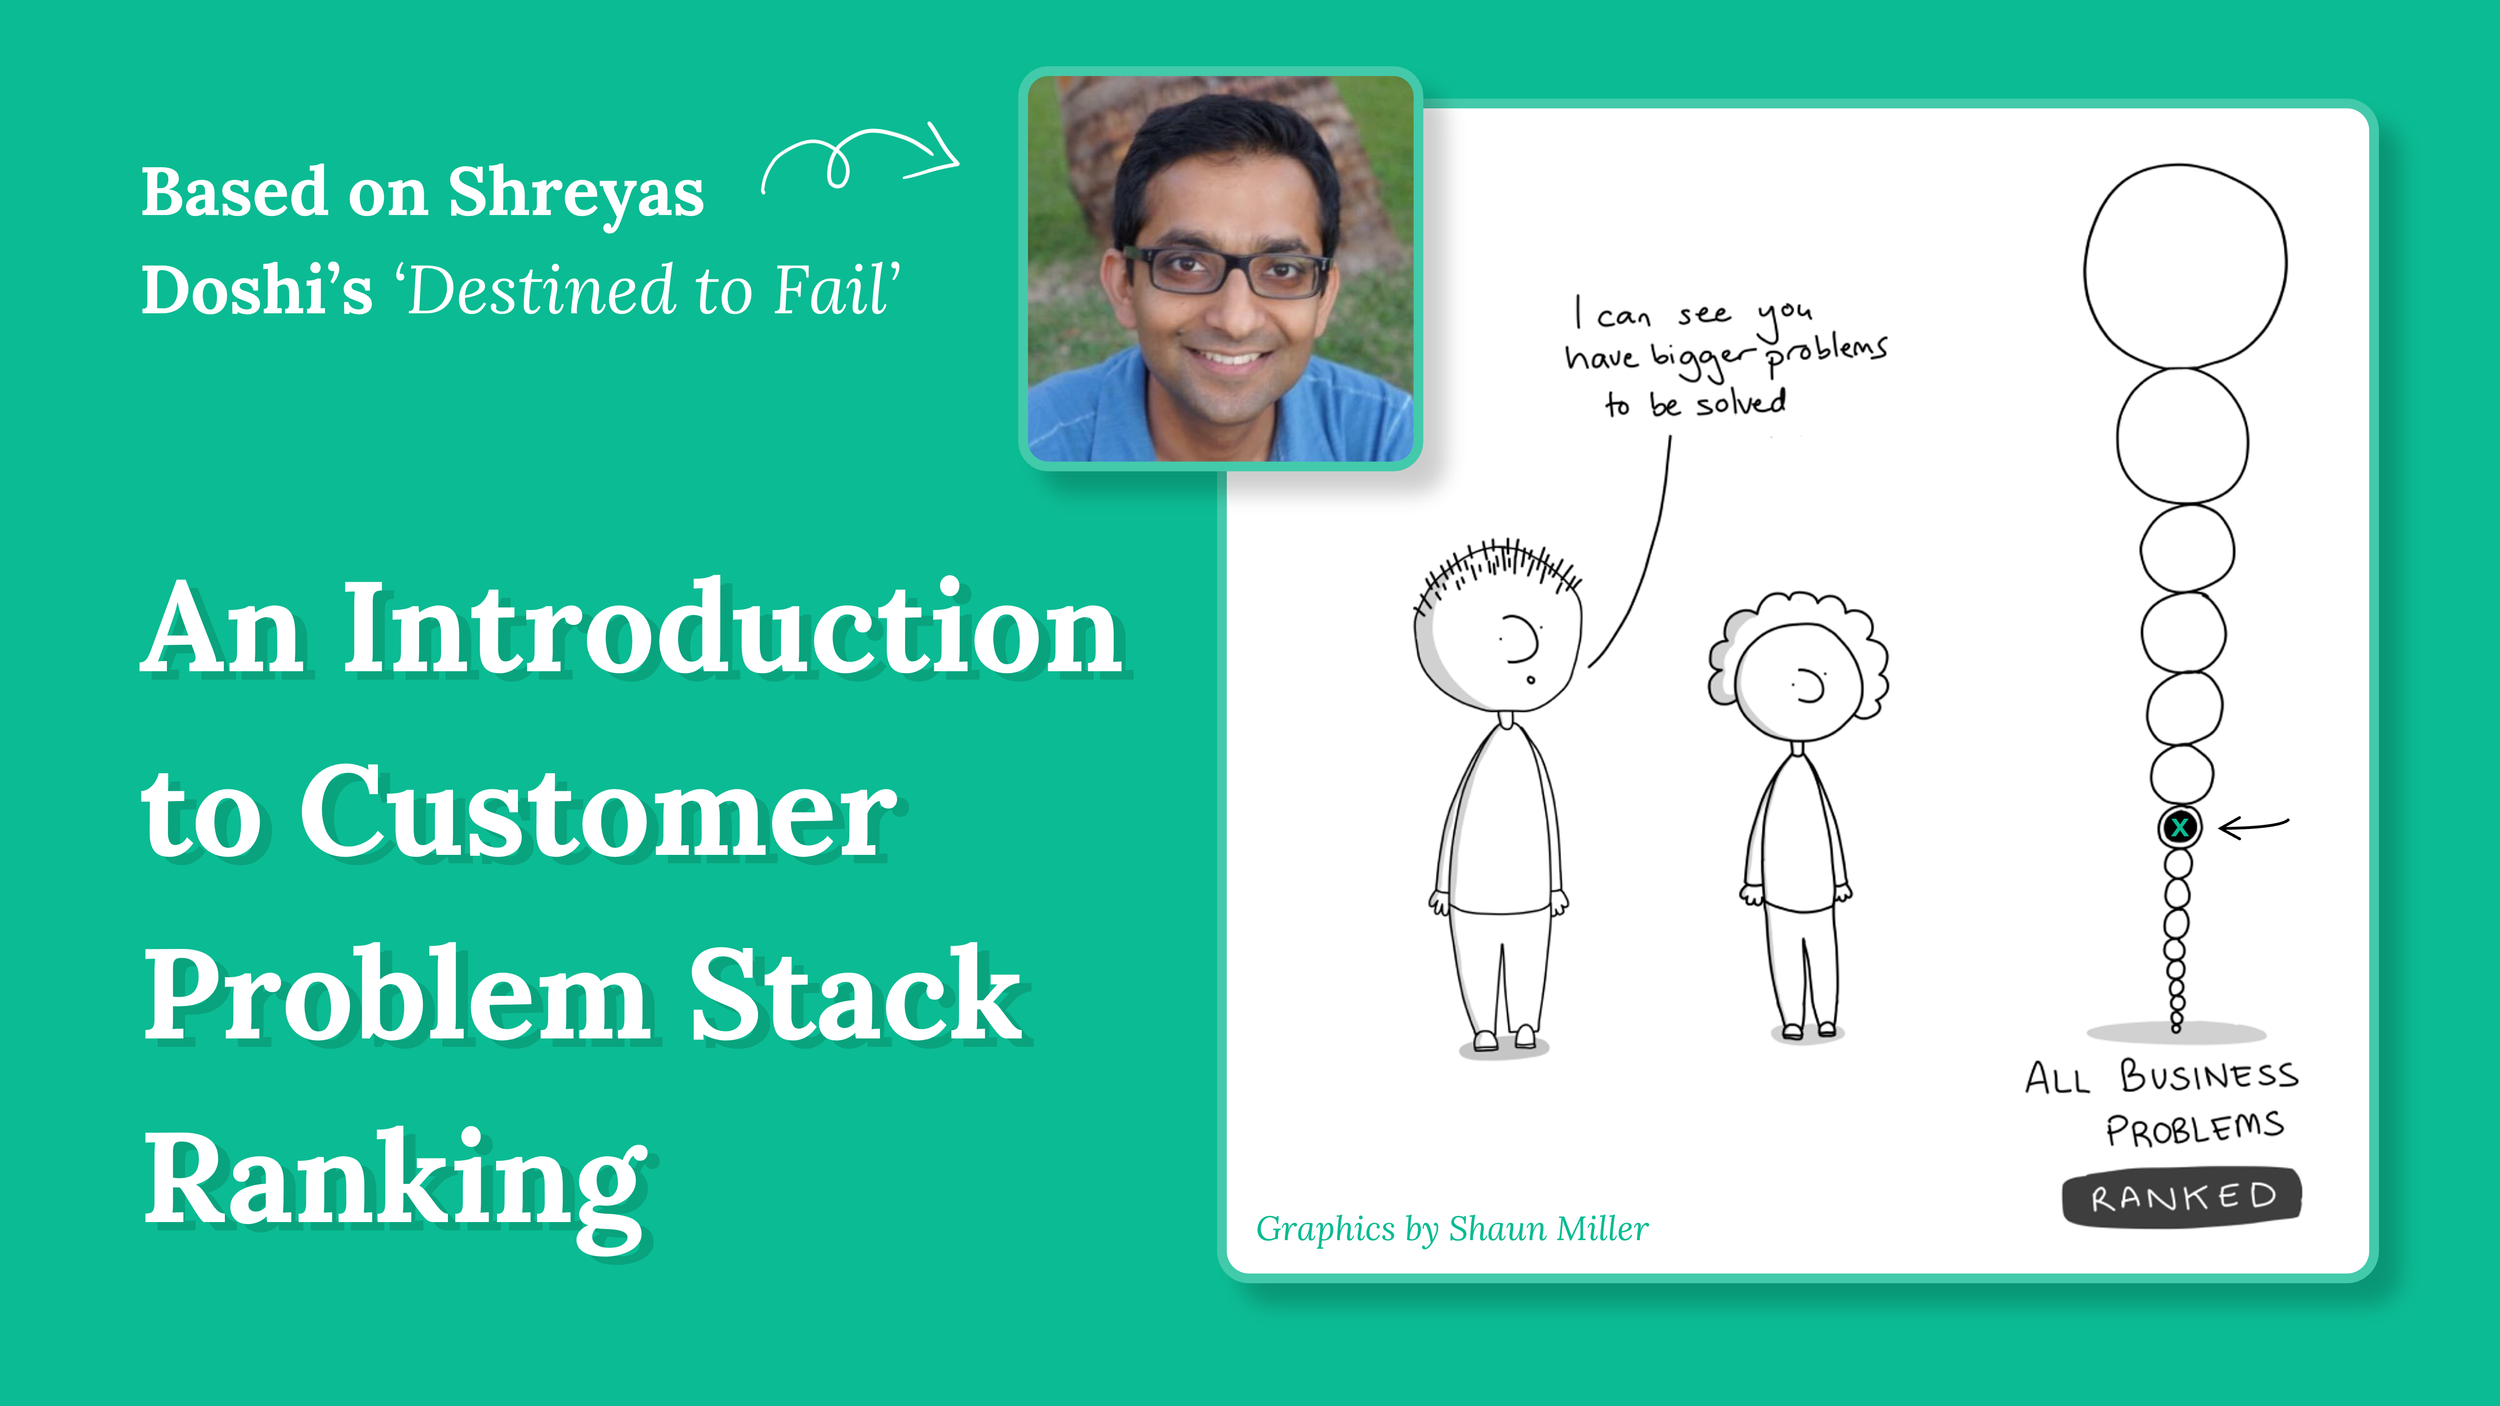
We struggled to get our first customers when we launched OpinionX, even after 150+ interviews to work out what their problems were. We gathered every problem mentioned in those interviews, put them into a pairwise ranking survey, and within two hours could see that the problem we had been focused on was ranking dead last. The results also showed the product was well suited to 5 of the highest-ranked problems, so we changed our website messaging and had our first paying customers within a week. The full story is in Customer Problem Stack Ranking.
Roadmap prioritisation at Safe.Global
Safe.Global builds wallet and account infrastructure for the Ethereum blockchain. The crypto industry is participatory by nature, and people expect to vote on the development of the tools they use. The Safe team uses OpinionX to run quarterly roadmap prioritisation surveys, where community members use paired voting to help identify the right problems to solve next.
“We knew our old process wasn’t a very solid approach to say which things should be prioritized. With OpinionX, my team are a lot more confident because we can sort our whole roadmap by the problems users say are most important to them.”
The Wikimedia Foundation product roadmap survey
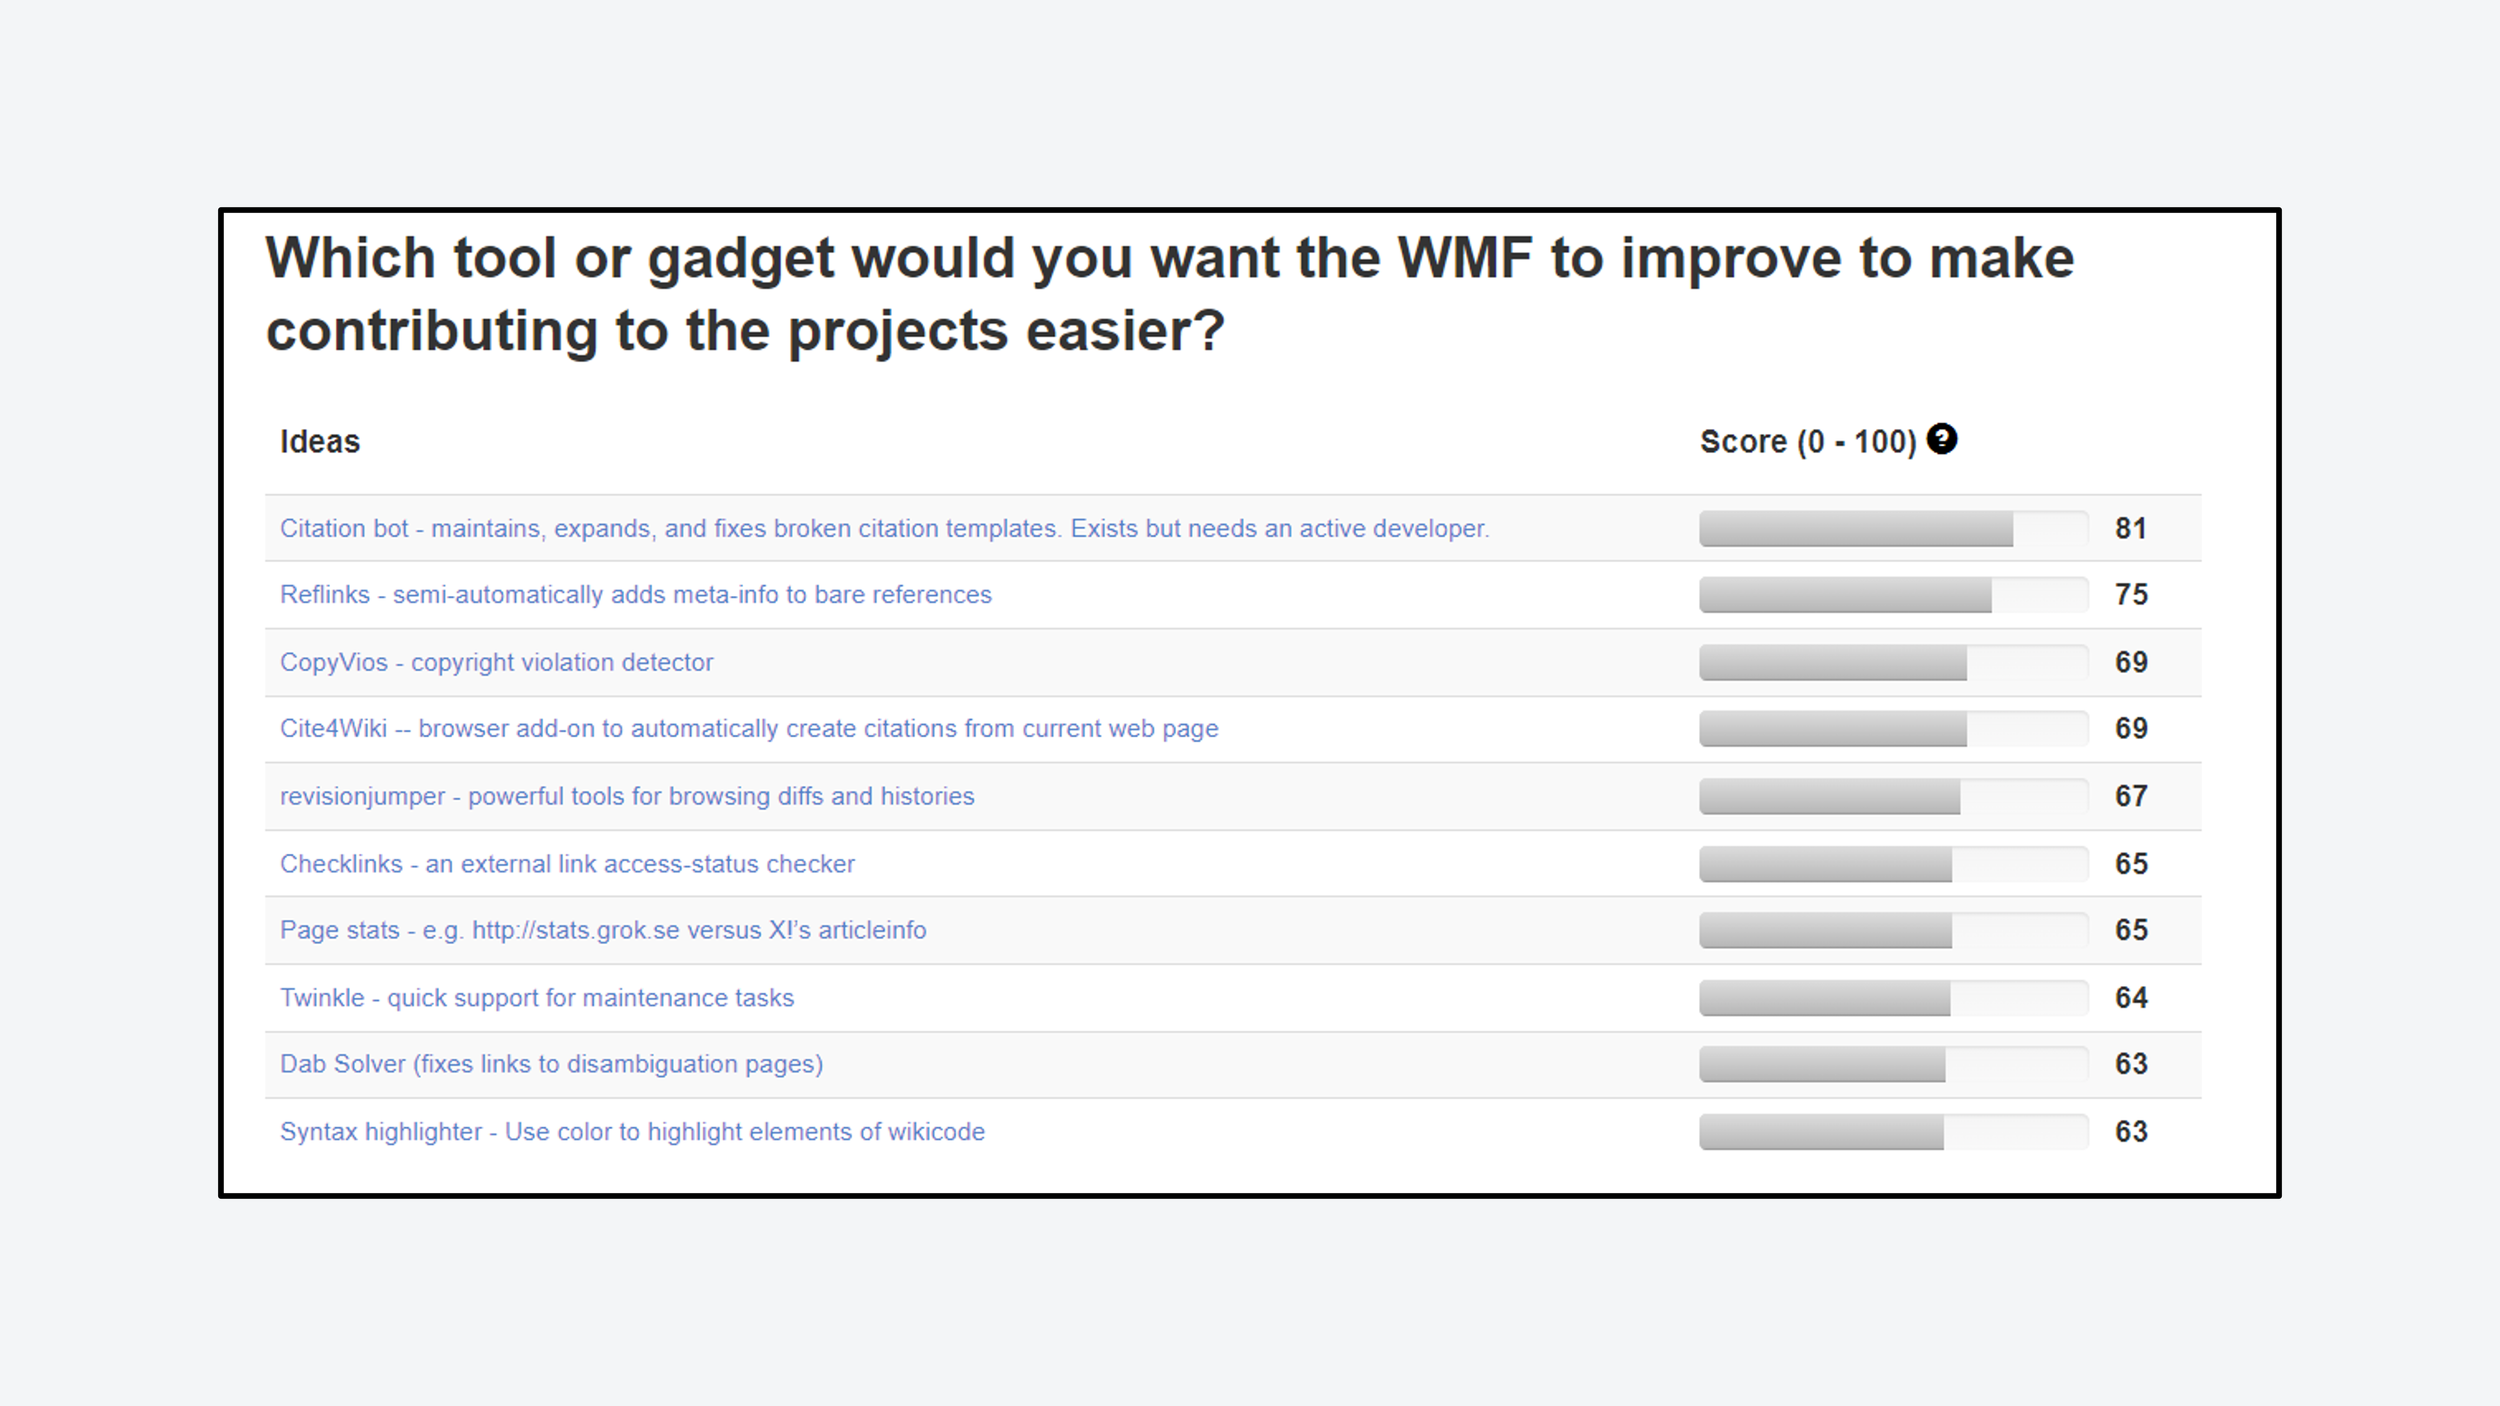
In 2014, the Wikimedia Foundation ran a roadmap prioritisation survey to decide which new tools to build for the Wikimedia community. Over 30,000 votes were cast.
Player rating on Chess.com
Chess.com is the world's largest chess community. It uses a pairwise ranking format to rate players, since each game is a head-to-head comparison ending in a winner and a loser, or sometimes a tie. Glicko-2 scores and ranks players, starting at a baseline of 1500 points and moving with results.
Idea validation at Stripe
Most companies keep their validation techniques quiet. Shreyas Doshi, a former product leader at Stripe, published a post called "Destined To Fail" explaining why most people are bad at validating ideas, and his fix was to get customers to comparatively rank their problems, so you can prove whether the problem you're solving sits high or low on that customer's list of priorities. The full story is here.
Academia and formal research
Pairwise ranking has a long history in academic settings. Its use in user research and executive decision-making is much more recent. Teams at Disney, Google, LinkedIn, Shopify and Amazon use OpinionX for pairwise ranking surveys internally with colleagues and externally with customers, and academics use it across social impact, educational engagement and medical research.
How do I design a pairwise ranking survey?
Whichever pairwise ranking tool you pick, the survey design follows the same shape. Two requirements and two suggestions.
1. The comparison question
What lens should participants use to interpret the pair they're voting on? The six most common:
Preference. Which do they like most?
Pain. Which is a bigger unmet need?
Value. Which is worth most to them?
Risk. What concerns them most?
Motivation. Which is a bigger driver of action?
Friction. Which is a bigger barrier to action?
Once you pick a lens, pick the comparison context. Take "value" with "the customer's experience of my product" as the context, and the two join to make a question like "Which of the two features below delivers more value for the money in our product?"
2. The comparison options
Next comes the list of options for the head-to-head votes. Following the question about ranking features by perceived value, the list should include every feature the product offers today.
One of the most common ways user researchers use pairwise ranking is to get customers to vote on pairs of problem statements, following a format called Customer Problem Stack Ranking. You can also collect new options from participants mid-survey if you want to crowdsource the list.
3. Participant identifiers
Always include a way to identify participants. OpinionX pairwise ranking surveys are anonymous by default, but you can add an identifier question to collect names, emails or usernames.
This matters at analysis time. Once you know the top-ranked option, you'll want to know which individuals voted it first so you can interview them and understand why. That is the Discovery Sandwich.
4. Segmentation data
Ranking preferences only works cleanly with a homogeneous pool of participants, which almost never happens. For most projects the best insights come from segmenting results to see how preferences change by group, such as pricing plan, region or seniority.
To plan for segmentation, include a couple of multiple-choice questions in your survey. On OpinionX you can filter and segment ranked results by tapping any bar chart on the results page.
What is the history and origins of pairwise ranking?
Pairwise ranking started in psychology, not data science or mathematics. In 1927, the American psychologist L. L. Thurstone published A Law of Comparative Judgment in Psychological Review, describing a scientific approach to pairwise rankings. The paper initially framed the method as a way to compare objects with measurable properties, like weight.
Thurstone is better known for multiple-factor analysis and his theory of Primary Mental Abilities, which influenced the hierarchical structure of modern intelligence tests.
Two years later, Thurstone released "The Measurement of Psychological Value", which showed how pairwise ranking could measure subjective qualities like attitudes and values based on their importance to people.
The work took off quickly. The same year as Thurstone's second paper, the German mathematician Ernst Zermelo published a model for ranking chess players in incomplete tournaments using pairwise ranking. Zermelo's work inspired the American duo who published the Bradley-Terry model in 1952, a mathematical approach that went on to influence competitive sports, academic journals and today's machine-learning algorithms.
While Bradley-Terry was taking off, the Hungarian-American physics professor Arpad Elo was also drawing on Zermelo's work, designing a chess ranking method in the early 1960s called ELO. It became the best known paired algorithm ever created. Its descendants include Glicko in 1995 and TrueSkill in 2005, still used in games including Pokémon Go, Chess.com, Dota and Counter-Strike.
Frequently asked questions
What is the best free pairwise ranking tool?
For a survey with multiple participants, OpinionX is the only free pairwise ranking tool on this list that combines unlimited options, segmentation and exports, capped at 25 participants per survey on the free tier. For ranking your own priorities with nobody else voting, PickedShares and Pairwise-Ranking-App are both free and simpler. AllOurIdeas is free and open source but no longer maintained.
How many pairs are in a pairwise ranking survey?
The total is n(n-1)/2, where n is the number of options. Ten options produce 45 possible pairs, 15 options produce 105, and 30 options produce 435. Any pairwise ranking tool handling more than about 20 options should offer partial ranking, where each participant sees a sample of pairs instead of all of them.
How is a pairwise ranking score calculated?
Most pairwise ranking surveys use win rate, which counts how often an option won out of all the pairs it appeared in and shows the result as a 0 to 100 number. An option winning 8 of 10 pairs scores 80. The alternatives are probabilistic models like ELO and Glicko, mostly used in competitive gaming, and the manual matrix, which only works for one voter and a short list.
Who invented pairwise ranking?
L. L. Thurstone published A Law of Comparative Judgment in Psychological Review in 1927, giving psychology a formal model for scaling paired judgments. Ernst Zermelo, the Bradley-Terry model and Arpad Elo's ELO rating all built on that foundation. The method reached user research and product decision-making decades later.
Over 42,000 researchers and product people get one method breakdown like this each week in The Full-Stack Researcher.
Create a pairwise ranking survey in about 3 minutes. Every question type and every analysis feature is unlocked on the free tier, capped at 25 participants per survey, so you can run a full study and read the results before deciding whether to pay.