
“The paired comparison method ranks a list by showing people two options at a time and recording which one wins. It handles lists too long for drag-and-drop ranking, and it puts numbers on preferences that had none. This guide covers the mechanics, the three scoring methods, six tools scored against each other, the sample size formula, and where the method came from in 1927.”
What is paired comparison?
Paired comparison is the process of comparing a set of options using head-to-head pairs to judge which one is the most preferred overall. Also known as "paired ranking", it turns up in preference research, strategic decision-making and large-scale voting.
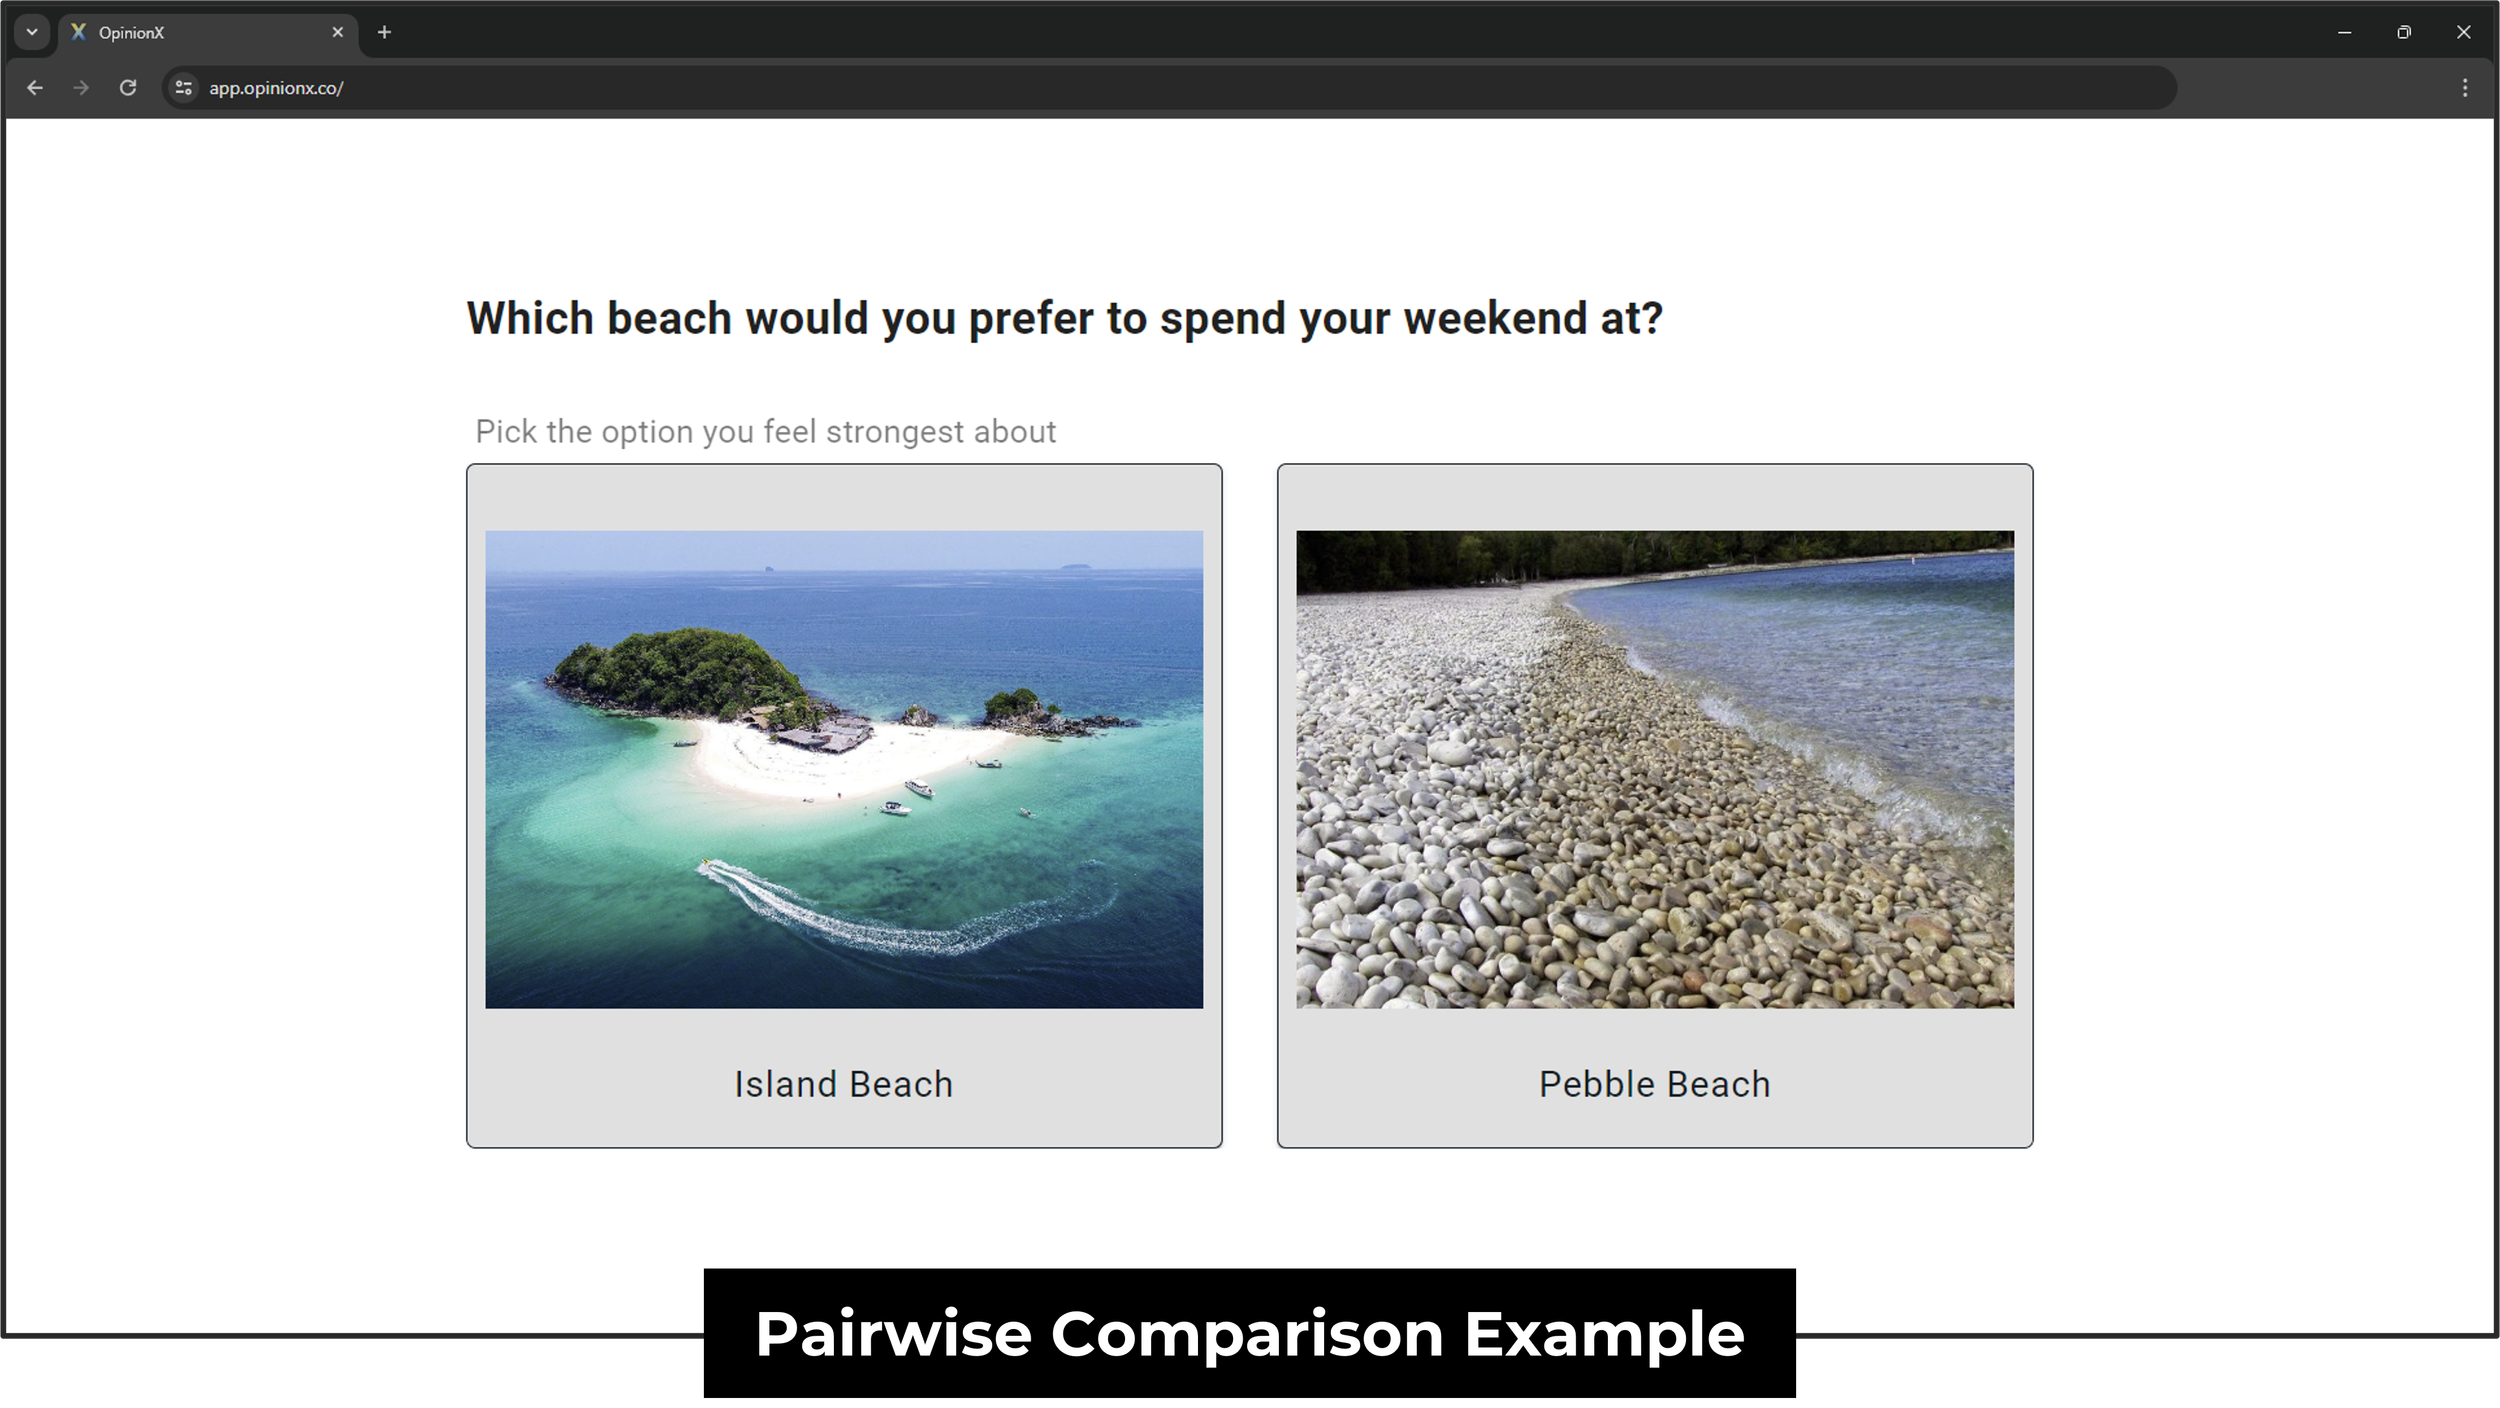
This guide covers every common question about the paired comparison method:
What is paired comparison?
How does paired comparison work?
Why do people use paired comparison?
How do you calculate paired comparison results?
What are the best survey tools for paired comparison?
Are there different types of paired comparison?
What sample size do I need for a paired comparison survey?
Examples of paired comparison in real-life scenarios
How do I design a paired comparison survey?
What is the history and origins of paired comparison?
How does paired comparison work?
The paired comparison method works by breaking a set of options down into a series of head-to-head votes. Once a participant picks their preference from the two options, their vote is recorded and a new pair is shown for the next vote.
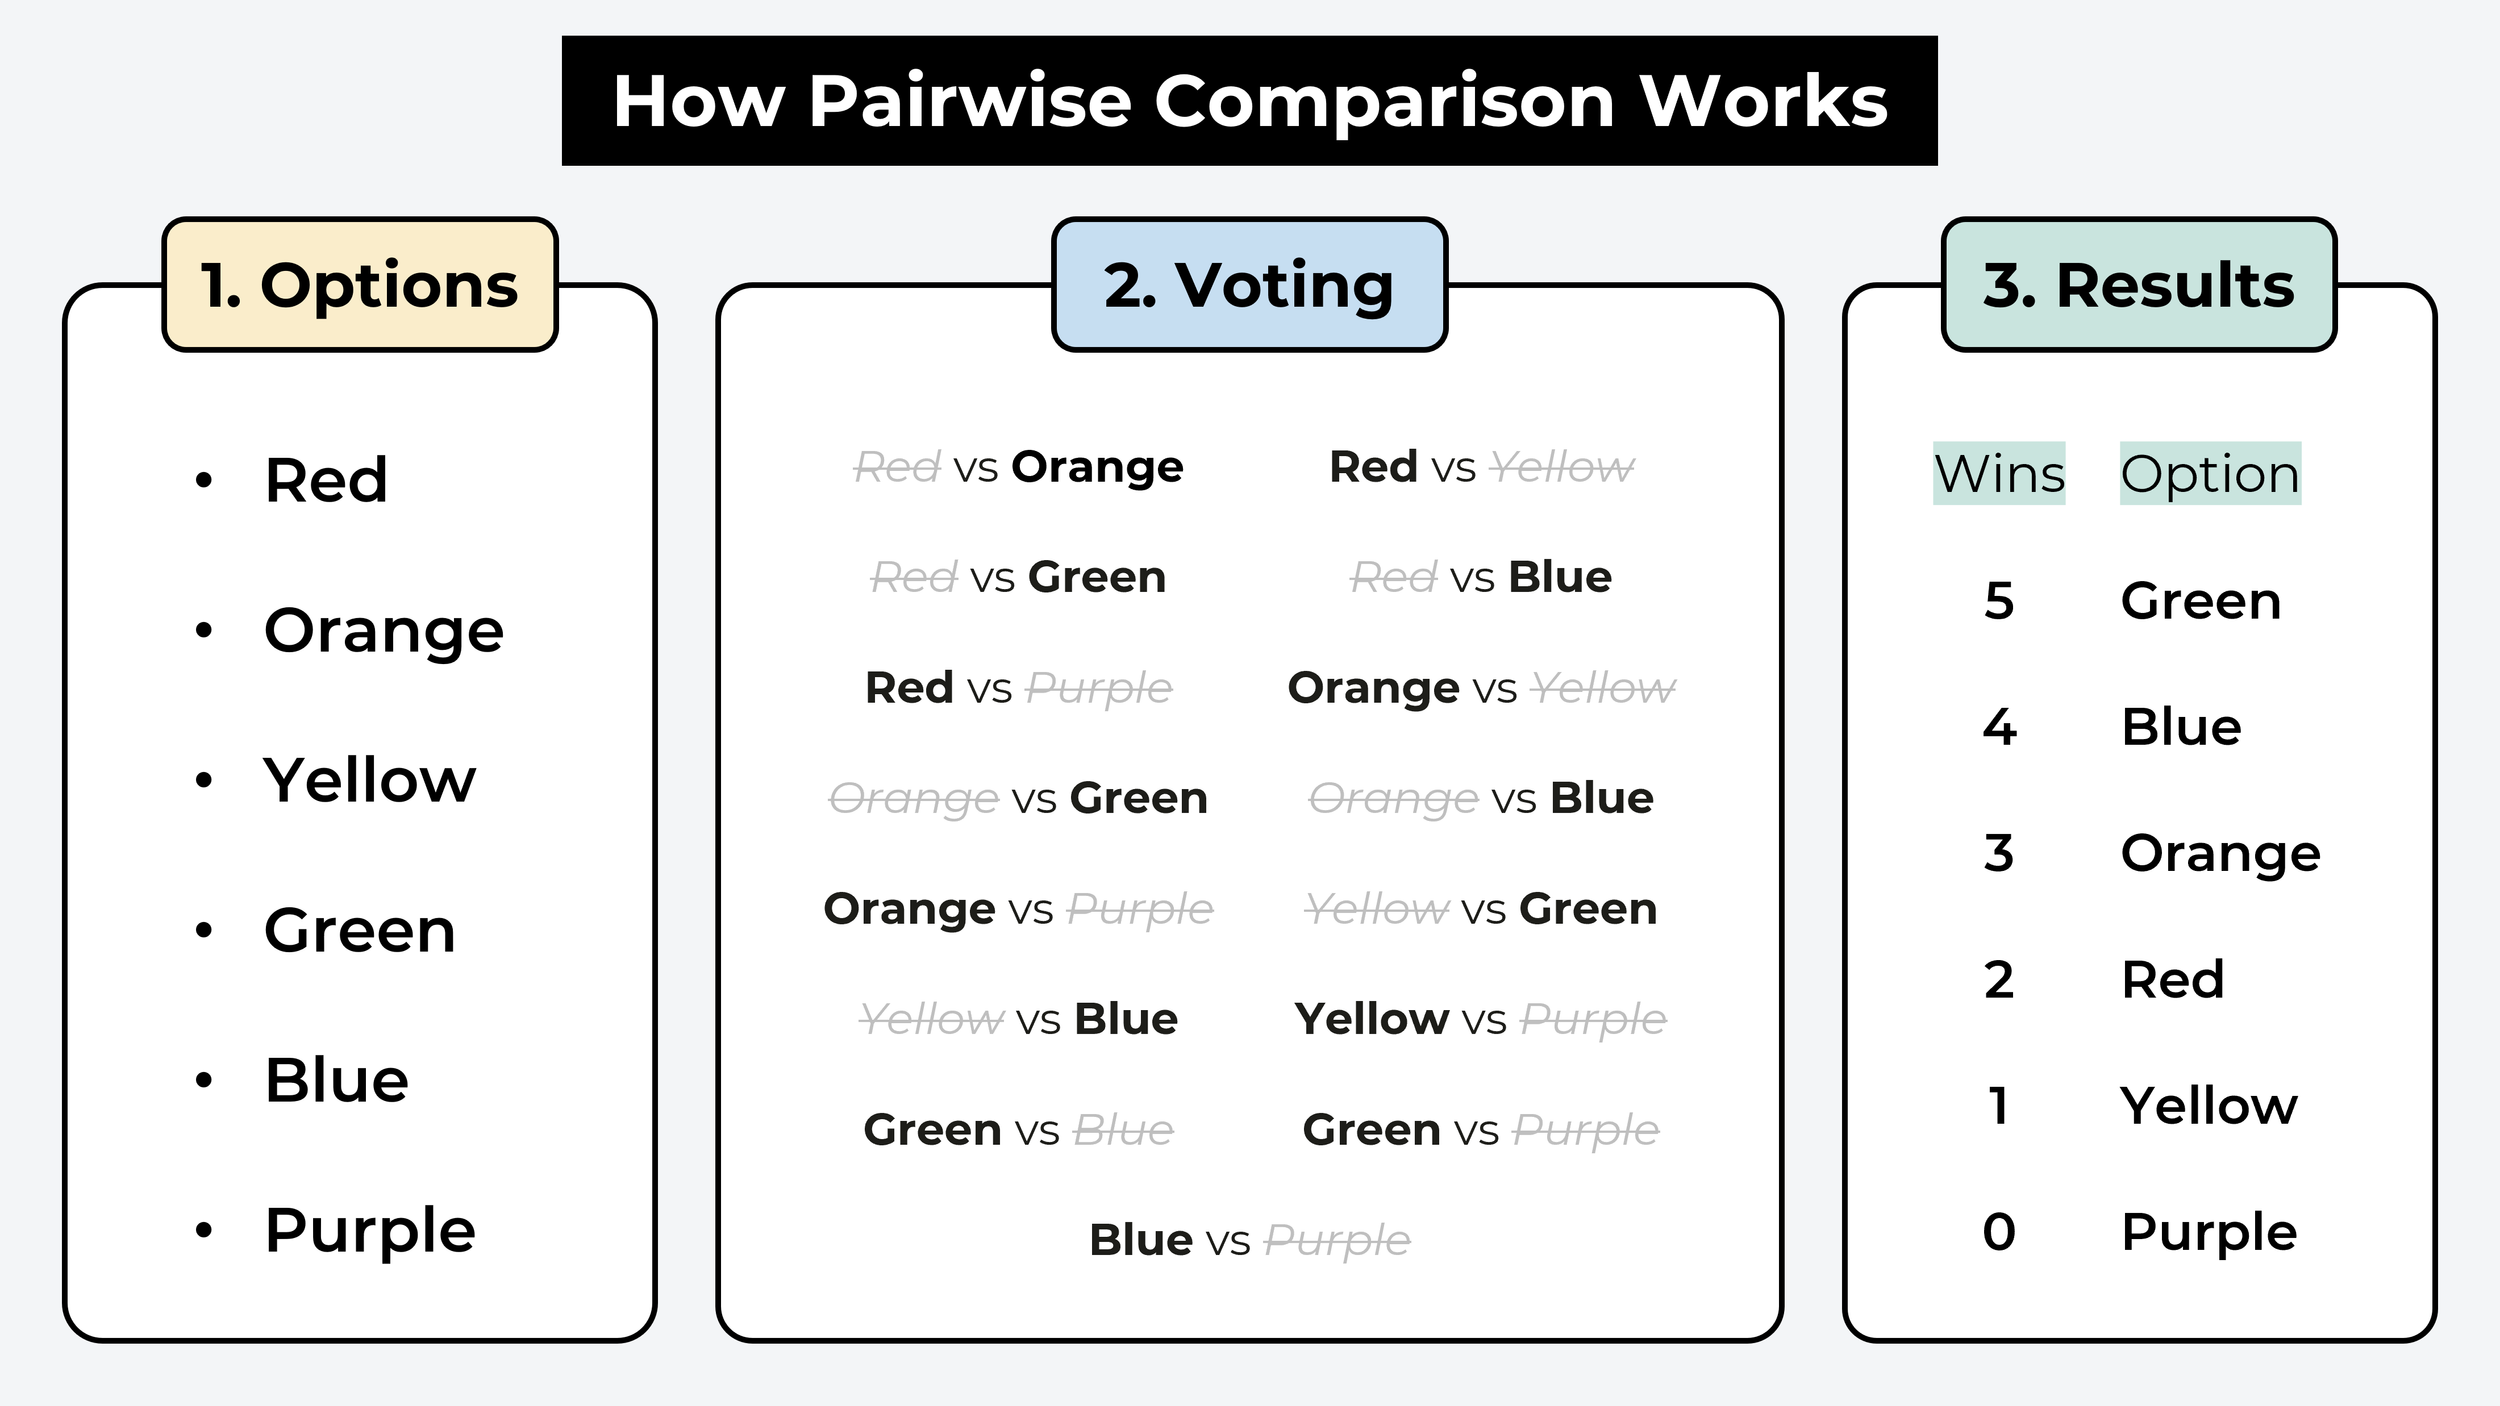
Say you have 20 candidate names for a new podcast. Nothing about a podcast name is measurable, so there's no property to sort on, and asking anyone to put all 20 in order produces either paralysis or a careless answer.
Split those 20 names into pairs instead. Each choice takes a second, the whole exercise runs a couple of minutes, and what comes out the other end is an ordered list from most to least preferred.
Two ways to run it. One person votes on every possible combination, which maps that individual's preferences exactly. Or a group each votes on a sample of pairs, and the samples combine into the group's collective ranking.
The total number of possible paired comparisons from a list of options is n(n-1)/2, where "n" is the number of options. A set of 10 options has 45 possible paired comparisons, or 10(9)/2. Further down, this guide explains the difference between a survey showing every possible pair and a partial ranking survey.
Why do people use paired comparison?
Five reasons the paired comparison method keeps getting picked over a standard ranking question.
Easy input. Nobody needs briefing on how to pick between two options. The decision is instant even when the options themselves are technical or unfamiliar.
It works on a phone. Paired comparison beats drag-and-drop ranking on a small screen by a wide margin. Around 58% of survey responses are now collected on mobile devices (SurveyMonkey), and mobile surveys have been found to run about 10% higher completion than desktop (Kadence).
Long lists. Drag-and-drop ranking tends to be capped at 6 to 10 options for a reason. Beyond that the mental effort climbs, people abandon the survey, and the ones who stay start submitting straightlined junk to get to the end. The paired comparison method scales from two options to several hundred in one survey.
Numerical results. Text statements and images go in, numbers come out. That conversion is what lets a subjective list survive a room full of stakeholders who want evidence.
It forces a trade-off. Deciding anything means giving one option up to get another. Pairs reproduce that, where a rating scale lets people award everything an 8 and commit to nothing.
How do you calculate paired comparison results?
Paired comparison voting data gets scored three ways. Here they are side by side, with the detail underneath.
| Method | What it outputs | Multiple voters? | Used for |
|---|---|---|---|
| Win rate | A 0 to 100 score per option | Yes | Surveys and research |
| Probabilistic | A rating that drifts from a 1500 baseline | Yes | Competitive gaming and chess |
| Manual matrix | A win count per row | No, one voter only | School math and short personal lists |
1. Win rate
The default, and the one almost every survey platform uses. Count an option's wins, divide by the pairs it appeared in, express the answer as a percentage or a 0 to 100 score. Eight wins from 10 appearances gives 80.
That number has a second reading worth knowing: it's the probability this option beats any other option pulled at random from the same list.

^ Example of paired comparison voting and results (via OpinionX). The results screen shows the Win Rate number under the “Score” column.
2. Probabilistic
Bayesian algorithms read the pattern of votes and estimate each option's standing against a fixed starting point, usually 1500. Every result nudges the number up or down. ELO is the version most people have met, through competitive chess.
Glicko and TrueSkill are the more elaborate descendants, running behind Halo, Counter-Strike and Dota. Games can afford this because players never see the raw number. Survey participants and stakeholders do, and a rating of 1547 tells them nothing they can act on.

^ The formula shown has since been updated to Glicko-2, which adds a variable for outcome volatility.
3. Manual
Two conditions have to hold for pen and paper: a single voter, and a short list.
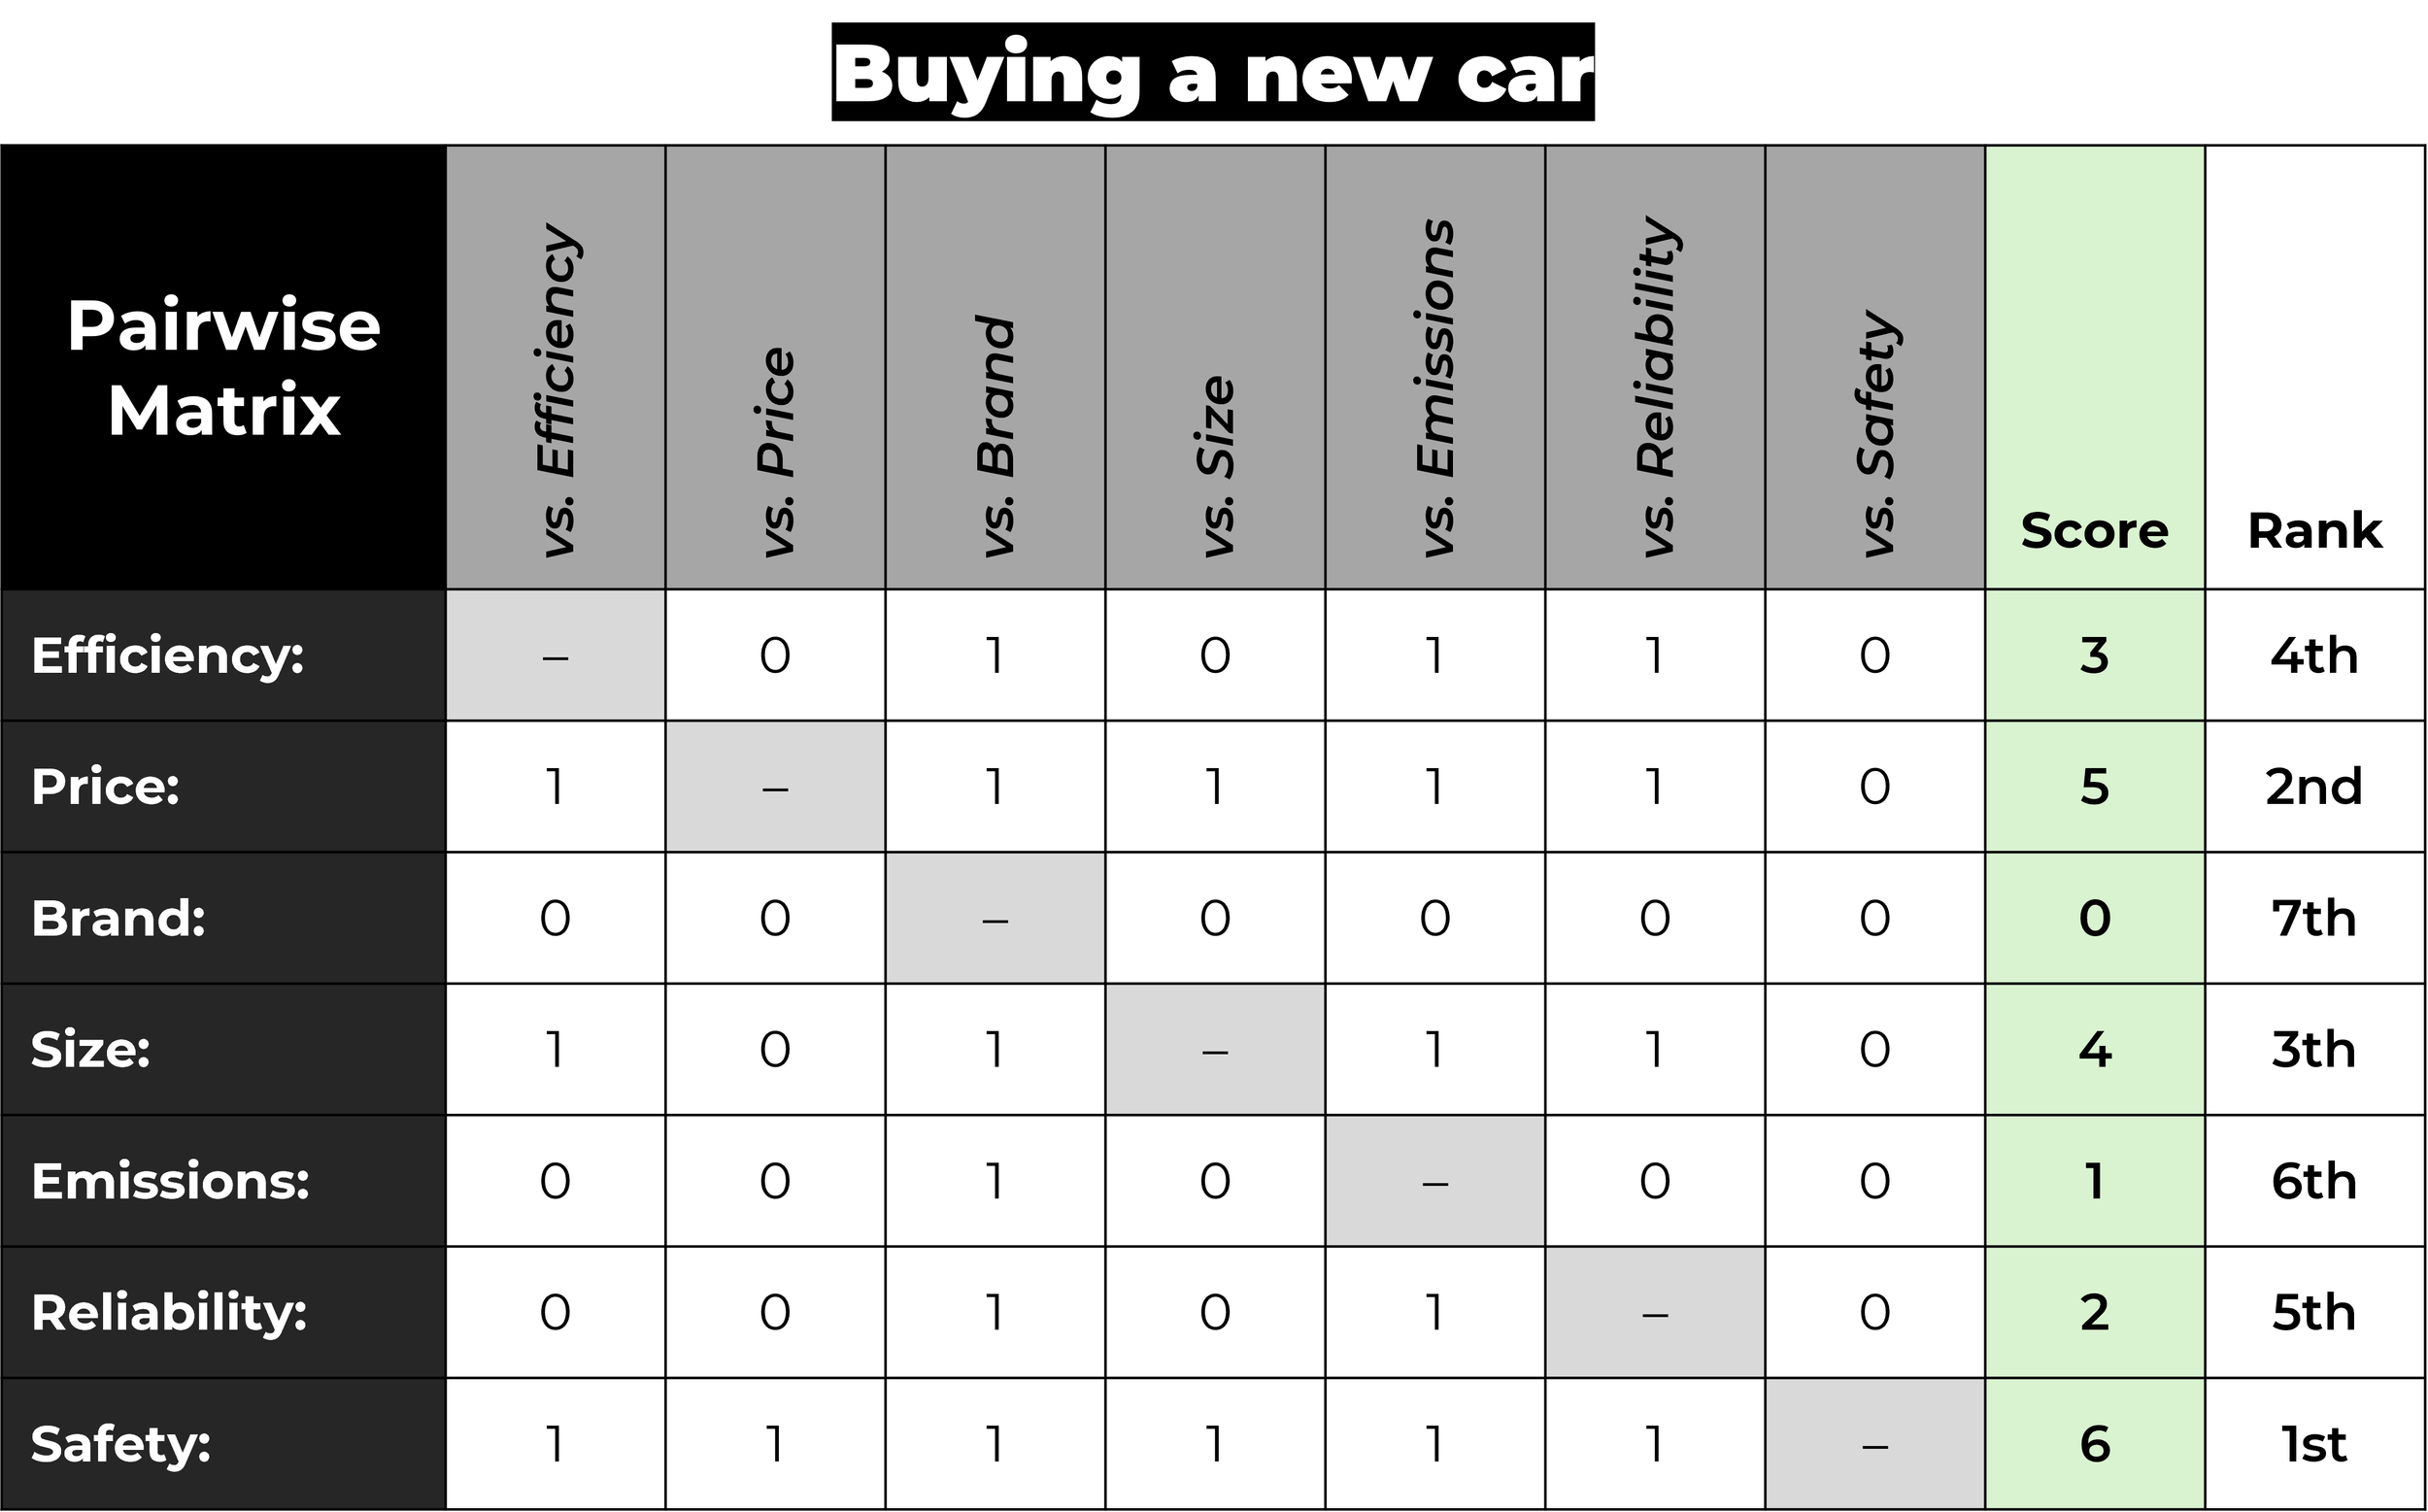
Build a grid with the same options down the side and across the top. Work along one row, comparing that option against each column in turn, and mark 1 for a win, 0 for a loss.
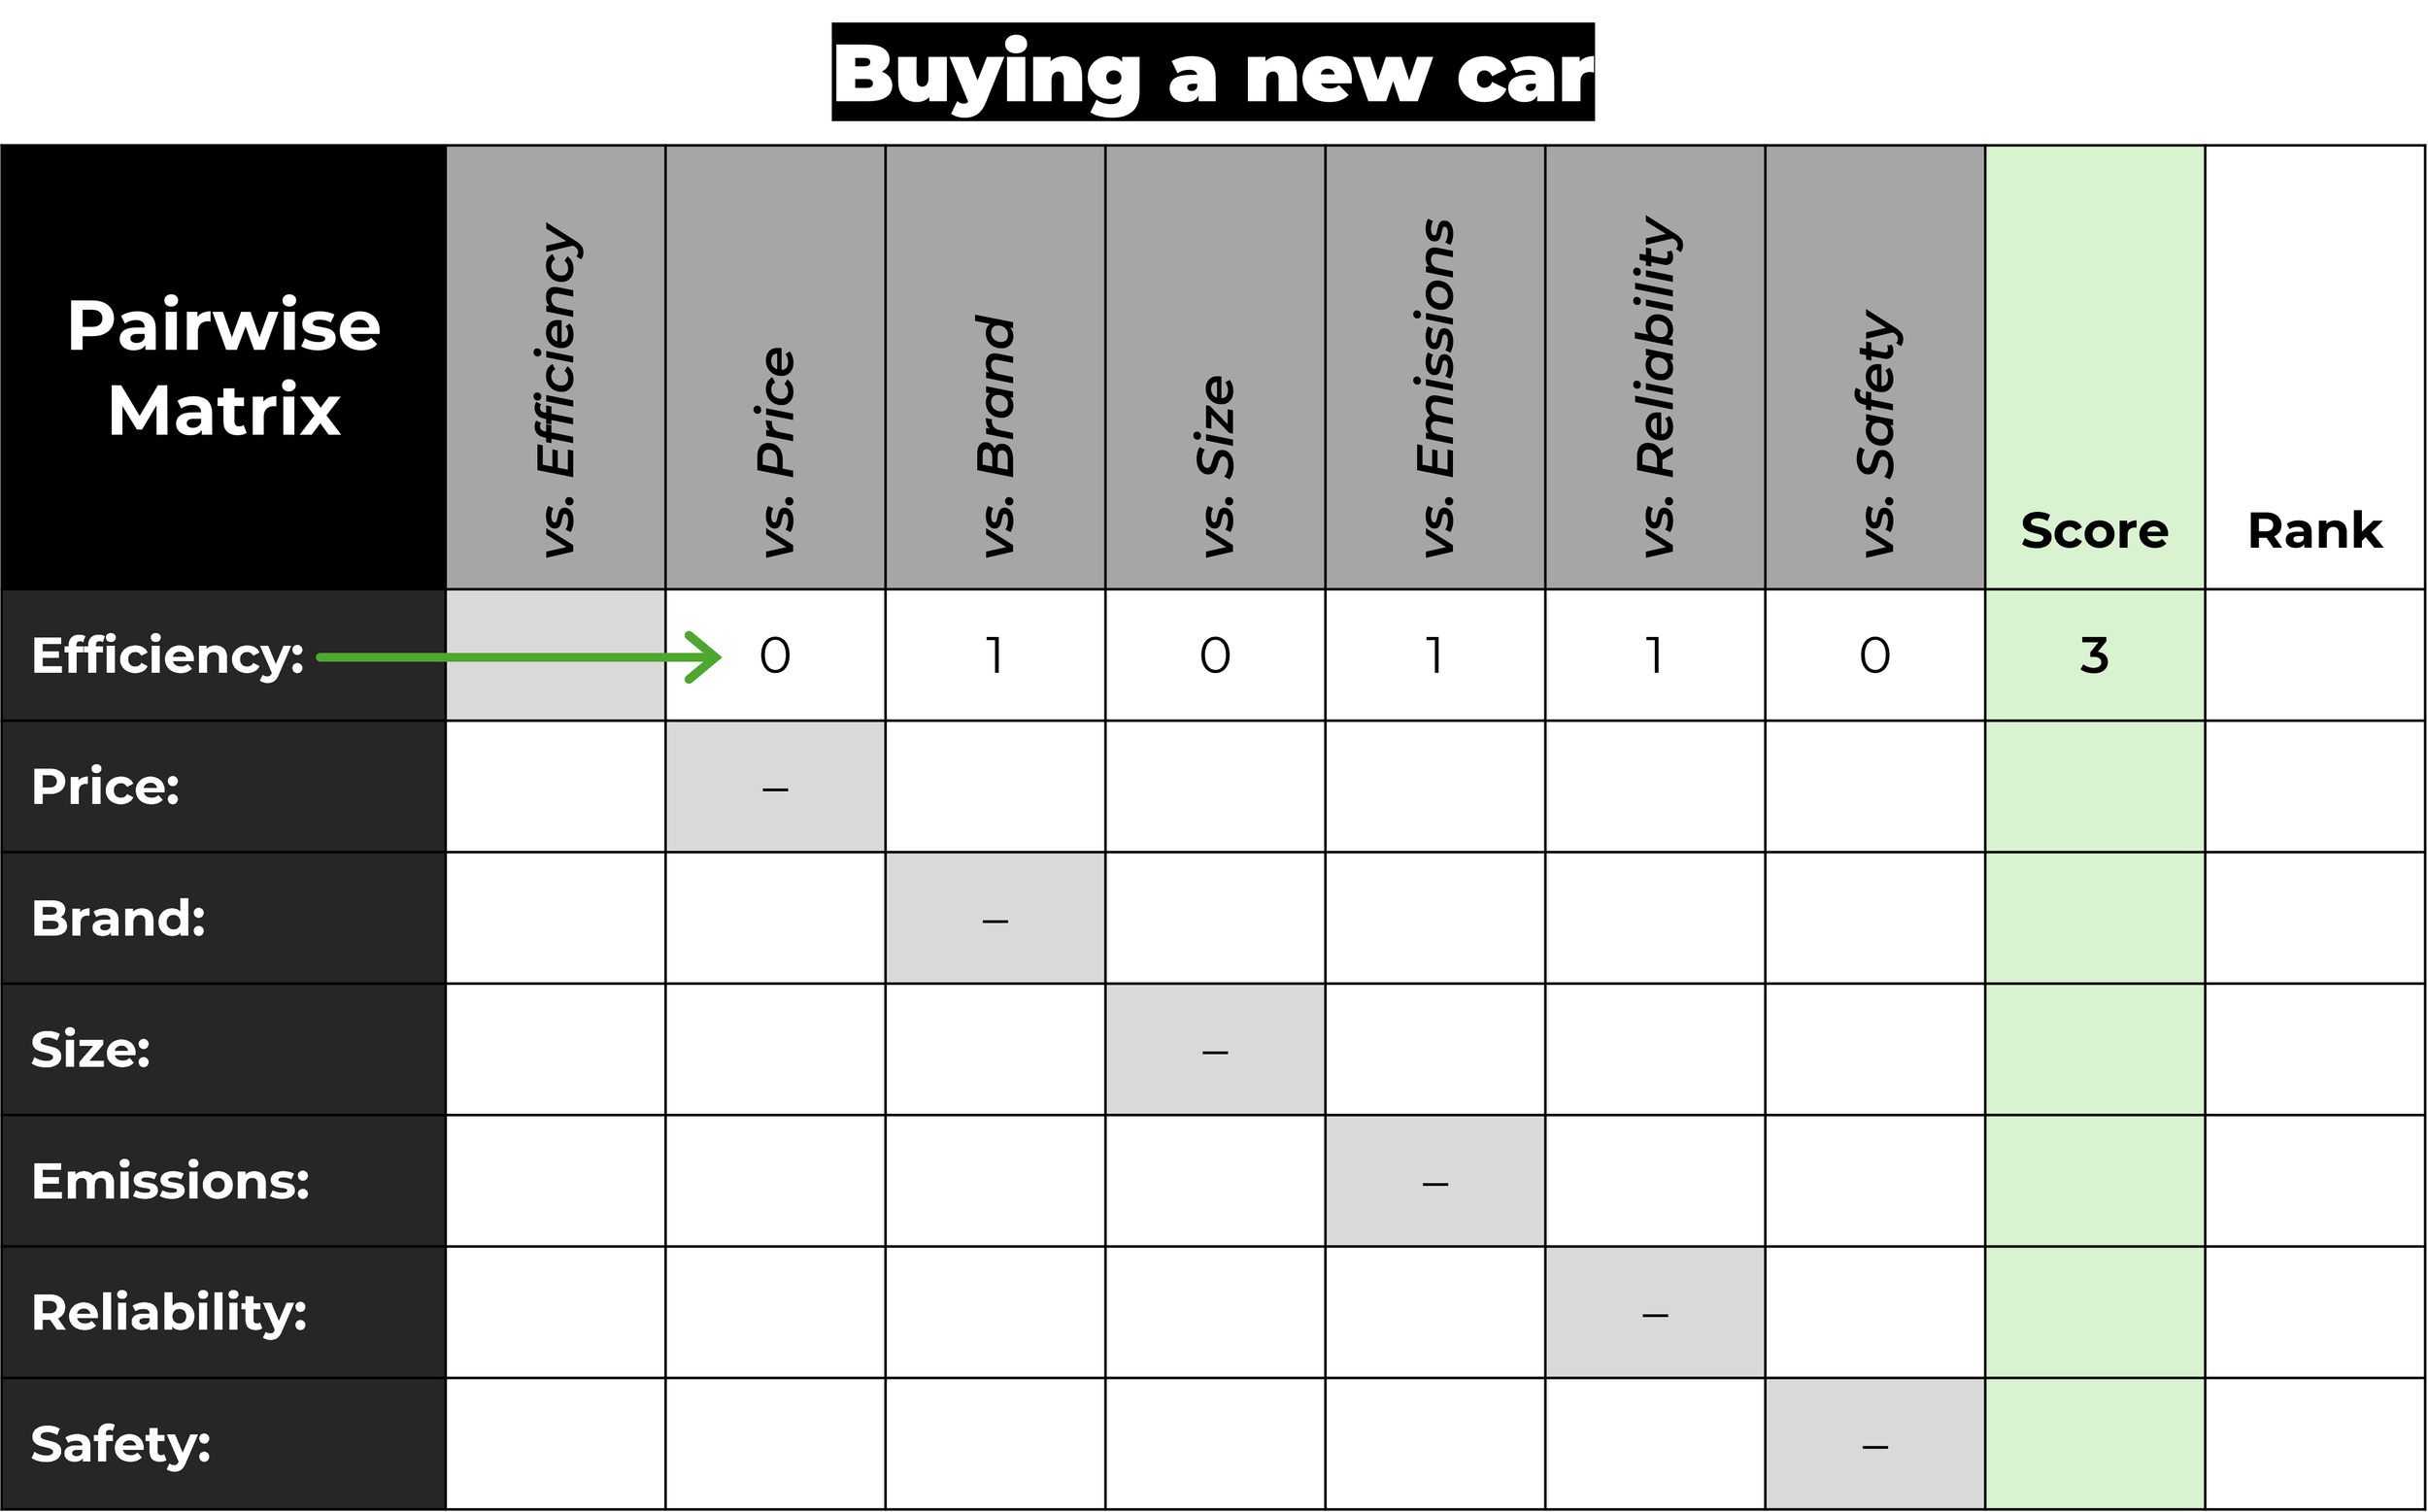
Total each row and sort. Ties are usually handled by awarding 0.5 to both sides. Matrices like this lean on transitivity, meaning a preference for A over B combined with a preference for B over C is taken to imply A over C, without asking.
Of the three, win rate is the most widely used paired comparison method for surveys and research, because it's easy to interpret while still being mathematically sound.
What are the best survey tools for paired comparison?
Six paired comparison method tools, scored on the three things that decide the choice: what it costs, whether you can try it properly, and whether it survives contact with a live project.
| Tool | Price | Trial | Conclusion |
|---|---|---|---|
| OpinionX | 🟢 $900/yr, free tier capped at 25 participants | 🟢 Free tier, every feature unlocked | 🟢 Pick this for multi-participant research |
| PickedShares | 🟢 Free | 🟢 No signup needed | 🟡 One voter only, heavy ads |
| PollUnit | 🟡 Free tier, paid plans billed monthly | 🟢 Free tier, 20 options and 40 participants | 🟡 Fine for a poll, too small for research |
| AllOurIdeas | 🟢 Free and open source | 🟢 Free | 🔴 Unmaintained, no analysis, no exports |
| 1000minds | 🔴 Unpublished, quoted per customer | 🟡 Limited trial, length unstated | 🟢 The right pick for formal MCDM work |
| Pairwise-Ranking-App | 🟢 Free and open source | 🟢 Free | 🟡 One voter only, wins and losses instead of a score |
1. OpinionX

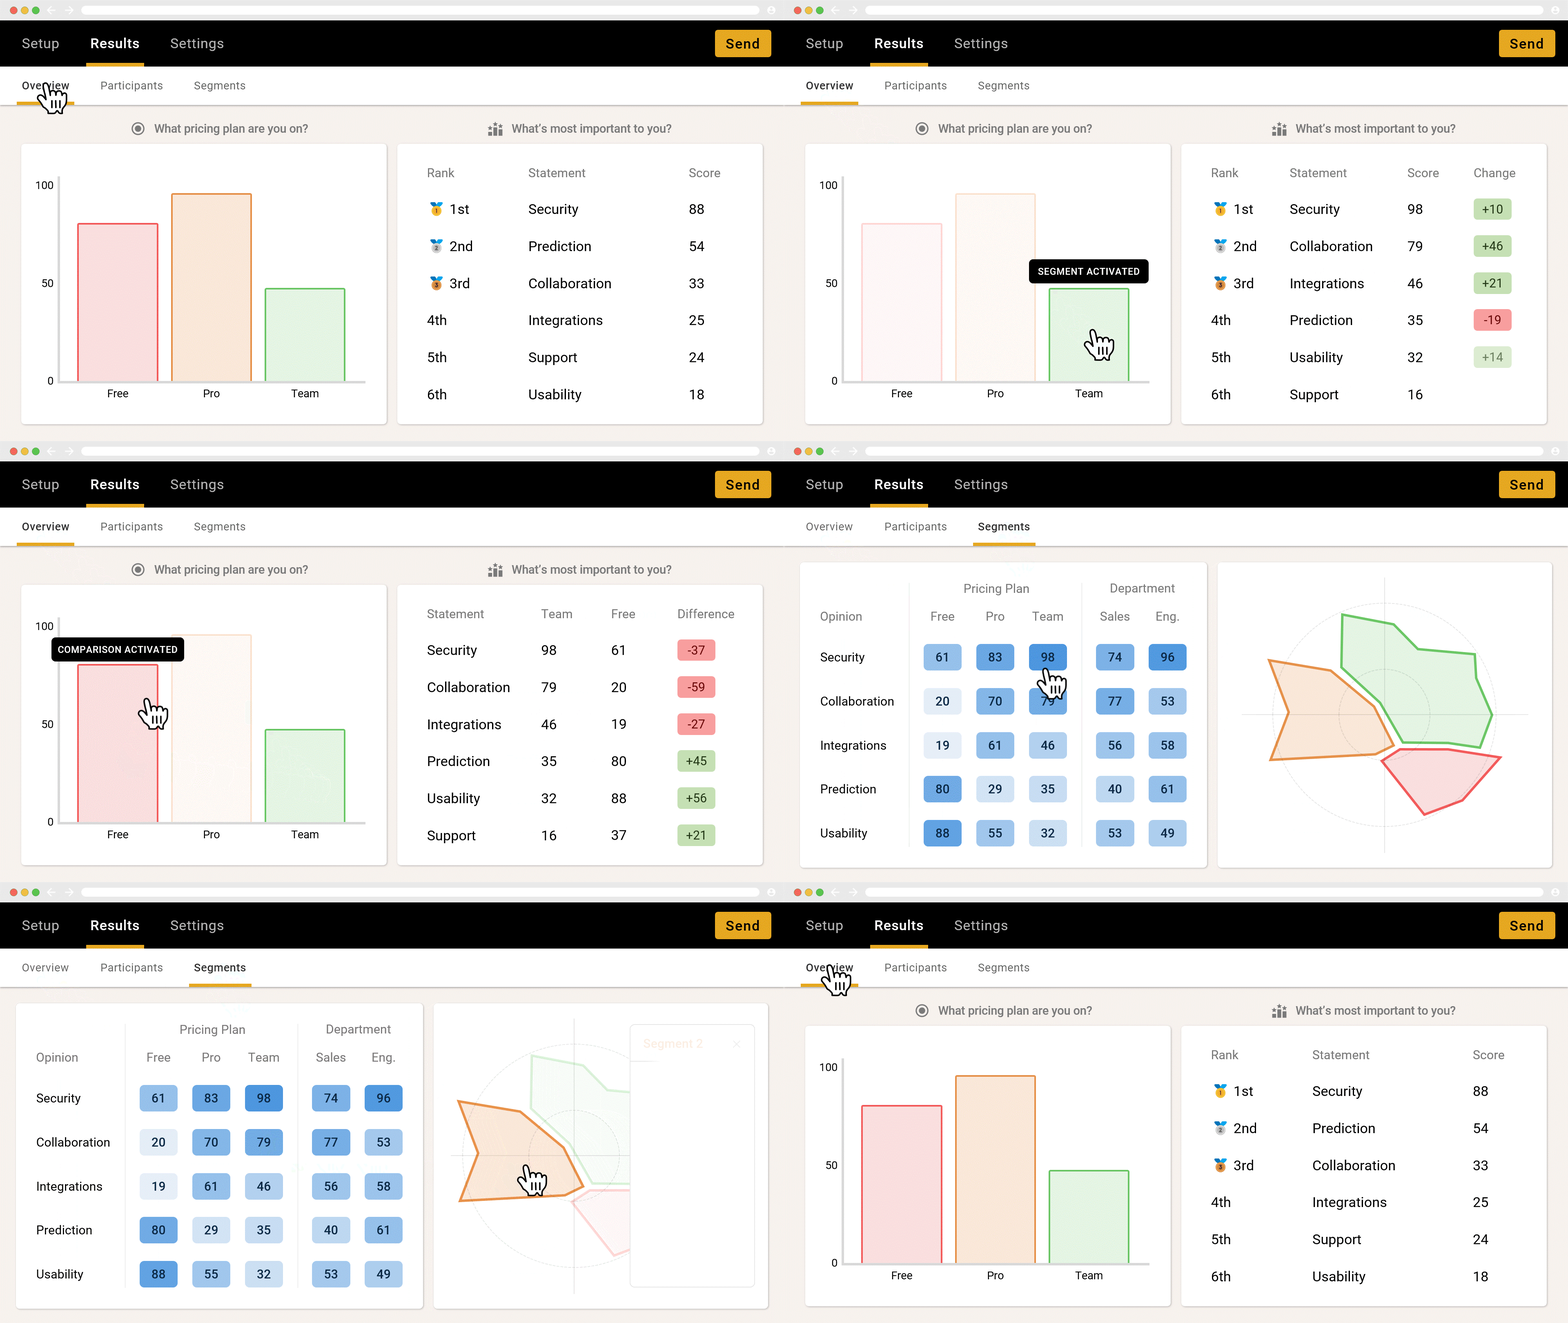
Verdict: the only tool on this list that handles multiple participants, segmentation and exports together.
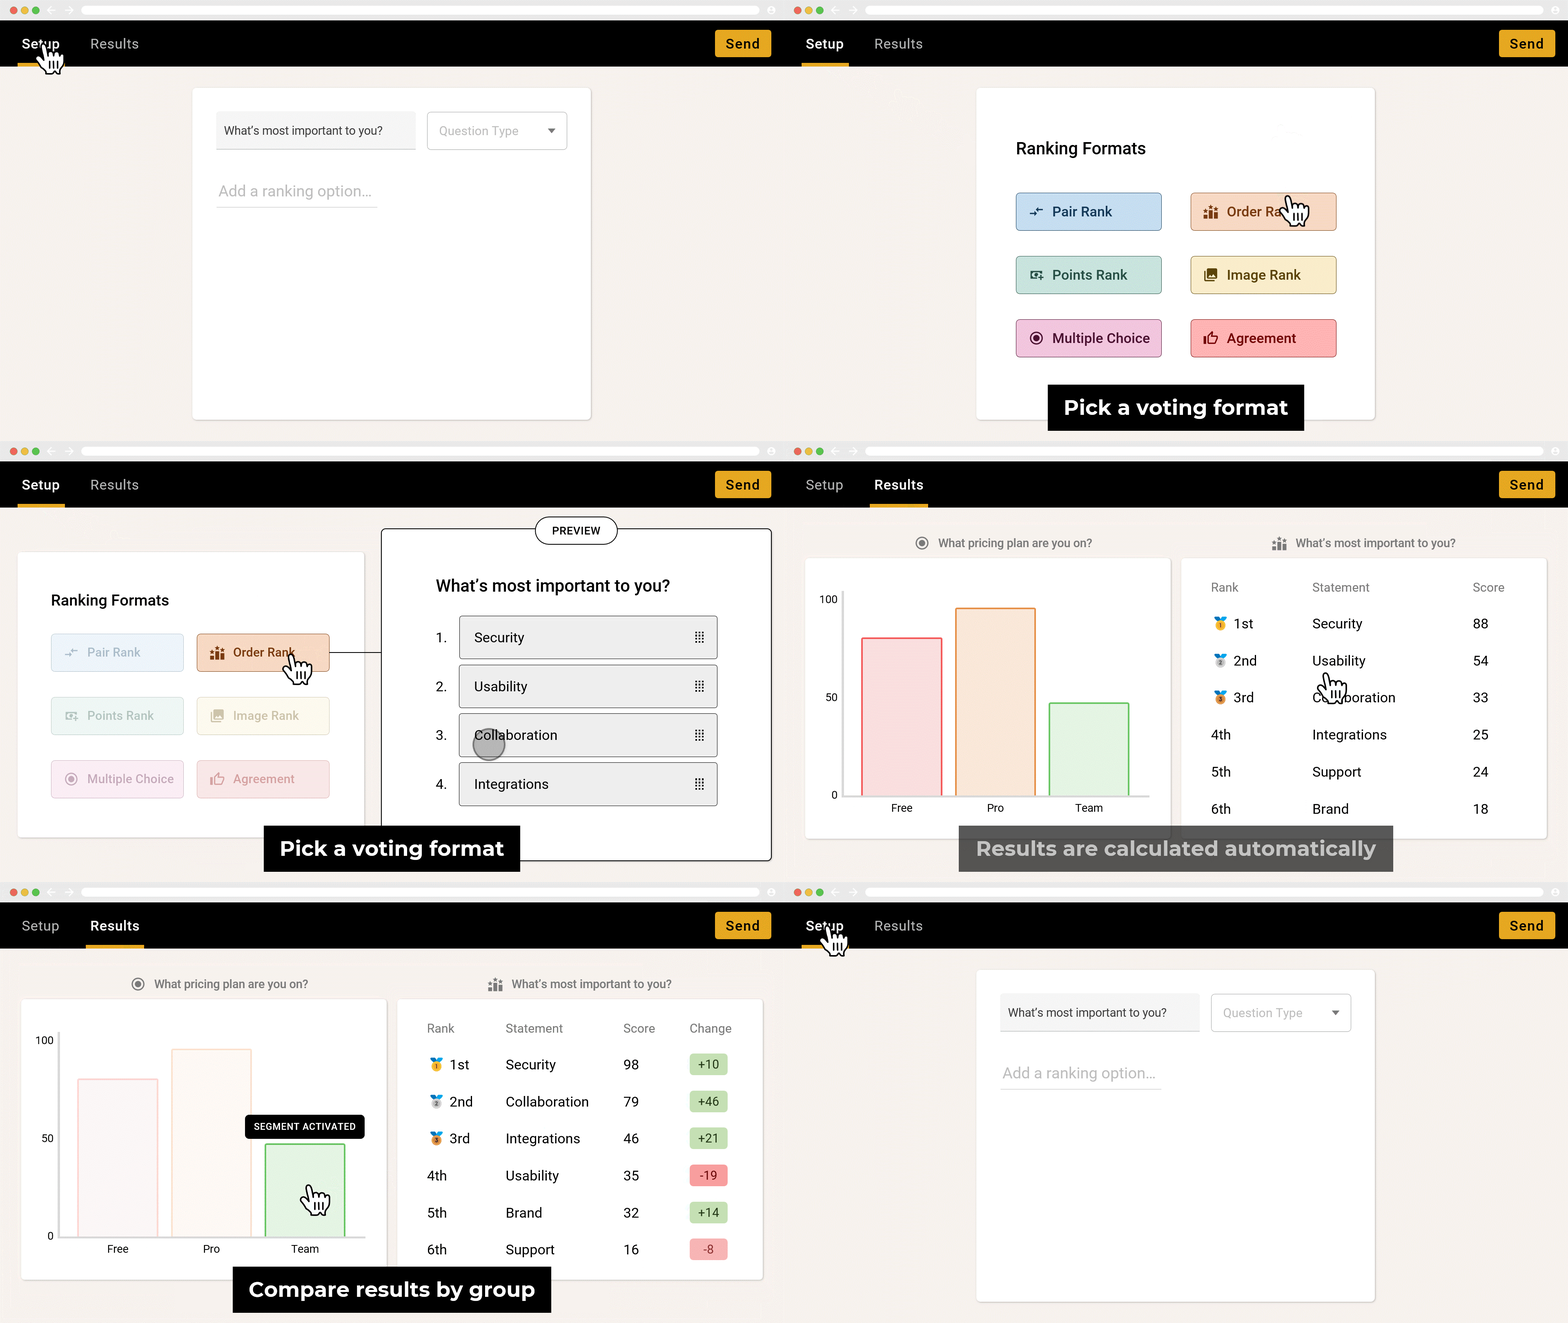
OpinionX runs ranking surveys, including paired comparison. Teams at Disney, Google and LinkedIn use it. "Pair Rank" questions use the win rate scoring method and let you customise the question with settings for forced ranking or a custom number of pair votes per participant.
What the free tier gives you: unlimited surveys, unlimited ranking options, every question type including both text and image formats, and unlimited researcher seats sharing one workspace. The cap is 25 participants per survey. Removing that cap costs $900 a year.
Vote on 10 pairs, then click the button that appears to see the overall results for everyone who has completed the survey. No login required.
The analysis is built specifically for ranked results:
One-click filtering. Narrow the ranking to a single country, pricing plan or job role and watch the order change.
Two segments, side by side. European against American, new against tenured, using needs-based segmentation to define the split.
Individual rankings.Participant-level data names the people behind a score, which is how you build an interview list from a survey.
Every segment in one table. The view where the disagreements between groups become obvious.
2. PickedShares
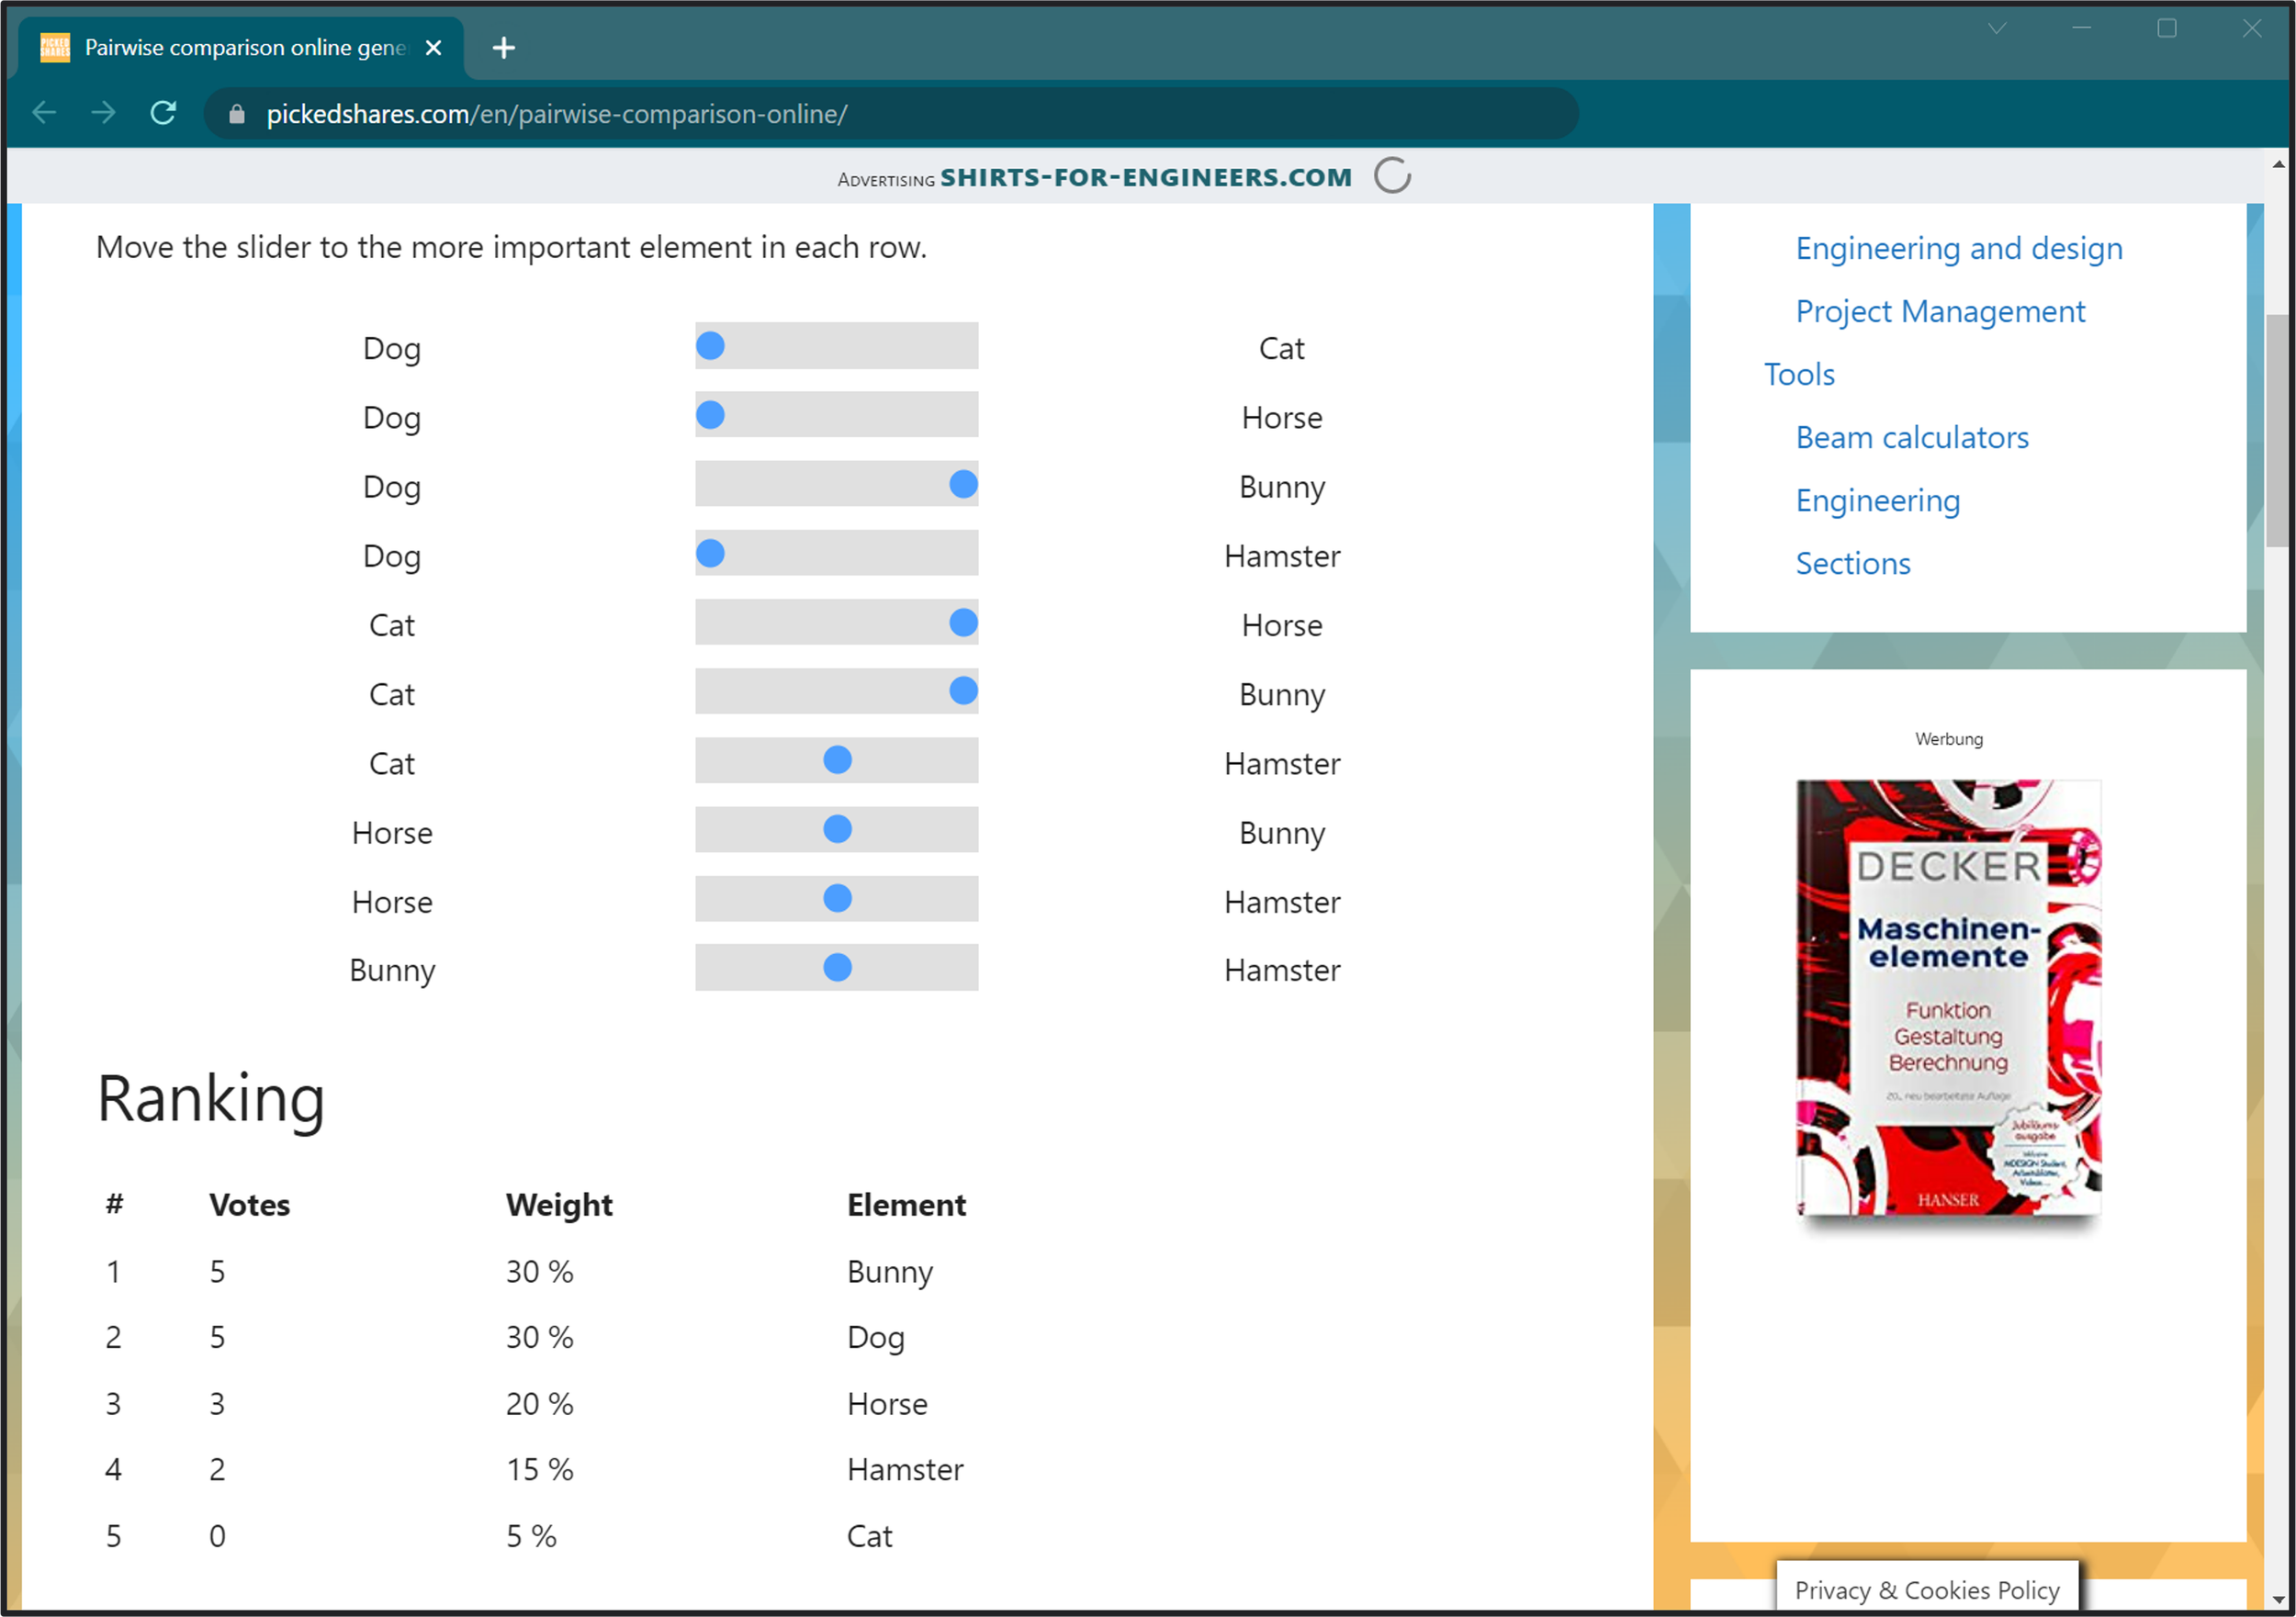
Verdict: fine for one person ranking their own list, spoiled by the advertising.
Mechanical engineers are the audience here: PickedShares is a library of tools, frameworks and project management material, with a free paired comparison utility inside it. Every possible combination appears on one page as a set of toggles.
Because it all sits on a single screen, voting is fast and the logic is easy to follow. It's the manual matrix with the sums done for you. What it won't do is accept votes from anyone but you, and the surrounding page is dense with advertising.
3. PollUnit

Verdict: workable for a small free poll. The 40-participant cap rules it out for research.
PollUnit is a general poll maker that happens to include a paired comparison format. Free accounts get 20 options and 40 participants per poll, with monthly billing above that.
The survey design is dated, unless you're a fan of animated backgrounds with shooting stars and fireflies. The company plants trees for each purchase made.
4. AllOurIdeas

Verdict: avoid for anything you need to analyse. Worth knowing as the original academic wikisurvey tool.
The wikisurvey idea originates here: participants don't just vote on your options, they add their own as they go. OpinionX supports the same behaviour, letting new participant-submitted options join the ranking mid-survey.
AllOurIdeas costs nothing and the source is open. It has also been unmaintained for several years, and parts of it have stopped working. You get a plain ranked list at the end, with nothing to analyse it and no way to export it.
5. 1000minds

Verdict: the right pick for experienced researchers running formal multi-criteria decision analysis with budget for an annual licence. If that describes your project, choose 1000minds over anything else here, including us.
1000minds is a decision-making tool created in 2002 for academics and governments needing a bespoke decision-insights platform. It's based on Multi-Criteria Decision Making (MCDM), an advanced relative of the paired comparison method. Voting is analysed with a proprietary method called PAPRIKA, which maps the relative importance of variable co-dependencies and overall priorities. PAPRIKA is patented, so it isn't a publicly available algorithm you can inspect, though the data science behind it is documented.
1000minds does not publish prices. The company charges an annual licence fee set per customer, so you have to book a call with their sales team before you can get a quote. A limited free trial is available for an unspecified period. Ours lasted 21 days before access to the projects was lost. Anyone with less experience will find the platform hard to navigate without support.
6. Pairwise-Ranking-App

Verdict: a clean single-user option if you want the survey feel without the ad clutter.
Single voter, like PickedShares, but the interface is closer to a real survey: one pair on screen at a time instead of a wall of toggles. The results page is the odd one out on this list, reporting wins and losses per option instead of resolving them into a score.
^ GIF via opinionx.co
Are there different types of paired comparison?
Yes. The paired comparison method always follows the core principle of head-to-head voting, but there are five ways to customise a survey. These formats are not mutually exclusive and can be combined.
| Type | What changes | Use it when |
|---|---|---|
| Complete | Every participant sees every possible pair | Few participants, or a list under 20 options |
| Partial | Each participant sees a sample of pairs | Large groups, or 20+ options |
| Forced | The skip button is removed | Every option is genuinely comparable |
| Image | Options are images or GIFs, not text | Concept testing and visual preference |
| Adaptive | Past votes decide the next pair shown | Long lists where vote spread matters |
Complete paired comparison
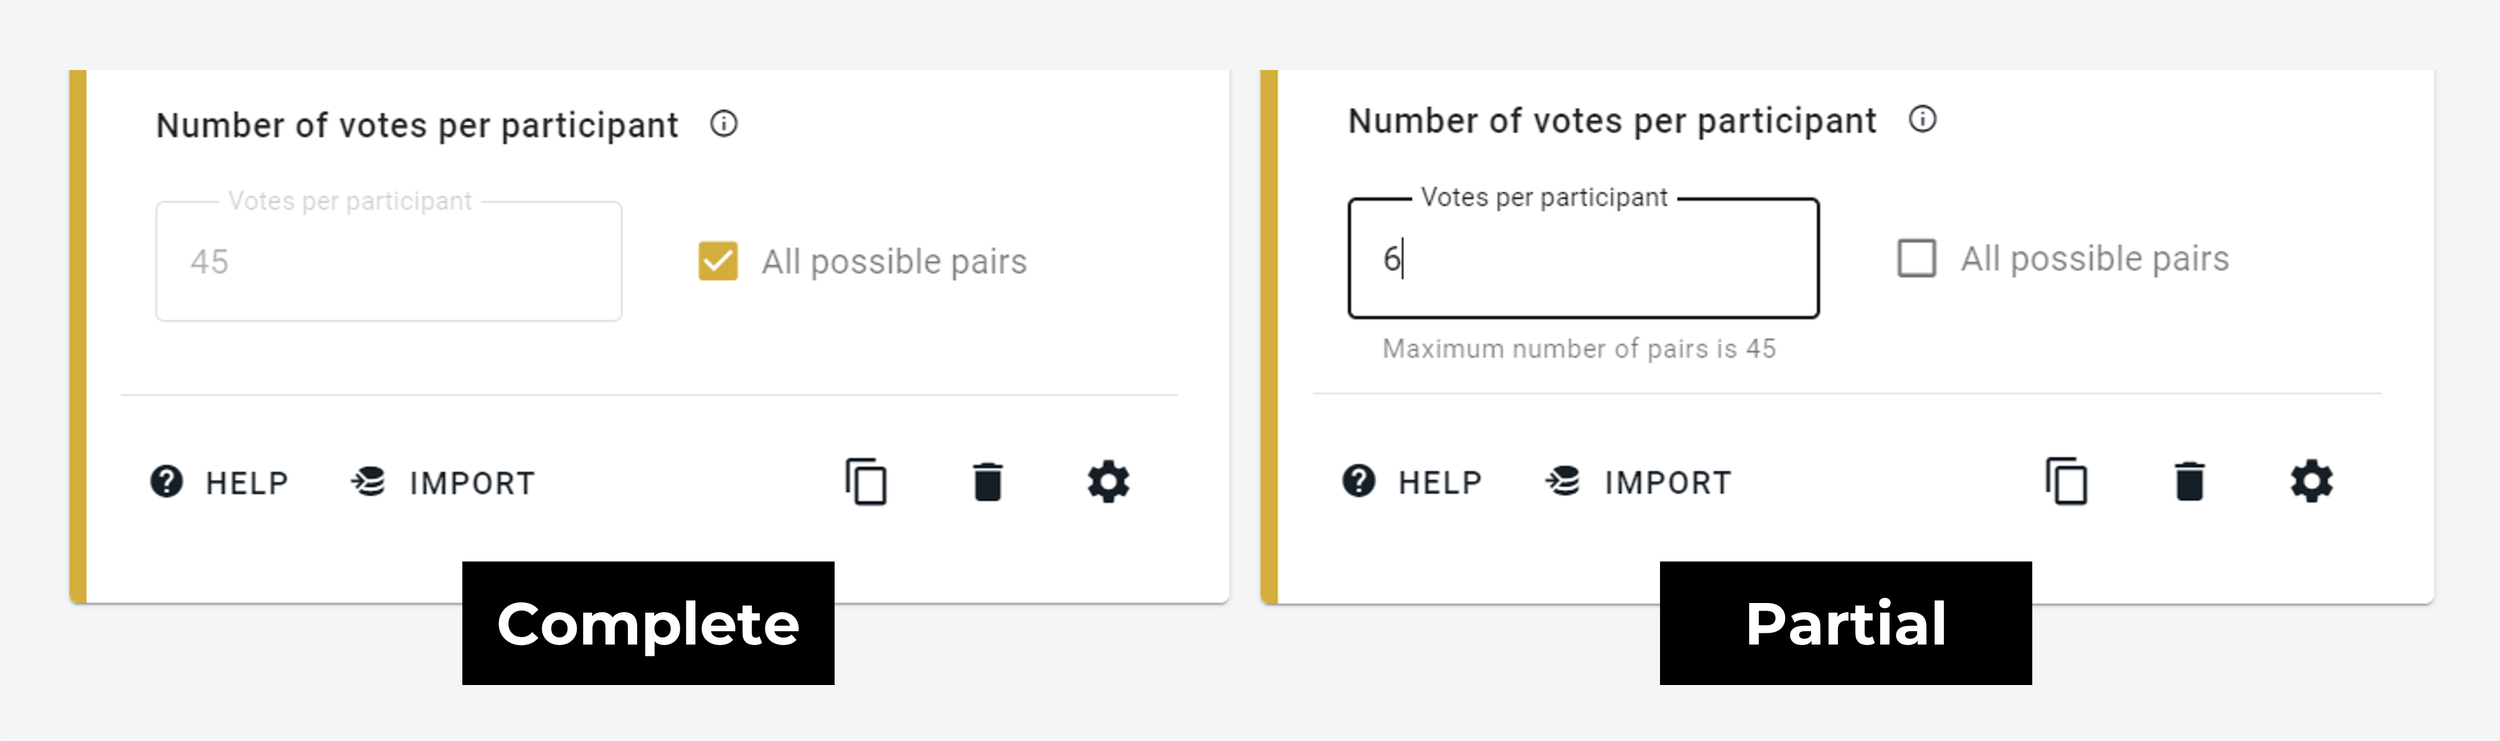
In a complete paired comparison, each participant sees every possible pair from the list. The resulting data is an accurate picture of that individual's preferences. The total is n(n-1)/2, so 15 options gives 15(14)/2 = 105 possible pairs.
Complete paired comparison is generally used when a survey has a very limited pool of participants, when a single person is ranking their own preferences, or when the voting list is short, usually 15 to 20 options at most.
^ Configuring the number of votes on a paired comparison survey with 10 options (via opinionx.co)

Partial paired comparison
When surveys engage larger groups, or when there are 20+ options to rank, researchers use a partial paired comparison. Each participant votes on a subset of the possible pairs.
The rule of thumb is to make sure your overall dataset gets as many votes as 3x the total number of possible pairs. Calculate it with 3n(n-1)/2, then divide by your estimate of the minimum number of participants expected to complete the survey. Partial paired comparison is used far more often than complete paired comparison on OpinionX surveys.
This calculator is built into every OpinionX survey that includes a paired comparison question.
Forced paired comparison
Most surveys offer a third button beside the two options: skip. It exists so nobody is made to choose between two options they find irrelevant or genuinely incomparable. Take the skip button away and every pair must be answered, which is forced paired comparison.
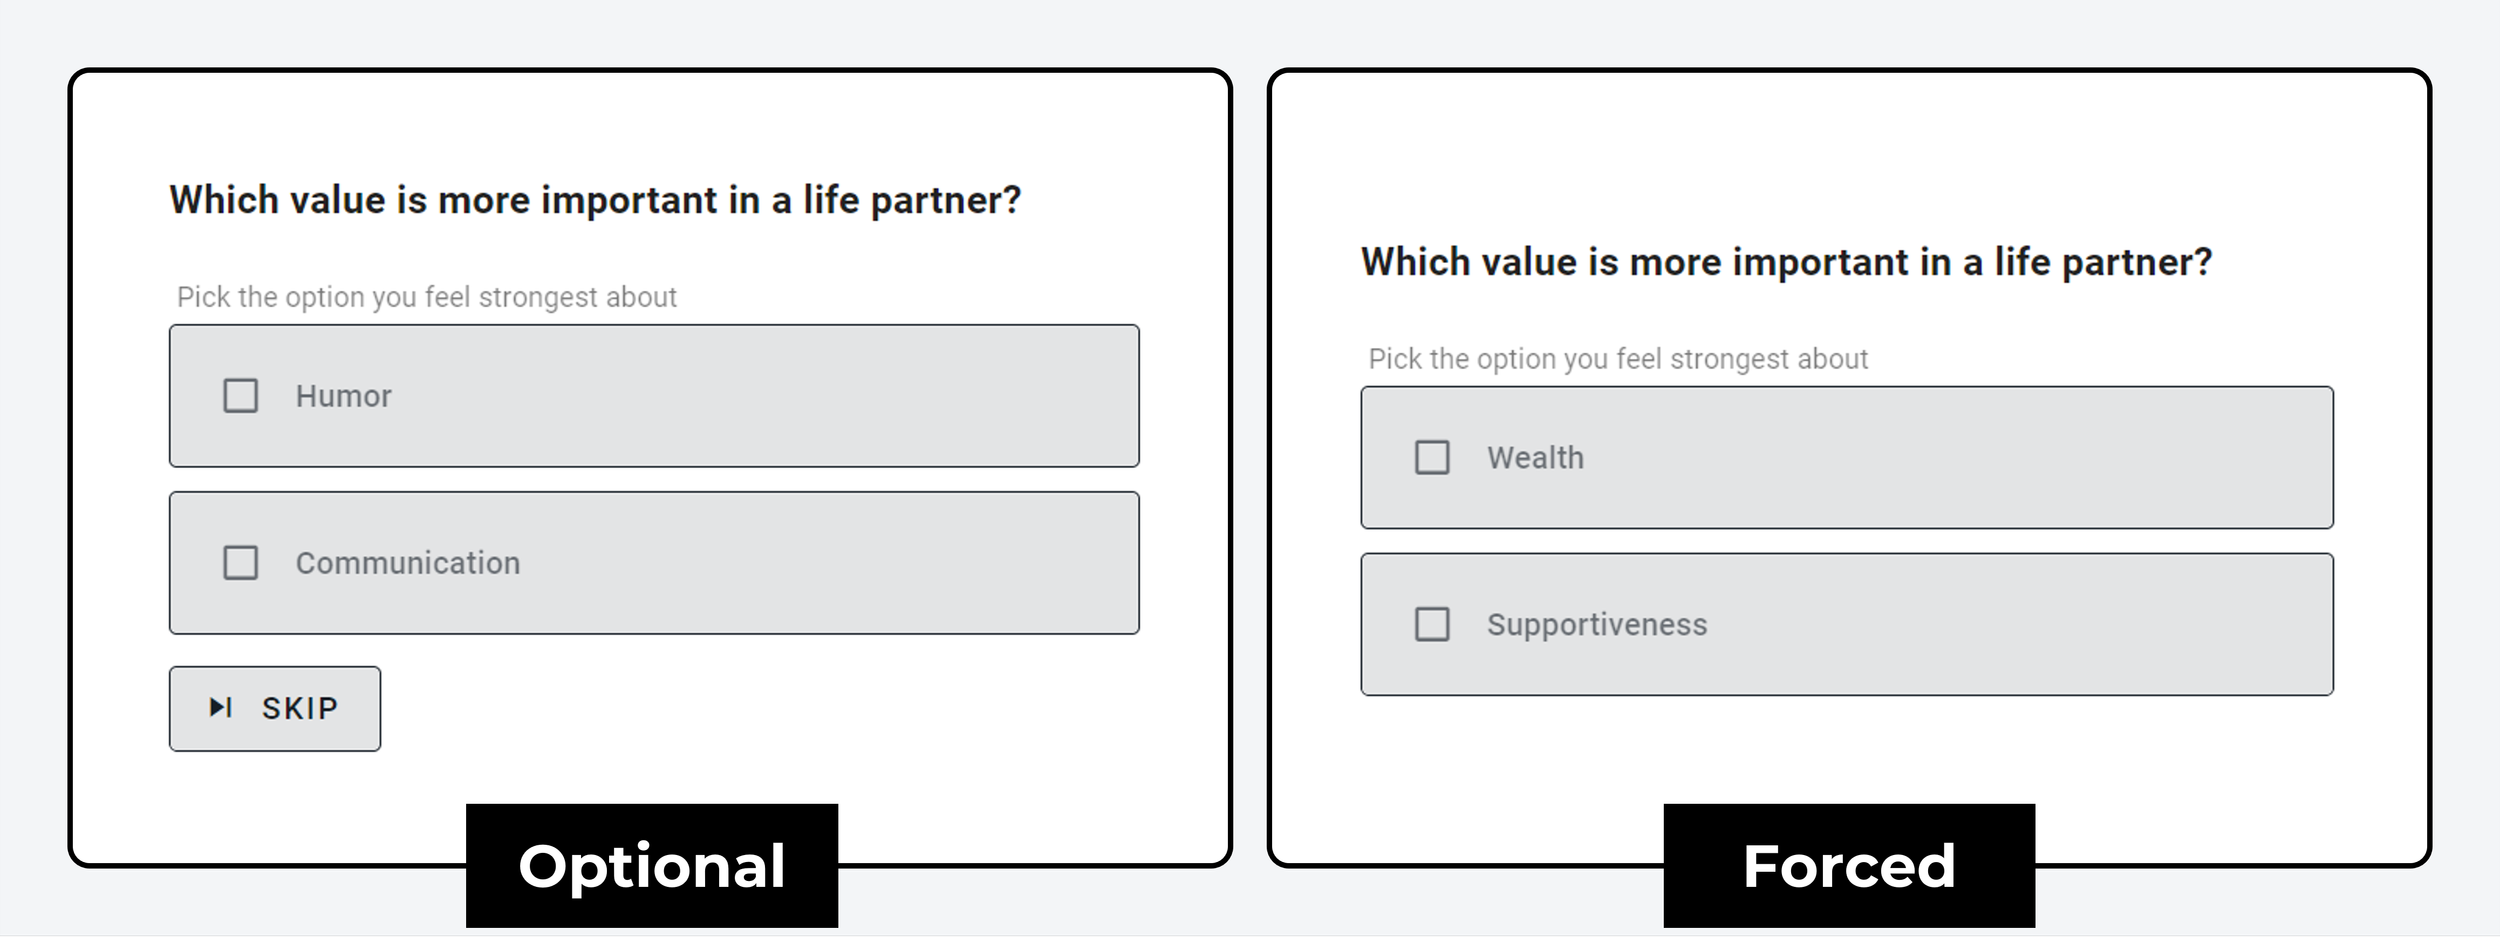
Image paired comparison
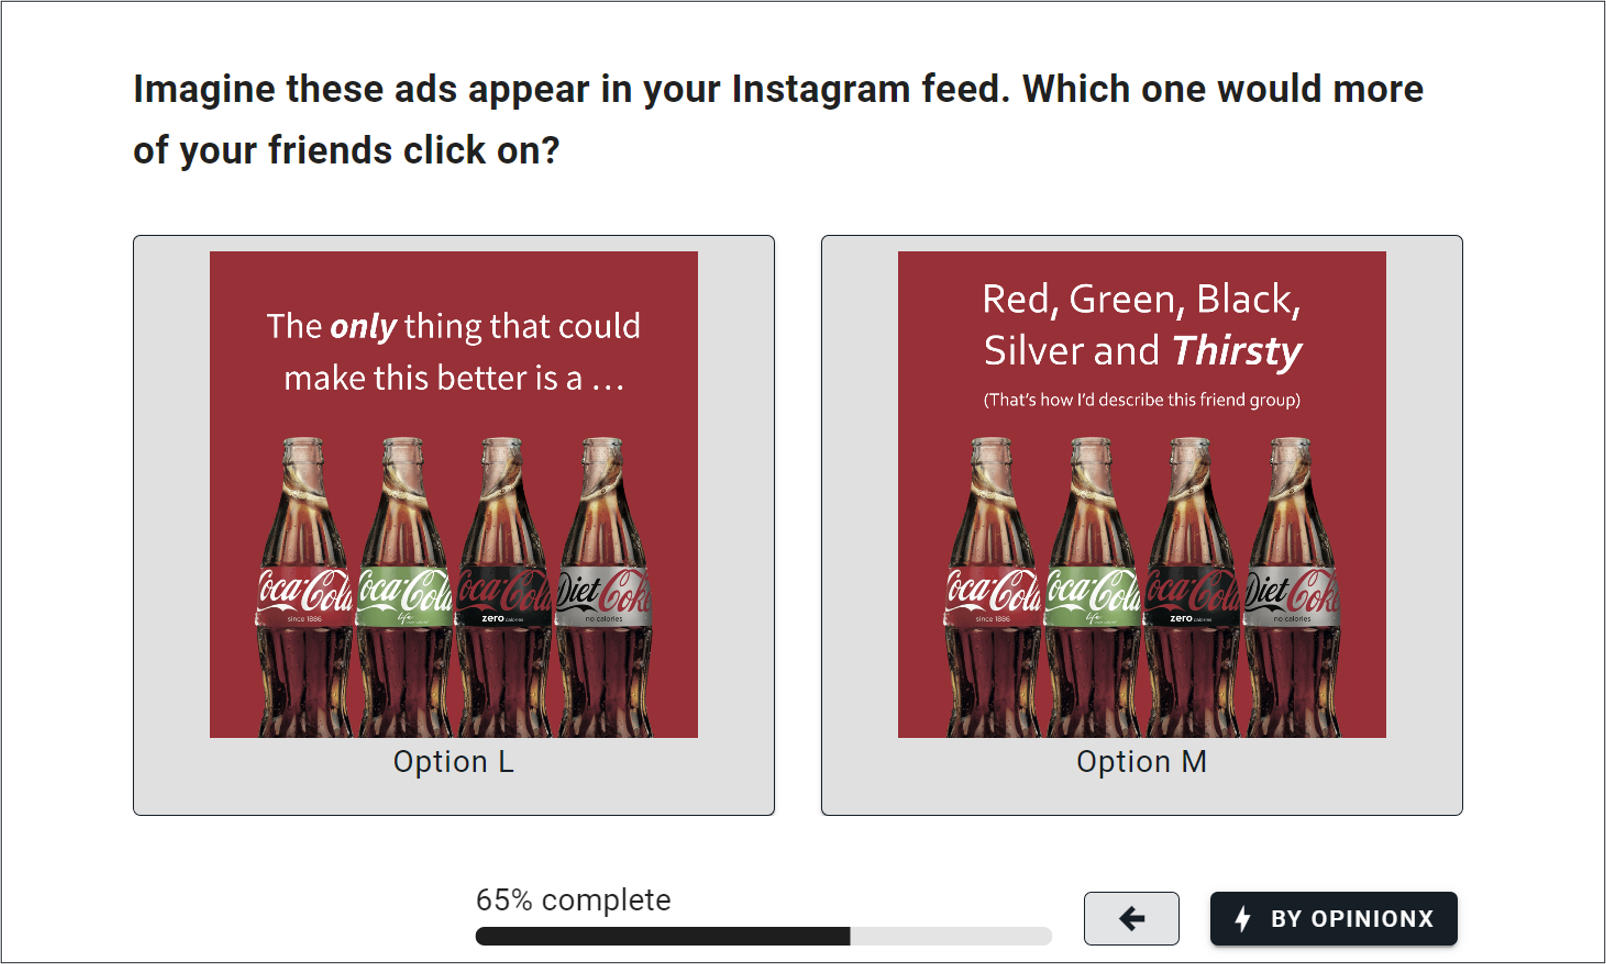
The paired comparison method is not restricted to text. You can also use images or GIFs. Image ranking is commonly used for concept testing, where researchers want to understand preferences across a set of visual options.
Adaptive paired comparison
Here the survey watches your earlier answers and picks the next pair accordingly. Transitivity does some of the work: pick A>B and then B>C, and the survey infers A>C and never shows you that pair. The other input is the dataset as a whole, keeping vote coverage even across options, or steering votes toward the ones that need them.
What sample size do I need for a paired comparison survey?
Show every pair to every participant and the question disappears. A complete paired comparison is already the soundest picture of one person's preferences available.
Three things usually make that impossible. The list is too long, because 30 options demands 435 votes. Or the participant pool is large enough that sampling each person's votes reconstructs the aggregate perfectly well. Or nobody is paying your participants enough to sit through 100+ votes, and they'll quit.
The working formula is 3n(n-1)/2. Every pair combination should appear three times somewhere in the survey. Take that total, divide by the smallest number of participants you realistically expect to finish, and the answer is how many votes to assign each person.
Anything under 10 votes per person is rarely worth restricting, since 10 pairs takes 30 to 60 seconds. The formula earns its keep when it returns a number well above 10 and you need to know whether that is survivable.
It also runs backwards. Give it an option count and no participant number, and it tells you how many people to recruit; give it a participant count, and it caps how many options you can safely include.
Examples of paired comparison in real-life scenarios
Academics, governments, product teams and people ranking a shortlist over lunch all use the paired comparison method.
Ranking everything in the world
In 2020 the YouTuber Tom Scott set out to rank everything in the world and collected 1.2 million votes doing it. The list ran to 7,188 options, which works out at 25,830,078 possible combinations, so a complete comparison was never on the table. Scott's insight was that it didn't need to be, since win rate is the output and win rate survives sampling. Pizza, sleep and gravity all made the top 10.
Assumption testing at Labster
Tudor Cristian Bogdan, a UX researcher at Labster, had a sales team convinced customers were desperate for one particular feature. He wasn't convinced. Instead of arguing, he pulled recent customer feedback together in internal workshops and put the whole set through a paired comparison survey. The feature everyone was certain about missed the top 10 entirely, and how the team handles internal assumptions changed after that.
Message testing at OpinionX
Our own launch went badly. 150+ interviews in, we still couldn't convert anyone.
So we took every problem those interviews had surfaced, loaded them into a paired comparison survey, and had an answer inside two hours: the problem we had built the entire company around was last. Five of the highest-ranked problems were ones we could already solve. New website messaging went up, and paying customers arrived that week. Customer Problem Stack Ranking has the full account.
Roadmap prioritisation at Safe.Global
Safe.Global builds wallet and account infrastructure on Ethereum, in an industry where users expect a vote on the tools they depend on. Instead of treating that as a problem, the Safe team runs quarterly roadmap prioritisationsurveys on OpinionX and lets the community rank which problems come next.
“We knew our old process wasn’t a very solid approach to say which things should be prioritized. With OpinionX, my team are a lot more confident because we can sort our whole roadmap by the problems users say are most important to them.”
The Wikimedia Foundation product roadmap survey
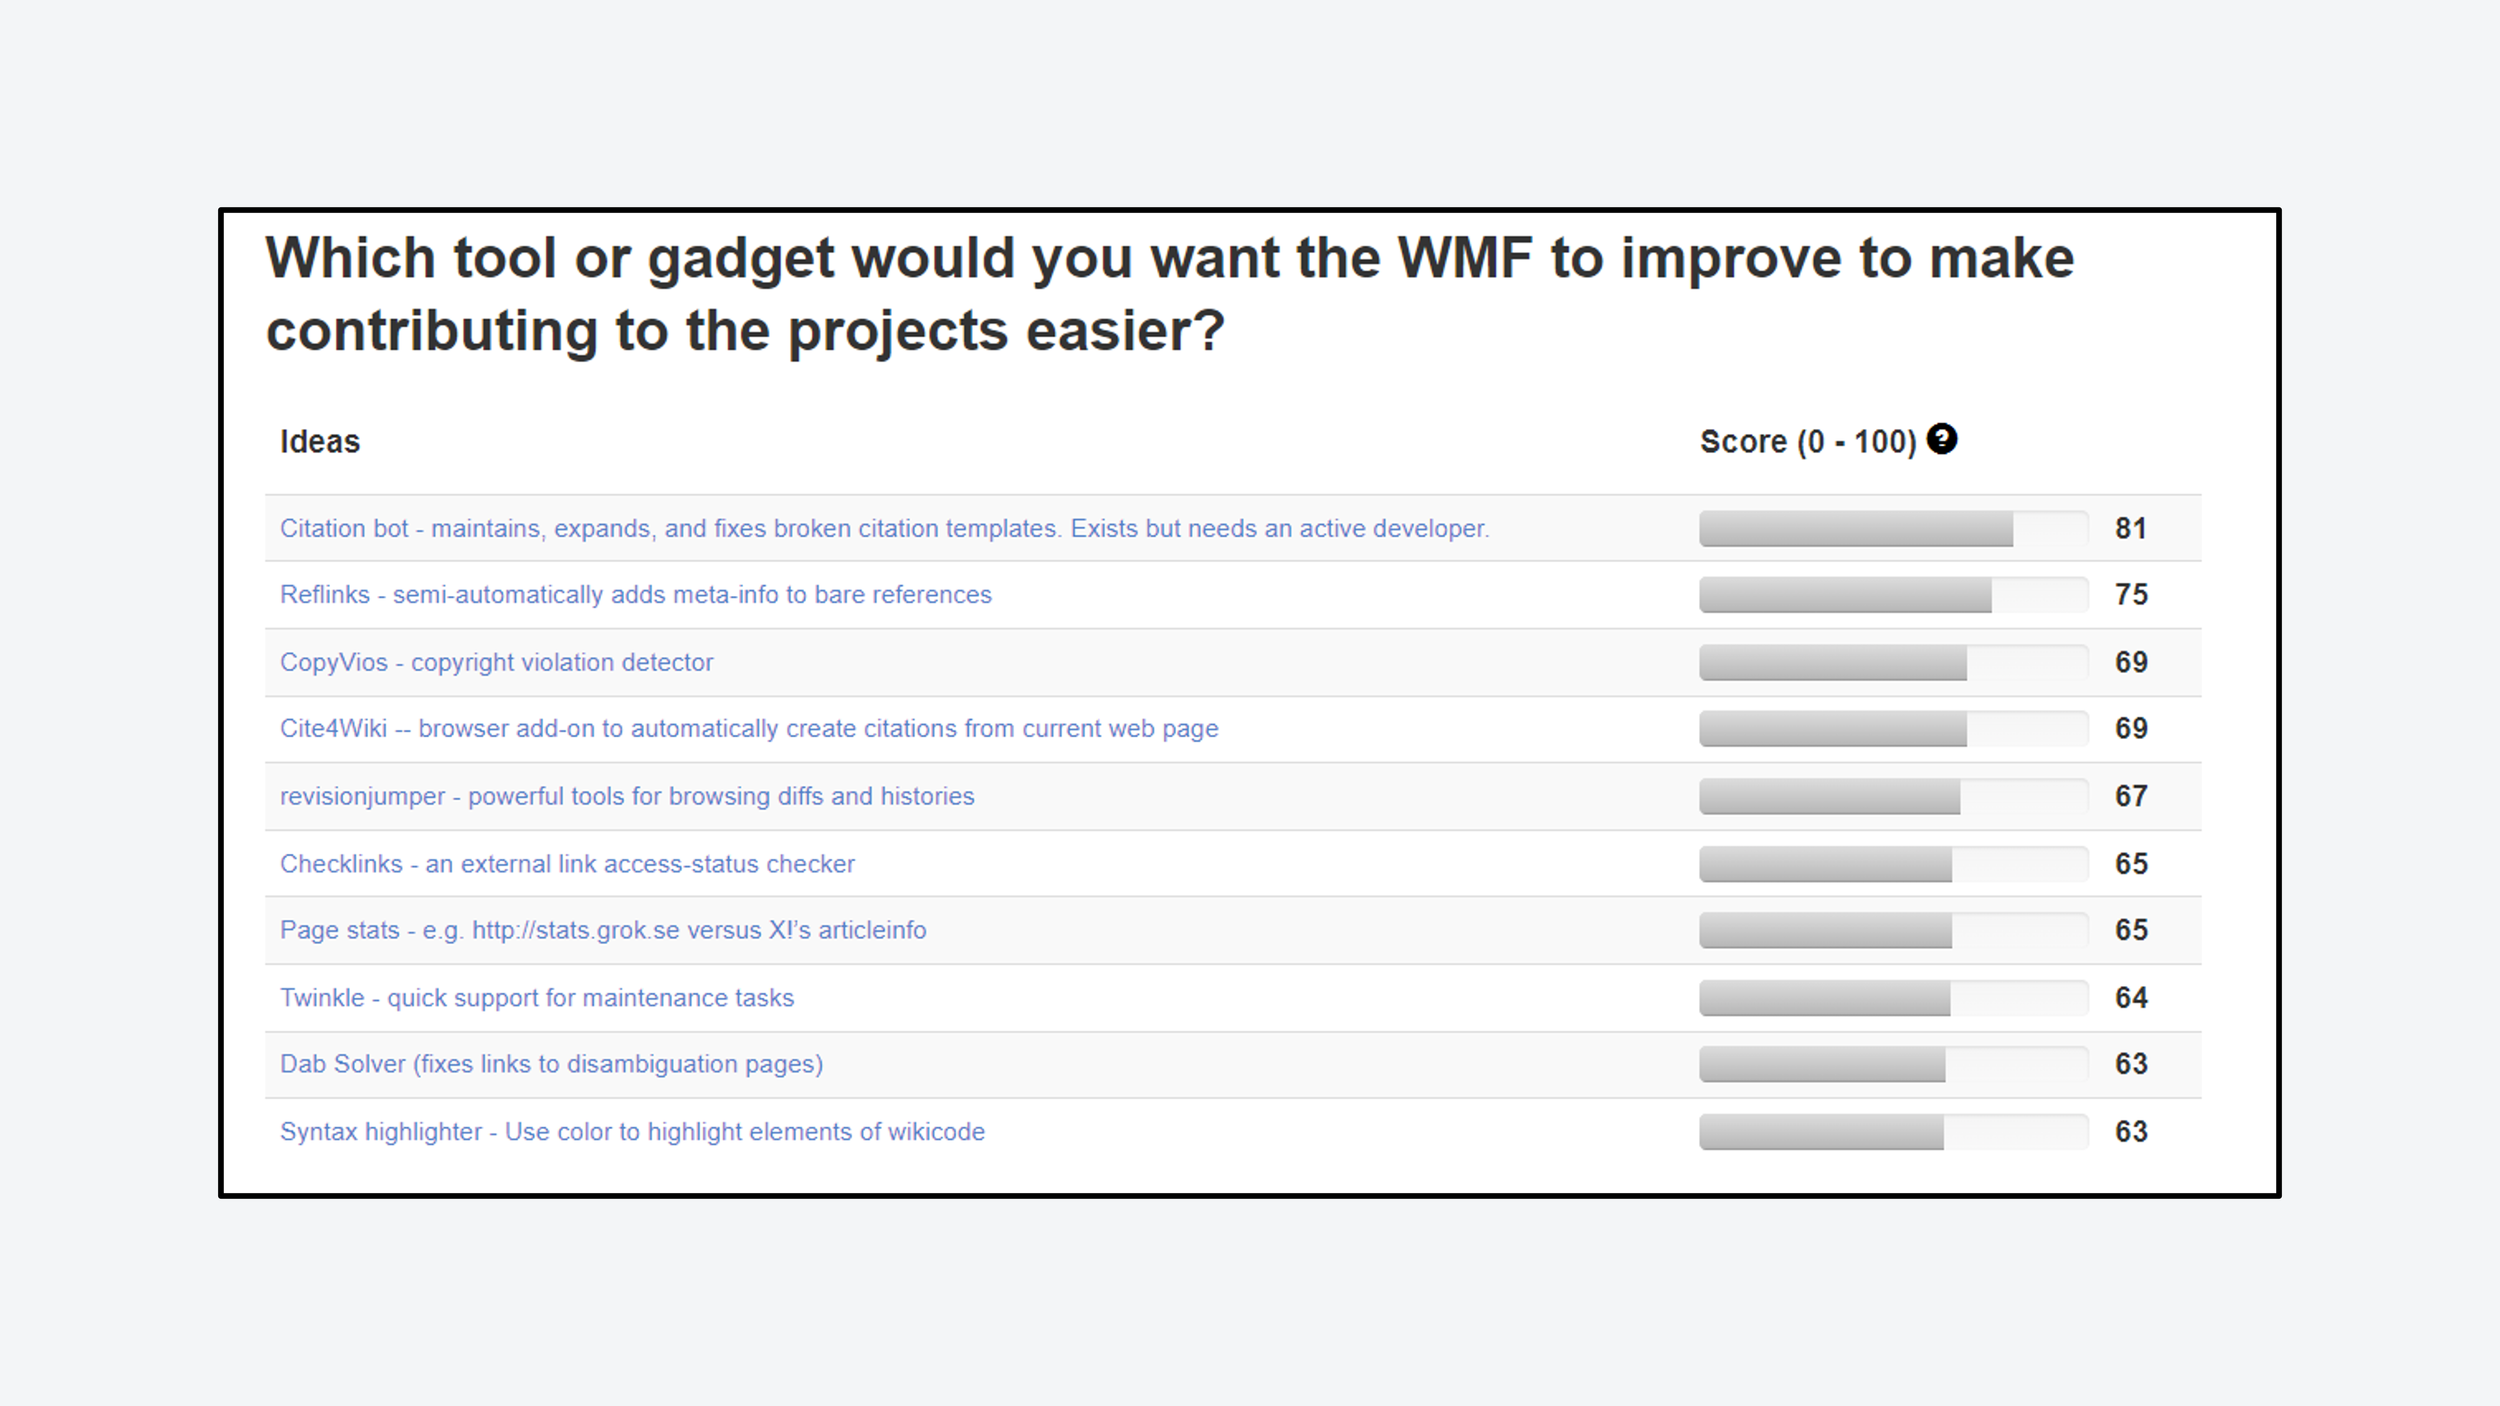
The Wikimedia Foundation put its 2014 tooling roadmap to the community as a prioritisation survey. More than 30,000 votes came back.
Player rating on Chess.com
Every chess game is already a paired comparison: two options, one winner, occasionally a draw. Chess.com, the largest chess community anywhere, runs Glicko-2 across all of them, starting each player at 1500 points and moving the number with every result.
Idea validation at Stripe
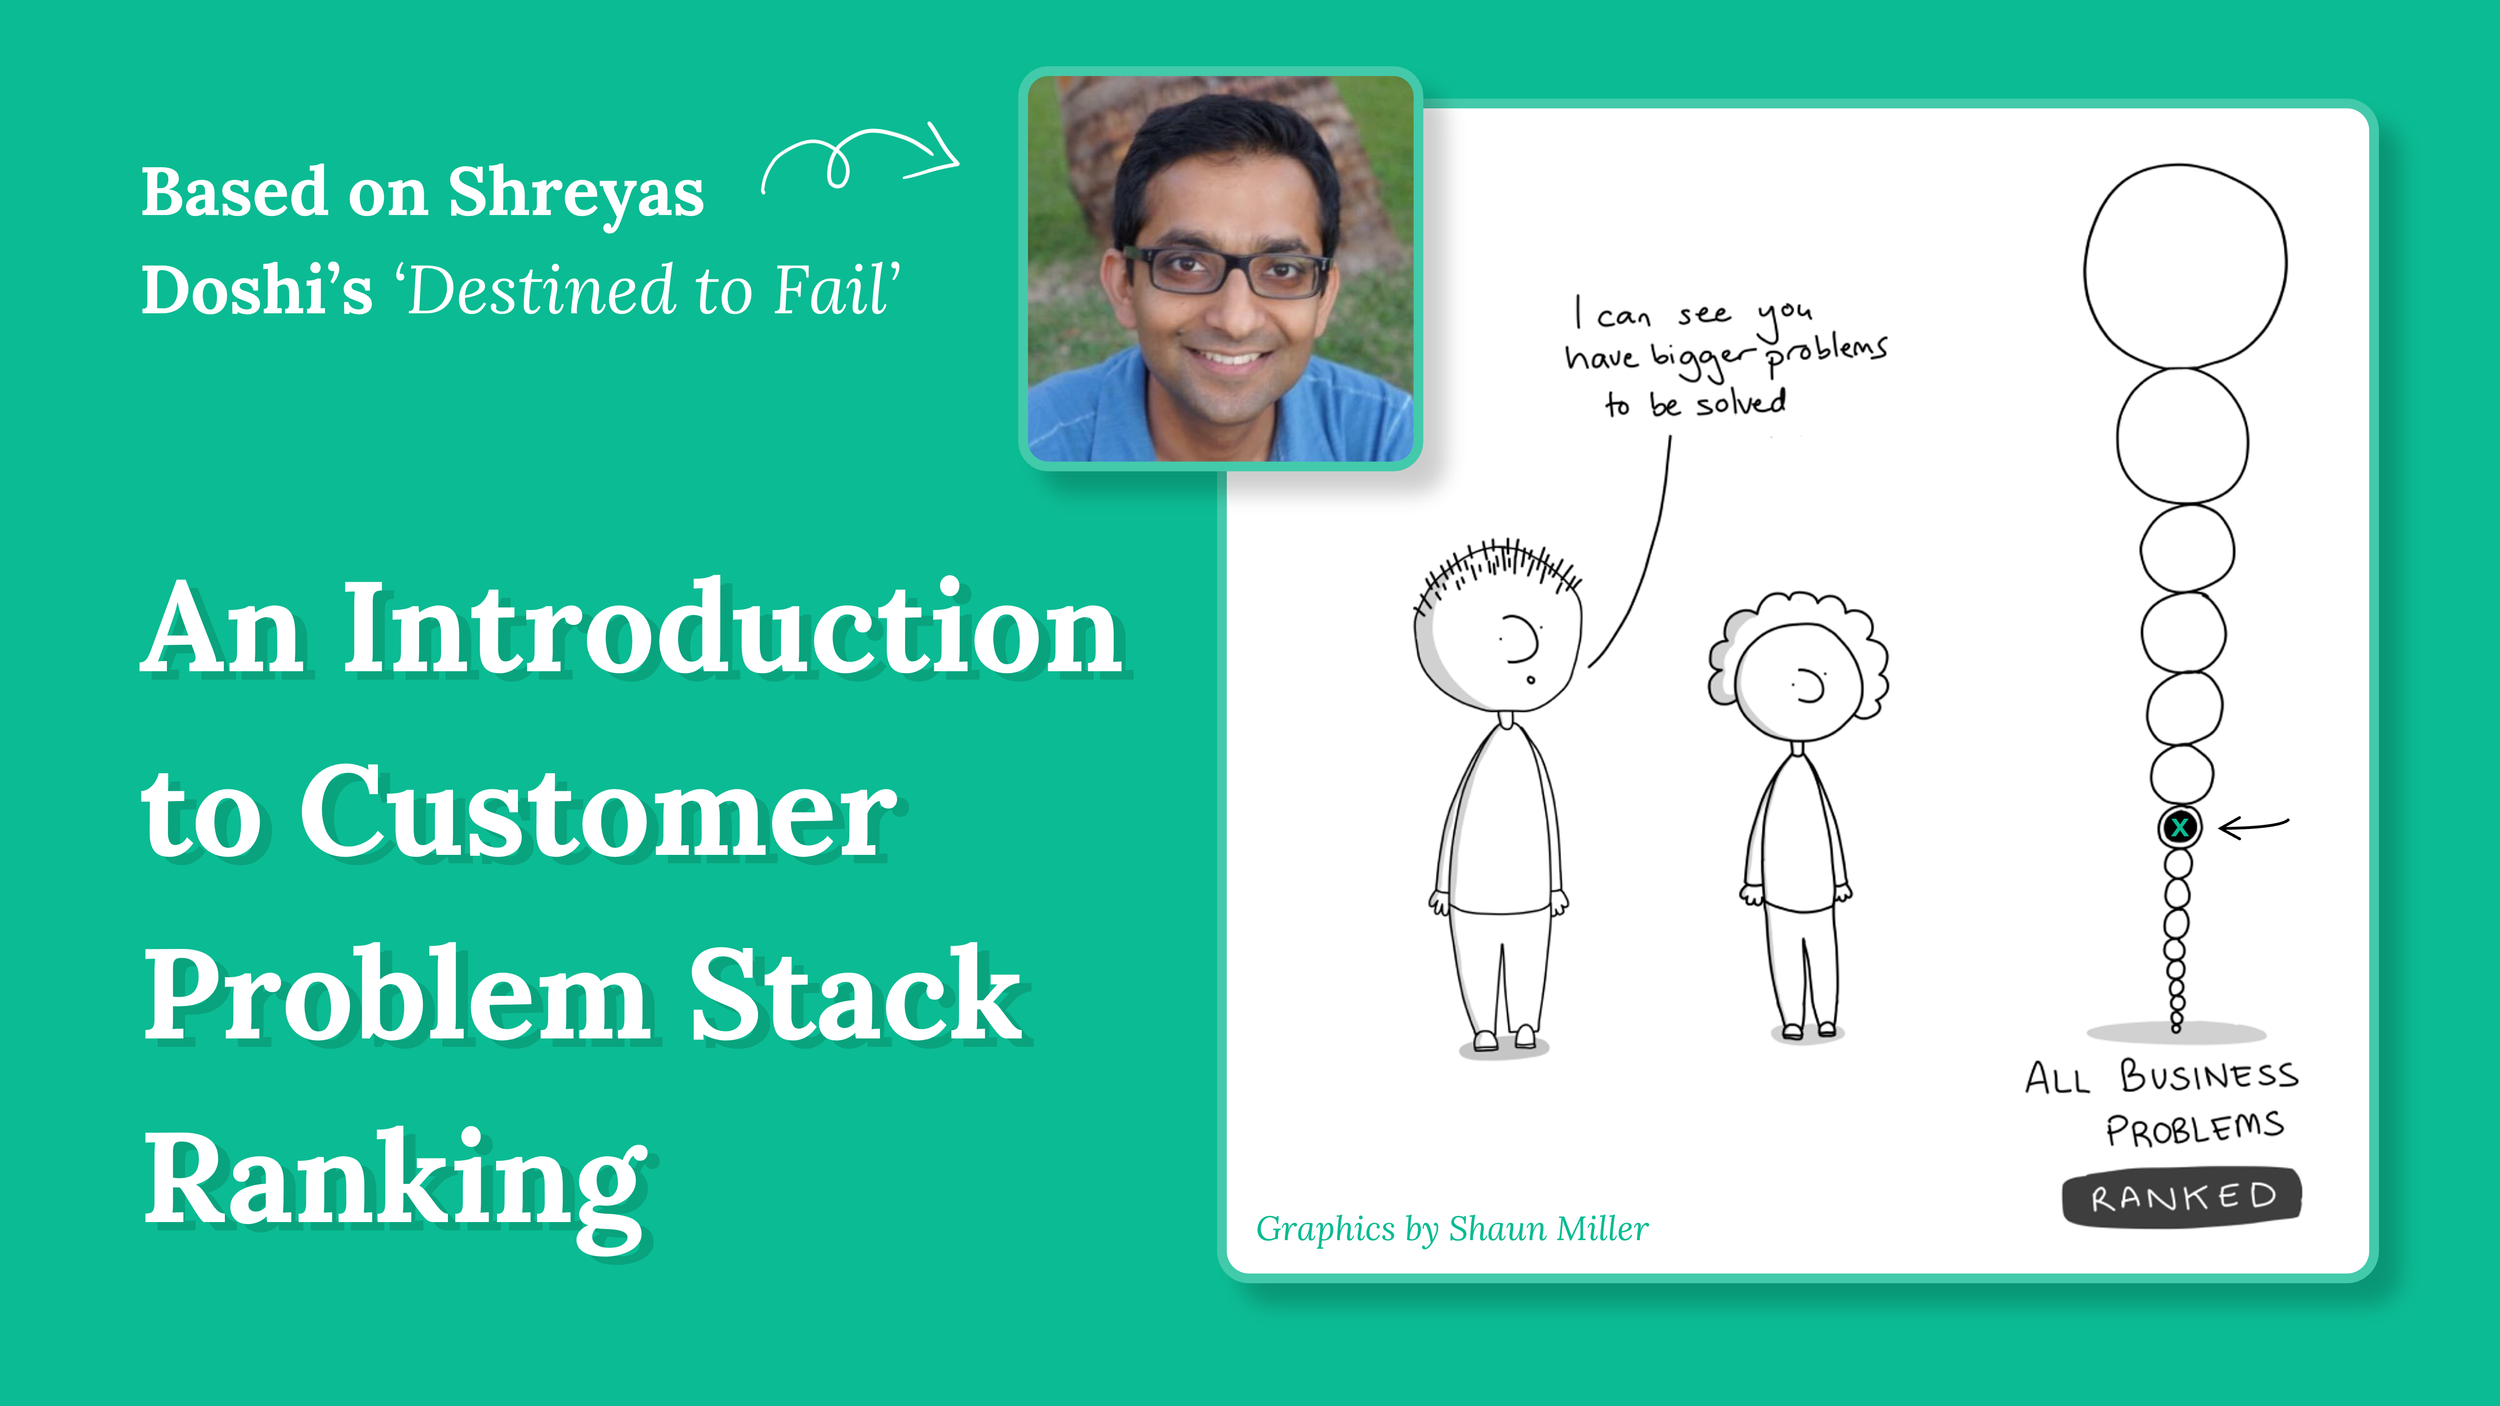
Validation methods usually stay inside the company that developed them. Shreyas Doshi, then a product leader at Stripe, published his in a post called "Destined To Fail", laying out why most idea validation fails. The remedy he proposed was comparative ranking of customer problems, which shows you exactly where your problem sits in the customer's own order of priorities. The full story is here.
Academia and formal research
The academic use is the old one. Product teams and executives only picked it up recently. Both now sit side by side on OpinionX: Disney, Google, LinkedIn, Shopify and Amazon run internal and customer-facing surveys with it, while academic users apply it to social impact, educational engagement and medical research.
How do I design a paired comparison survey?
Setting up the paired comparison method takes no more work than any other survey type. Two requirements, two suggestions.
1. The comparison question
What lens should participants use to interpret the pair they're voting on? The six most common:
Preference. Which do they like most?
Pain. Which is a bigger unmet need?
Value. Which is worth most to them?
Risk. What concerns them most?
Motivation. Which is a bigger driver of action?
Friction. Which is a bigger barrier to action?
Once you pick a lens, pick the comparison context. Take "value" with "the customer's experience of my product" as the context, and the two join to make a question like "Which of the two features below delivers more value for the money in our product?"
2. The comparison options
Next comes the list of options for the head-to-head votes. Following the question about ranking features by perceived value, the list should include every feature the product offers today.
One of the most common ways user researchers use paired comparison is to get customers to vote on pairs of problem statements, following a format called Customer Problem Stack Ranking. You can also collect new options from participants mid-survey if you want to crowdsource the list.
3. Participant identifiers
OpinionX surveys run anonymously unless you say otherwise, so add an identifier question if you want names, emails or usernames attached to votes.
The reason is what happens after the results land. A top-ranked option raises an immediate follow-up question, which is who ranked it first and why. Without identifiers you can't go and ask them. With identifiers you have an interview list, which is the second half of the Discovery Sandwich.
4. Segmentation data
A single aggregate ranking assumes everyone in your participant pool wants the same things. They almost never do. The useful reading comes from splitting the results by pricing plan, region, seniority or whatever else distinguishes one group of customers from another.
Two or three multiple-choice questions at the start of the survey are enough to make this possible later. On OpinionX, tapping any bar on the results page filters the whole ranking to that group.
What is the history and origins of paired comparison?
Psychology got here first, with data science and mathematics arriving later.
1927. The American psychologist L. L. Thurstone publishes A Law of Comparative Judgment in Psychological Review. His original framing is physical: compare objects that have measurable properties, such as weight. Thurstone's wider reputation rests on multiple-factor analysis and Primary Mental Abilities, the work behind how modern intelligence tests are structured.
1929. Thurstone follows up with "The Measurement of Psychological Value", proving the same approach can scale intangibles. Attitudes and values become measurable by how much people prefer them. In the same year, the German mathematician Ernst Zermelo applies the idea to a different problem entirely: how to rank chess players who have not all played each other.
1952. Zermelo's chess work reaches an American academic duo, who publish the Bradley-Terry model. Their mathematics now underpins competitive sports rankings, peer-review ordering in academic journals and a slice of contemporary machine learning.
1960s. Arpad Elo, a Hungarian-American physics professor, reads Zermelo and builds a chess rating system that carries his name. ELO becomes the best known paired algorithm ever written.
1995 and 2005. Glicko and then TrueSkill extend Elo's approach. Both still run today inside Pokémon Go, Chess.com, Dota and Counter-Strike.
Frequently asked questions
What is the paired comparison method?
The paired comparison method ranks a list of options by showing people two at a time and recording which one they prefer. Each vote is a head-to-head comparison, and the combined votes produce a ranked list with a score per option. It's used in market research, product prioritisation, performance appraisal and competitive rating systems like chess.
What is the formula for paired comparison?
The number of possible pairs is n(n-1)/2, where n is the number of options. Ten options produce 45 pairs, 15 produce 105, and 30 produce 435. For a partial paired comparison, the votes needed across the whole survey are 3n(n-1)/2, divided by your lowest estimate of participants to get votes per person.
What are the advantages and disadvantages of paired comparison?
The advantages are that it handles long lists, works well on phones, needs no training, and turns subjective preferences into numbers. The disadvantages are that the number of pairs grows quickly with list length, complete comparisons become impractical past about 20 options, and results are only useful once you segment them, since a single aggregate ranking hides where groups disagree.
Who invented the paired comparison method?
L. L. Thurstone published A Law of Comparative Judgment in Psychological Review in 1927, giving psychology a formal model for scaling paired judgments. Ernst Zermelo, the Bradley-Terry model and Arpad Elo's ELO rating all built on that foundation. Its use in user research and product decisions came decades later.
Over 42,000 researchers and product people get one method breakdown like this each week in The Full-Stack Researcher.
Create a paired comparison survey in about 3 minutes. Every question type and every analysis feature is unlocked on the free tier, capped at 25 participants per survey, so you can run a full study and read the results before deciding whether to pay.