
None of the Above → Adding Rejection to OpinionX’s Conjoint Surveys (January 2026)
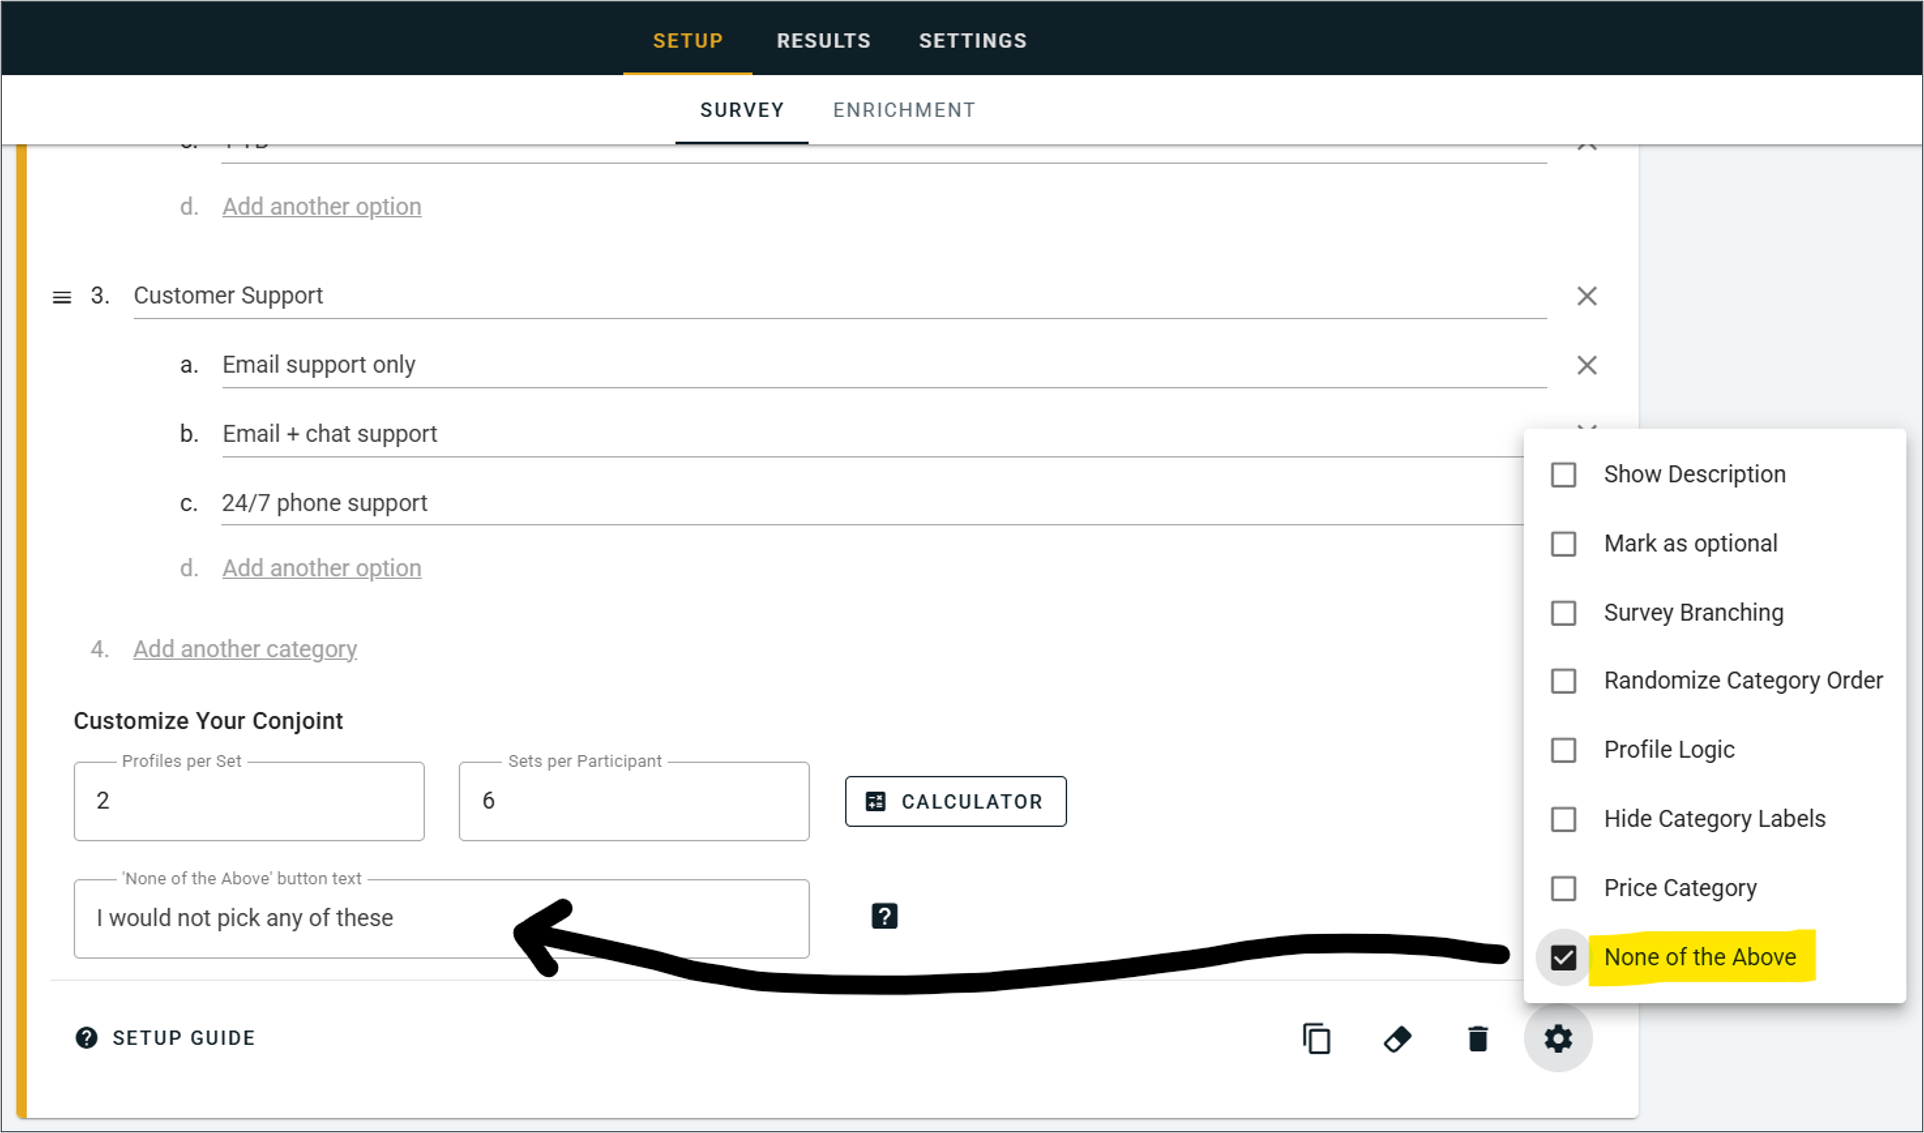
We spent the month of January adding a range of new features to OpinionX’s conjoint analysis survey method — at the center of which is a customizable ‘none of the above’ voting option:
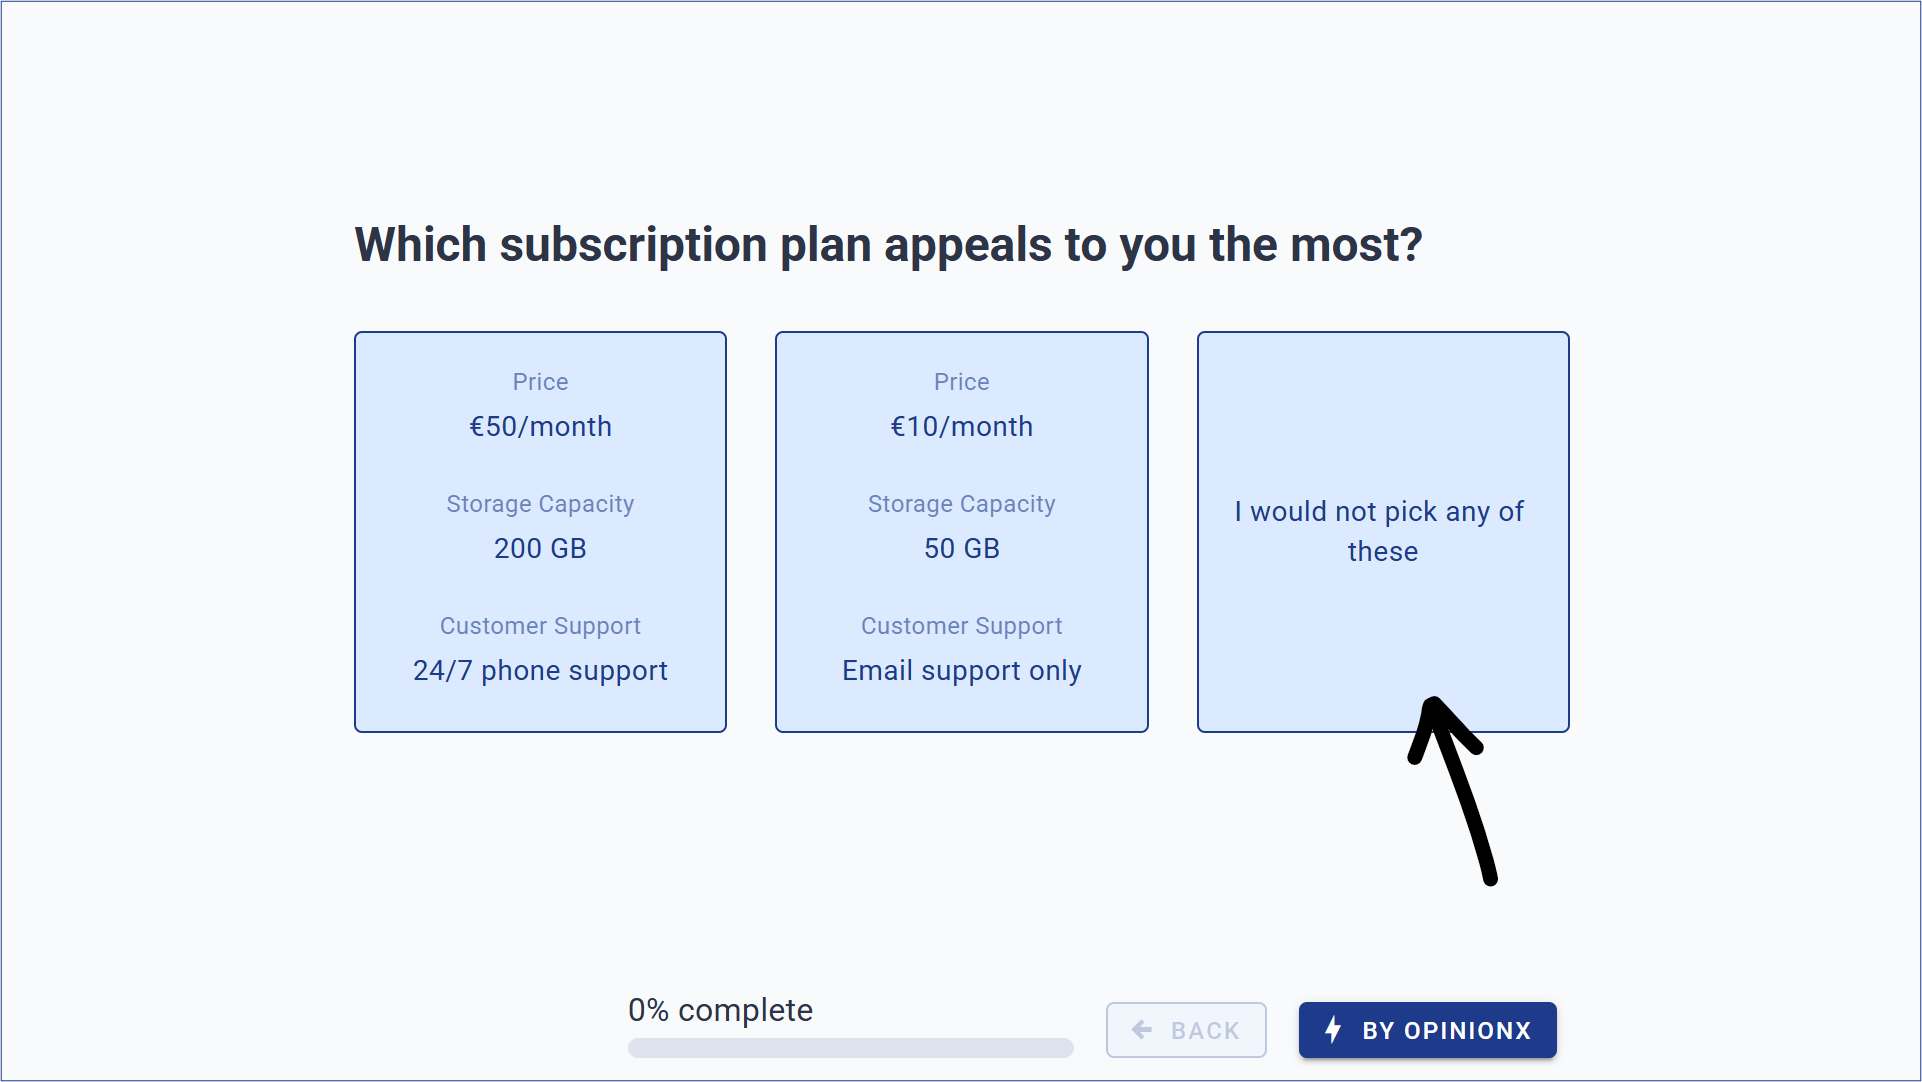
This ‘none of the above’ button can be customized to match your research requirements, like:
I would prefer to keep my current solution → Willingness to switch analysis
I would rather cancel my subscription → Churn indicator
Ní mhaith liom aon rud anseo → Match the button to your study’s language
But we decided to go way beyond just adding one extra button — we considered all the different ways that researchers could use this rejection data to create insightful, actionable research on OpinionX. Here are three notable examples:
1. Rejection Rate
OpinionX’s new Rejection Rate chart for conjoint analysis surveys shows which options cause respondents to say ‘no thanks’ the most. It looks specifically at the percentage of votes where respondents chose ‘none of the above’ instead of a profile containing each option.
While conjoint analysis is typically used to see which product attributes are most important to customers, it can be equally powerful to see which options are dealbreakers that push customers to search for alternatives.

2. Churn Simulator
Conjoint simulators are typically used to study market share distribution (which product would customers most likely buy) or revenue projections (based on market share predictions, which product would generate the most money). But what these simulators often lack is a realistic opt-out option that incorporates customers that likely wouldn’t buy the product at all. We’ve added a churn factor into our Scenario Simulator on OpinionX’s conjoint surveys:

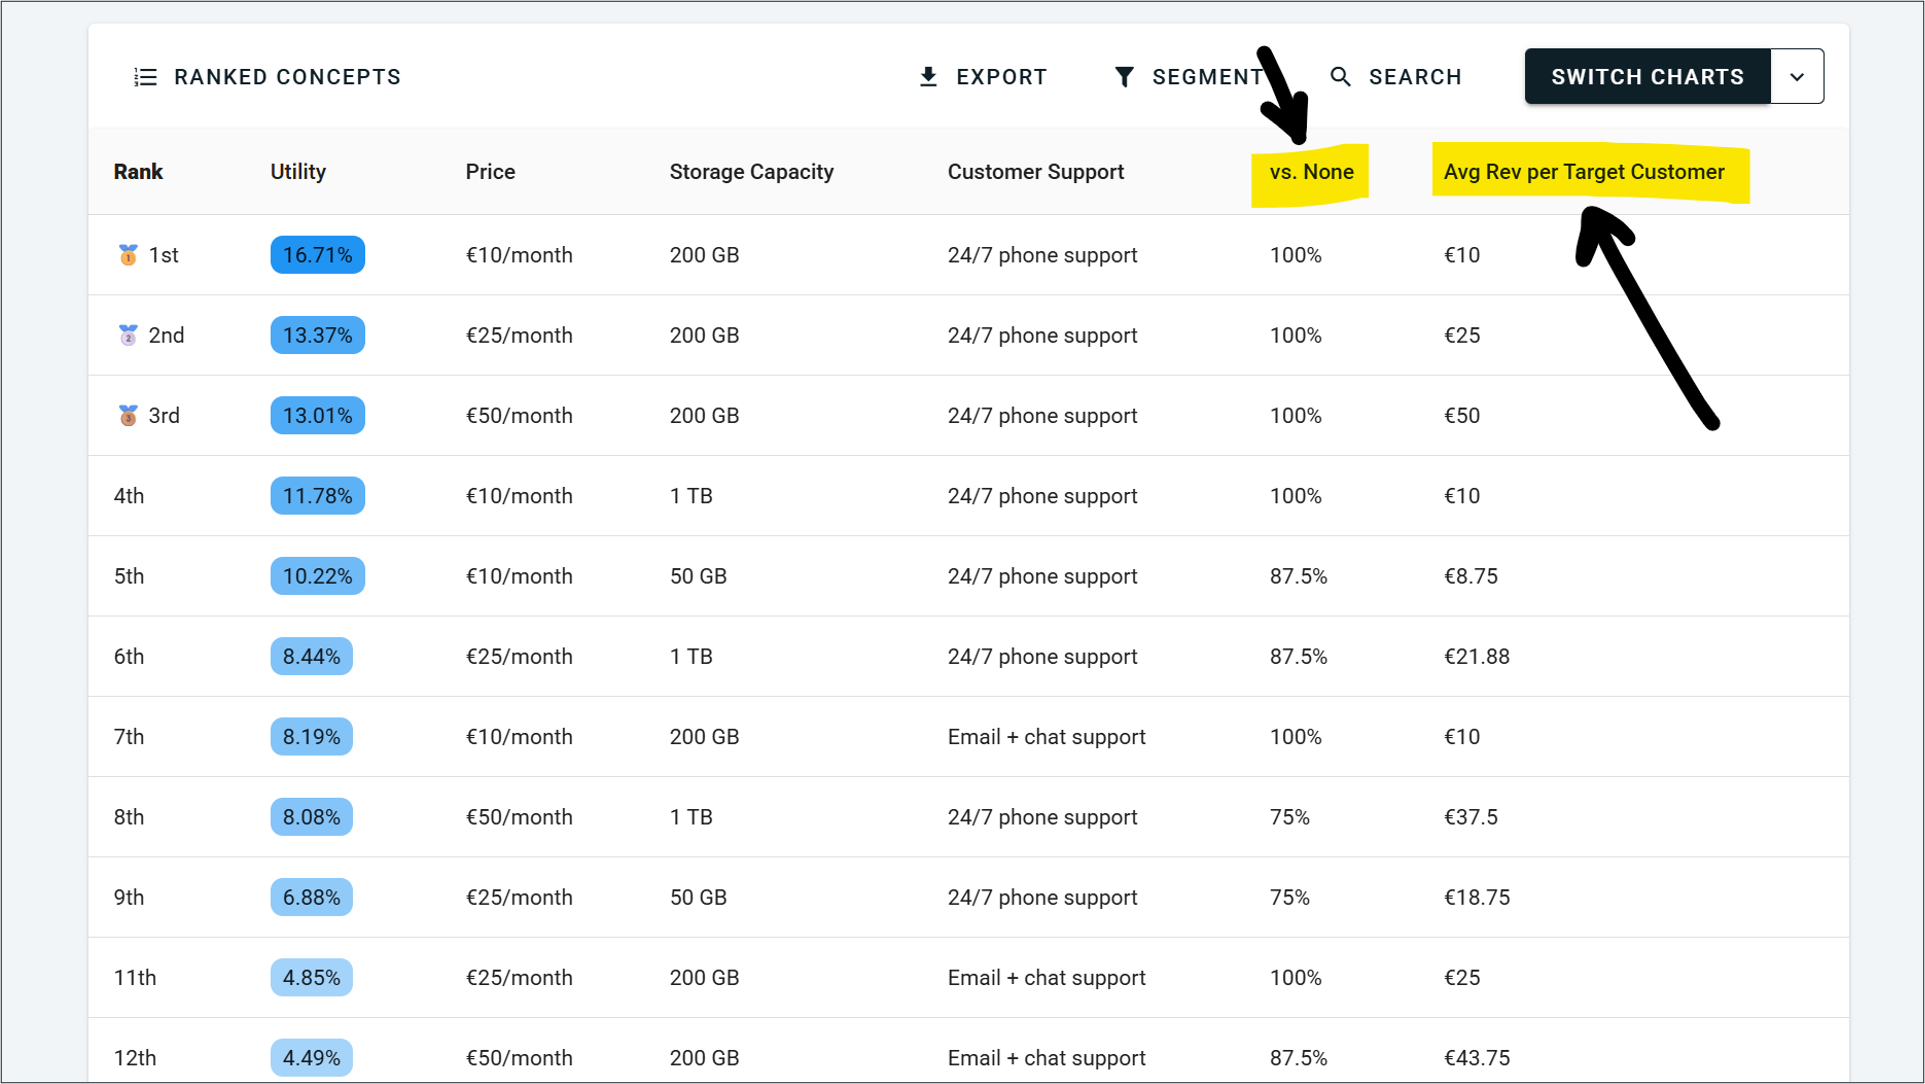
3. Ranked Concepts
OpinionX’s Ranked Concepts chart is like the market share simulator, except it runs every possible combination of options automatically to tell you what is most preferred. While this chart previously ranked the results by preference score, you can now toggle the list to find the most preferred combination with the highest opt-in rate or ARPU by accounting for respondents who would pick the ‘none of the above’ button during voting:
Also included in our January 2026 update:
Rejection rate stats from Conjoint Rank’s ‘None of the Above’ button are also scattered throughout OpinionX’s other analysis features, like the Participants Tab, Segments Tab, and Survey Exports.
We renamed Prohibited Pairs to Profile Logic and improved how this feature is explained to new users.
Analyze subscriptions now get 1.5 hours of prepaid consulting credits for Expert Assistance.
All new surveys now have a link enabled for publishing and sharing their interactive results with anyone.
You can now configure your price attribute directly on the analysis dashboard for conjoint charts like the Revenue Simulator and Marginal Willingness To Pay. No more digging back through your survey setup to do this :)
Changed the overview metric from Average Duration to Median Duration to give you a more relevant view of how long your survey is taking participants to complete, without outliers skewing this metric in an unrepresentative way.
Added more UI references to the participant limits added in our December 2025 pricing update.
Fixed an issue that was preventing the Clusters Tab from running its analysis for some customers.
Next month 👀
We’re already busy working on Multi-Language Surveys to enable researchers to run one survey in many different languages as a single dataset — something I know you guys have been keen to see added to OpinionX for quite some time. Expect further news on this in early March.