
13 Types of Conjoint Analysis Explained (With Image Examples)
Conjoint analysis is a popular research method for understanding which attributes are most important to customers when they consider purchasing your product.
However, “conjoint analysis” is a catch-all term that actually means a lot of different things. This post covers the 13 most common types of Conjoint Analysis survey, explains how each type works, and includes an image example to help you understand their differences.
— — —
This post is just one part of my series about conjoint analysis, which includes:
▸ Ultimate Guide to Conjoint Analysis (Explanation, Tools, Examples)
▸ 10 Scenarios where you should NOT use Conjoint Analysis
▸ 8 Alternatives to Conjoint Analysis for Survey Research
▸ Comparing the Top 10 Tools for Conjoint Analysis Surveys
▸ How your Conjoint Analysis results are calculated (advanced guide)

What Is Conjoint Analysis?
Conjoint analysis is a survey format that measures the relative importance people feel towards different product attributes (like price, brand, or features) when evaluating products in a purchase scenario. Conjoint analysis assumes that people evaluate products based on their combination of attributes. The result of a conjoint survey tells you the relative importance of each attribute (eg. price vs brand) and the options you included within each attribute (eg. Coca-Cola vs Pepsi).
⬆️ interactive example of a conjoint analysis survey (hosted on OpinionX)
— — —
What Are The Components Of A Conjoint Analysis Survey?
A conjoint survey shows two or more product “profiles” that represent variations of the same product. Each profile has the same list of attribute categories, but the options shown for those categories vary on each profile. When a respondent picks their preferred profile, their vote is recorded and a new set of profiles are shown.
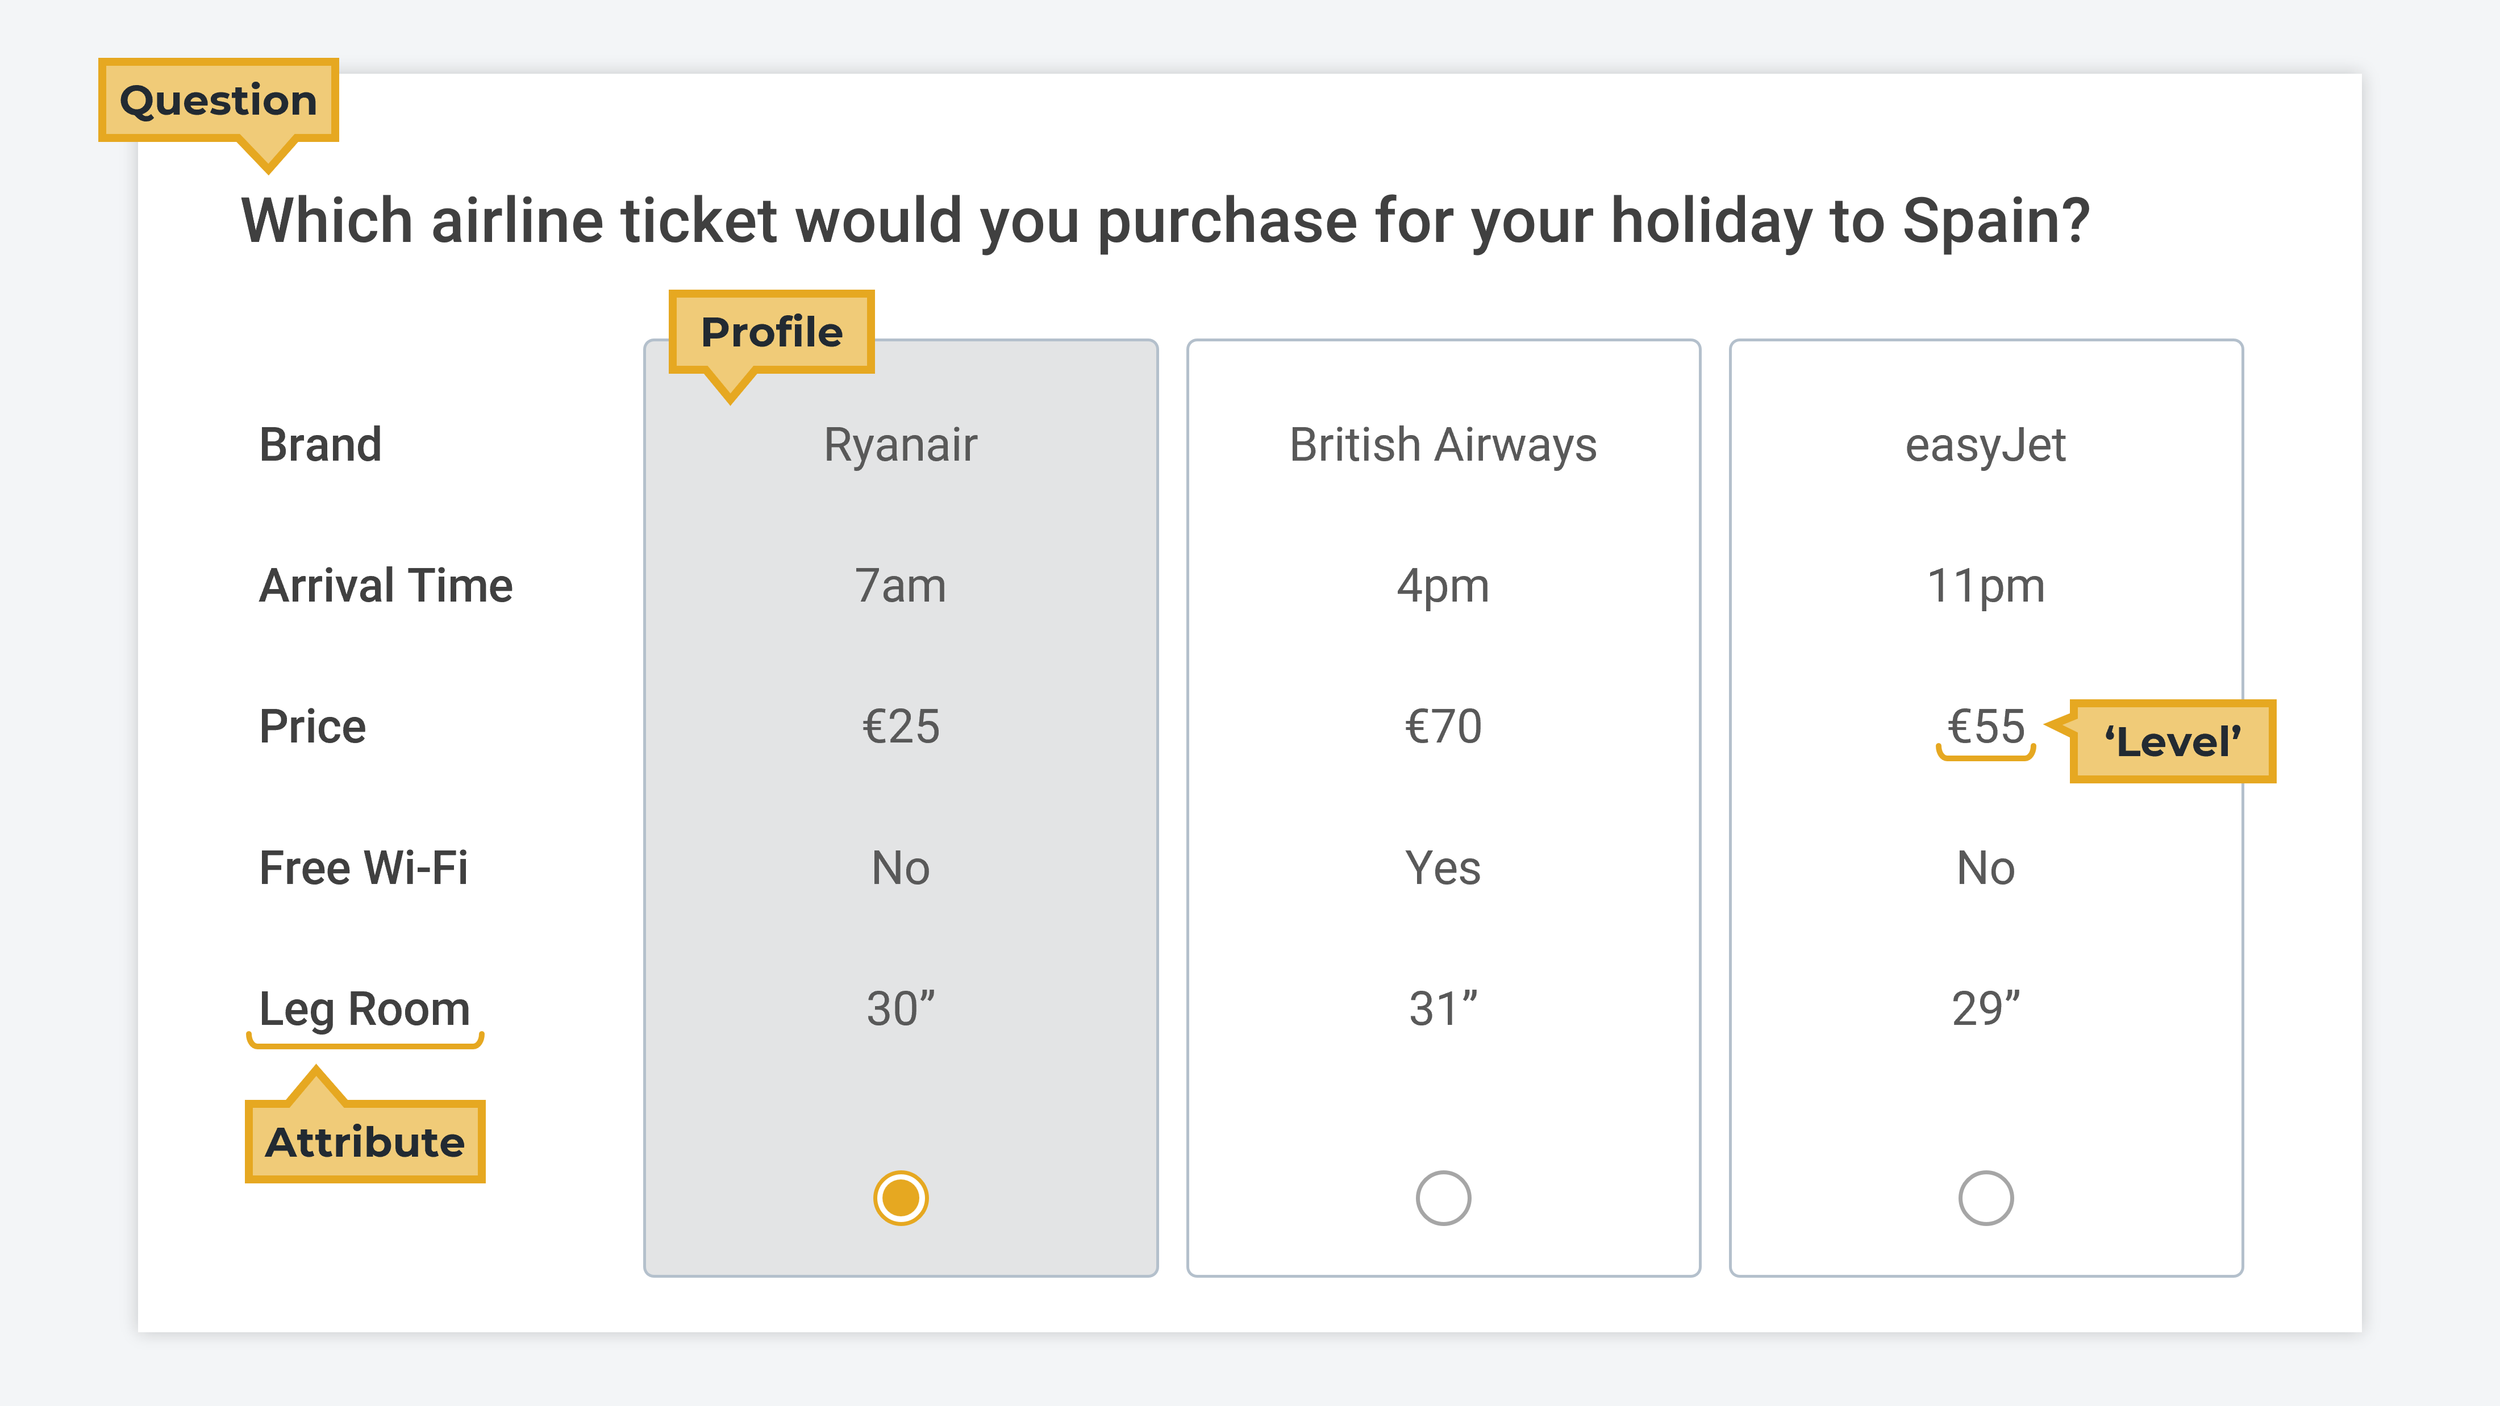
The four components of a conjoint analysis survey are:
1. Question: Gives the respondent context about the product decision they are simulating.
2. Profile: A complete set of attribute values that make up a potential product offering.
3. Attributes: The characteristics relevant to customers’ purchase decision (aka “categories”).
4. Levels: The range of values or possibilities you include within each attribute (aka “options”).
— — —
Example Conjoint Analysis Survey And Results
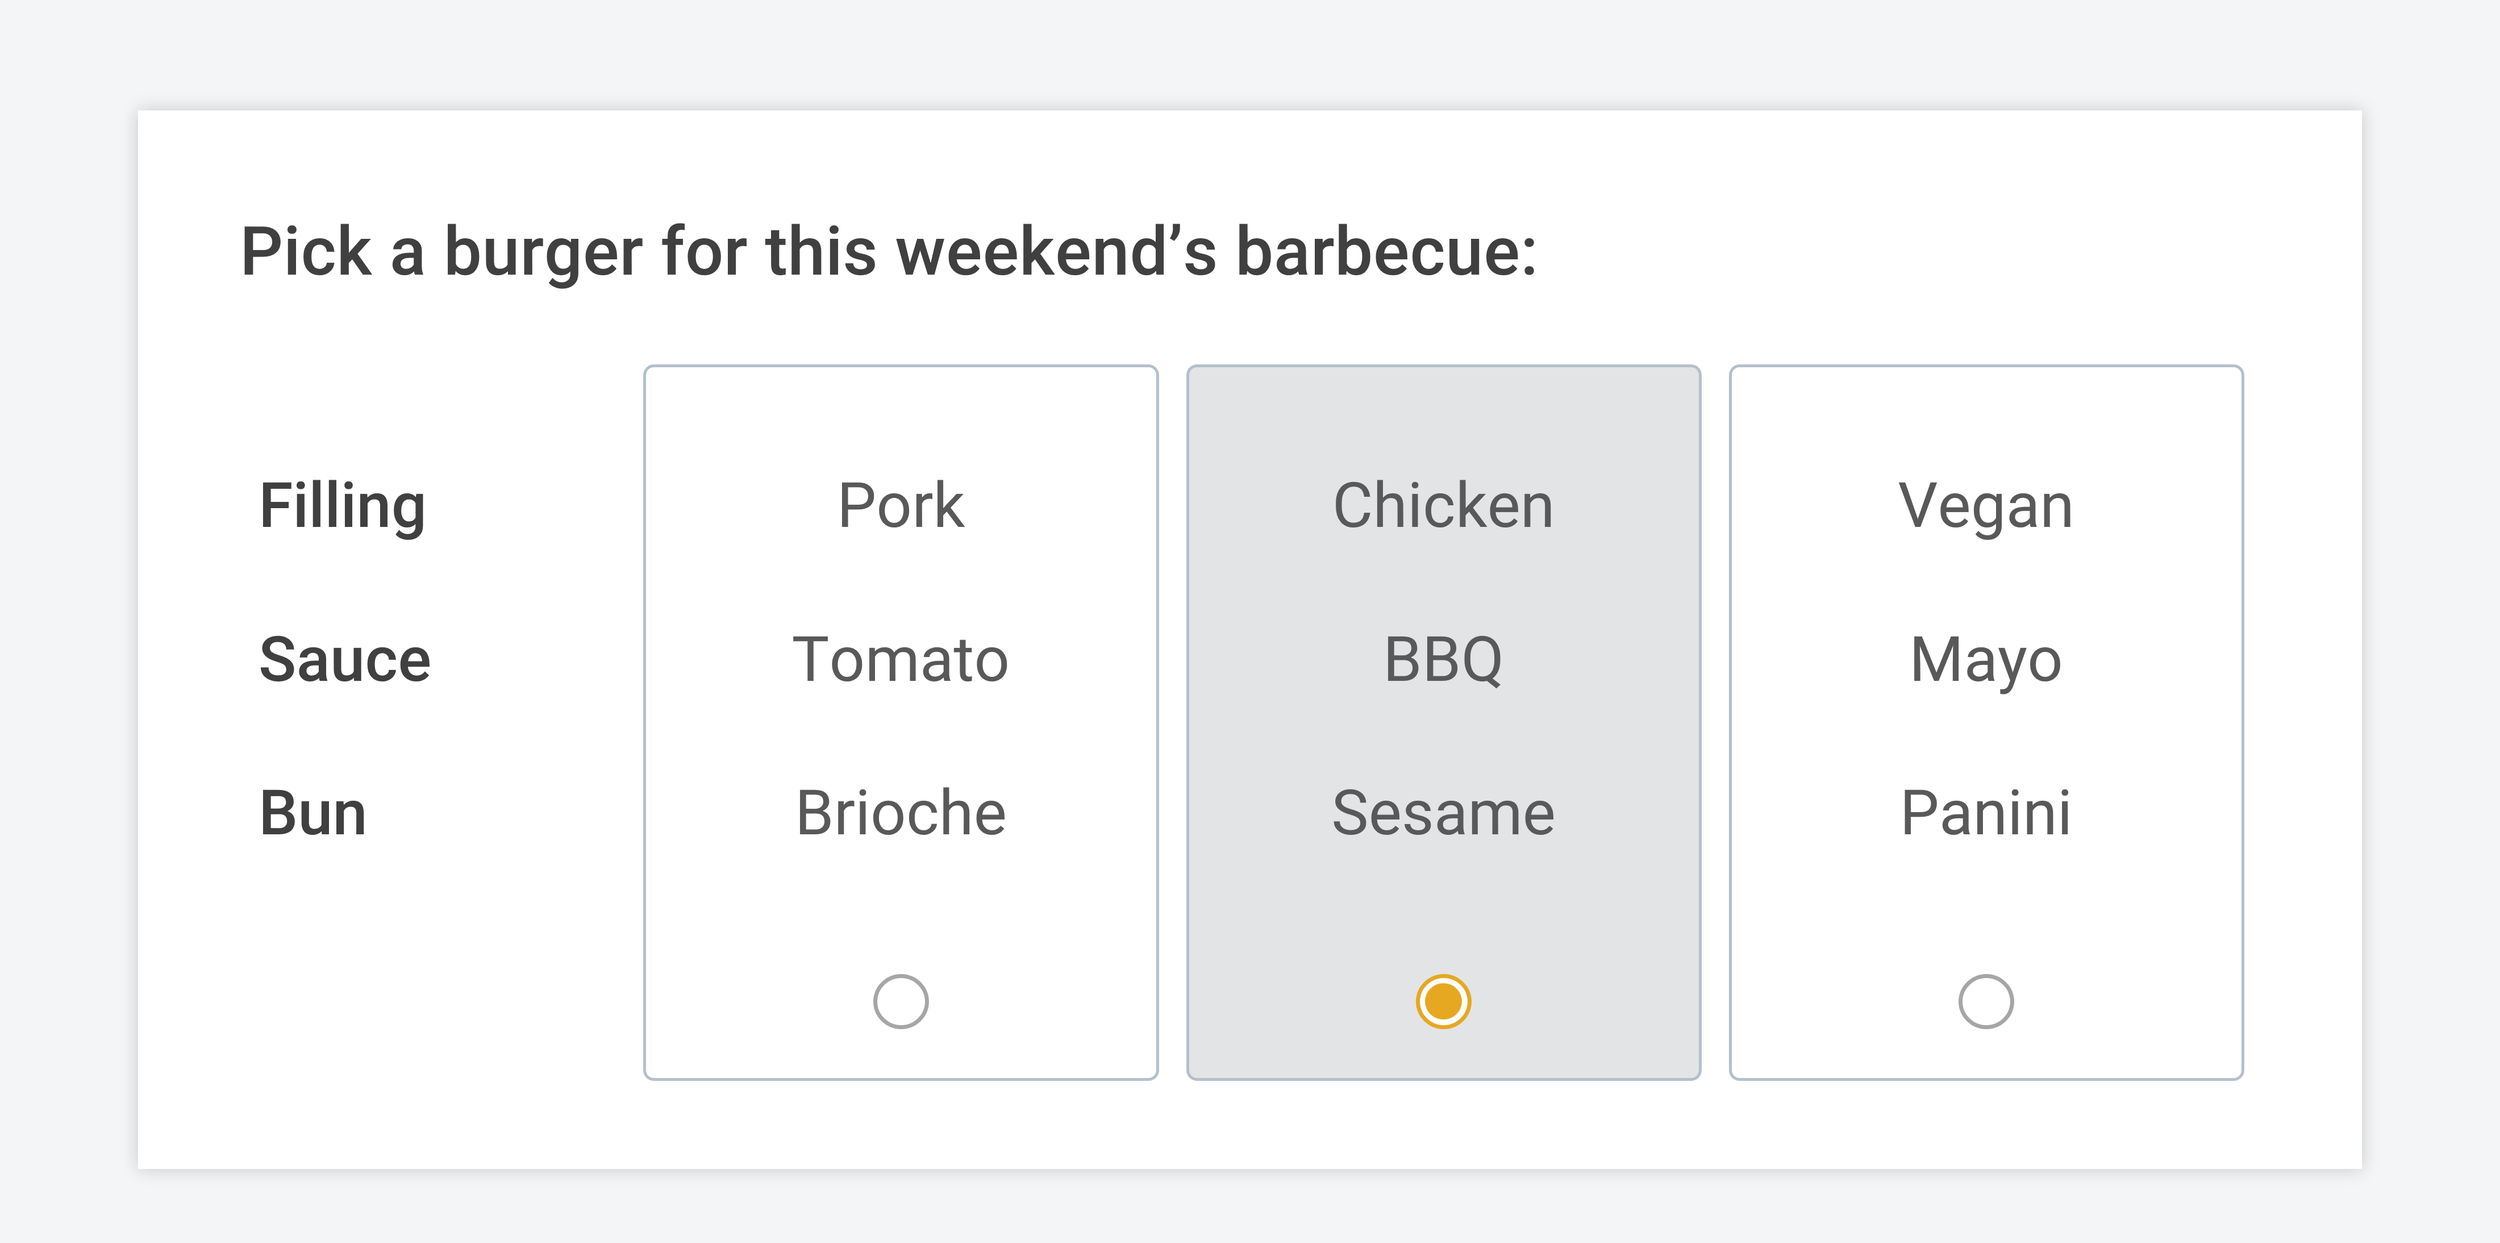
You’re running a conjoint survey to decide what burger to prepare for your weekend barbecue. You pick three burger attributes: filling, sauce, and bun type. Each attribute has four ’levels’ — for burger fillings, you decide to include pork, chicken, vegan, and beef options.
Our barbecue conjoint can help us answer questions like:
1. Within the overall burger, which attributes are most important to people? Is the choice of filling more important than the sauce? Is the sauce more important than the bun type?
2. Within each attribute, which ’levels’ have the highest relative importance to people? For the filling, will people be more interested in having our burgers if we switch the pork filling to a chicken, beef or vegan patty instead?

Conjoint Analysis Result — Relative Importance of Attributes (left) and Levels (right)
Our results (above) show that:
1. When people make decisions about which burger they want, 50% of their decision is based on the filling. In comparison, the bun only accounted for 10% of people’s preferences.
2. Beef and chicken were the two most popular fillings.
— — —
13 Conjoint Analysis Methods
1. Choice-Based
2. Best-Worst
3. Ranking
4. Constant Sum
5. Rating
6. Volumetric
7. Full-Profile
8. Menu-Based
10. Dual-Response
11. Adaptive
12. Time-Series
13. Latent Class
— — —
13 Most Common Conjoint Analysis Methods
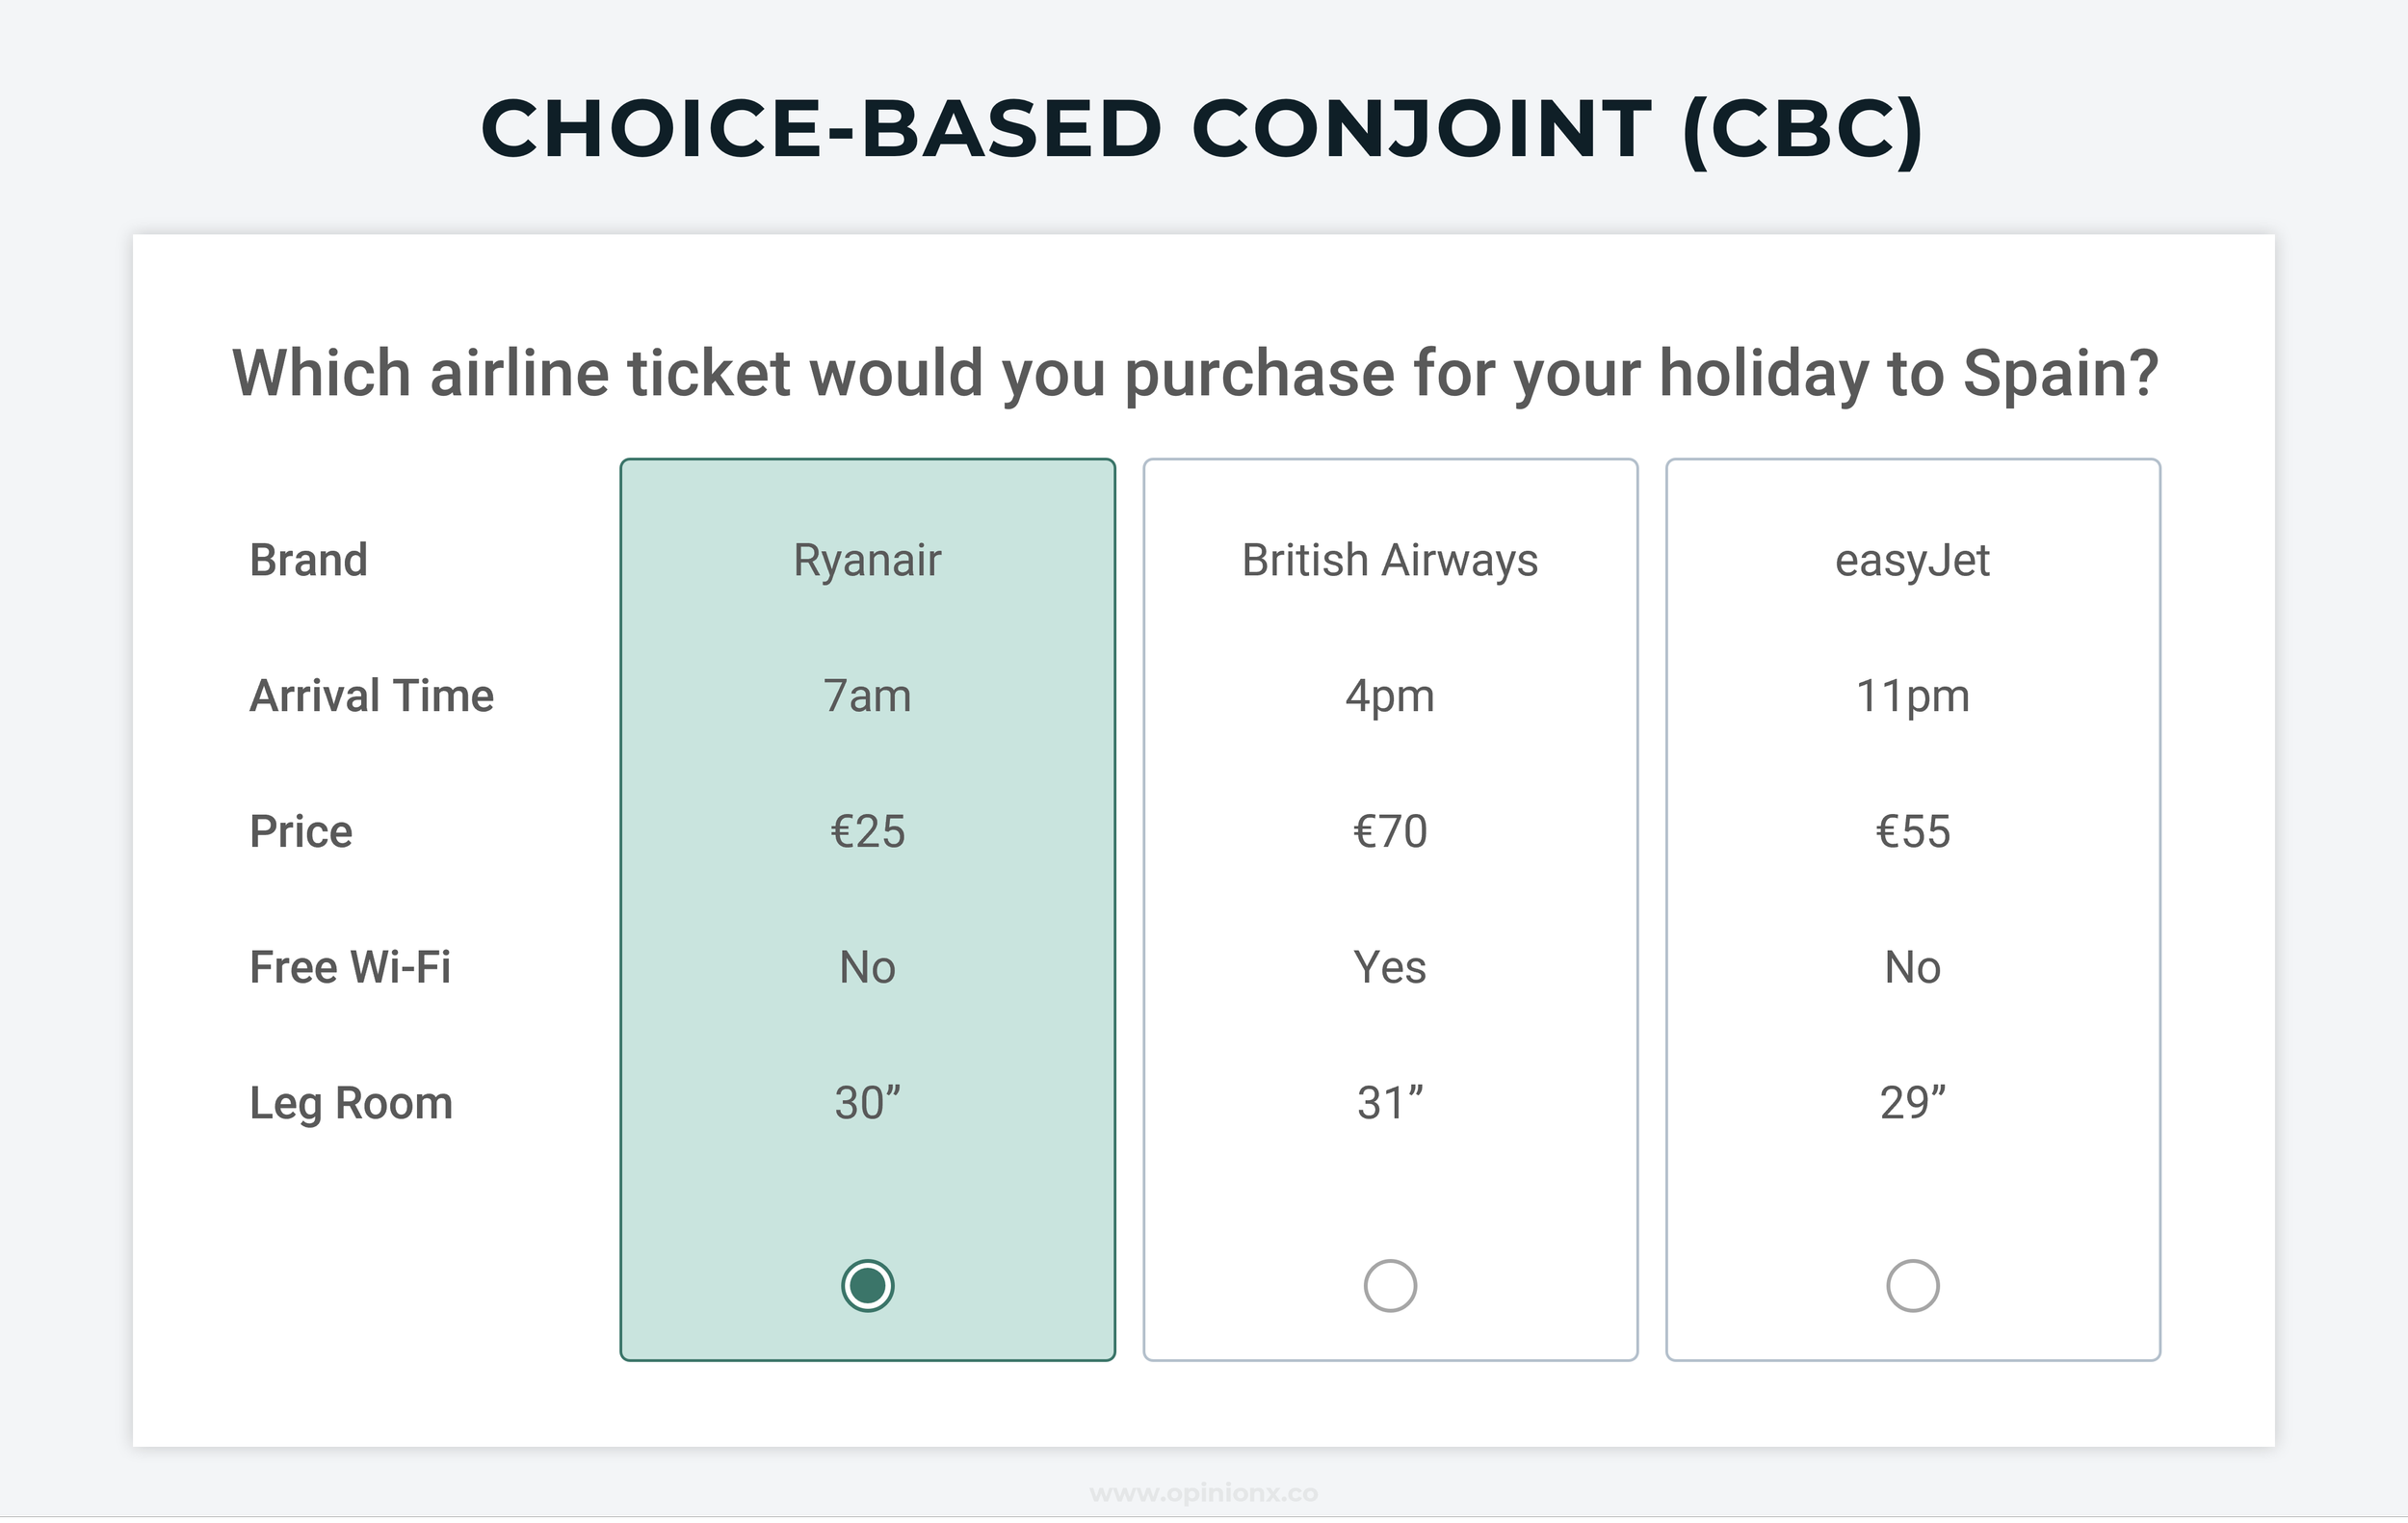
1. Choice-Based Conjoint Analysis (CBC)
Choice-Based Conjoint (CBC) is the most common survey format used to run conjoint analysis research. Respondents are shown a set of product “profiles” (usually 2-6 at a time) and asked to choose the option they prefer most or would be most likely to buy. This is repeated multiple times, with the attribute “levels” in a profile changing each time the respondent votes.
OpinionX is a free tool for creating Choice-Based Conjoint Analysis surveys. You can set as many attribute categories and level options as you’d like for free and you can engage unlimited participants for free too! Free conjoint surveys on OpinionX only show two profiles at a time, premium tiers offer customizations like a custom number of profiles and advanced segmentation analysis of your results.
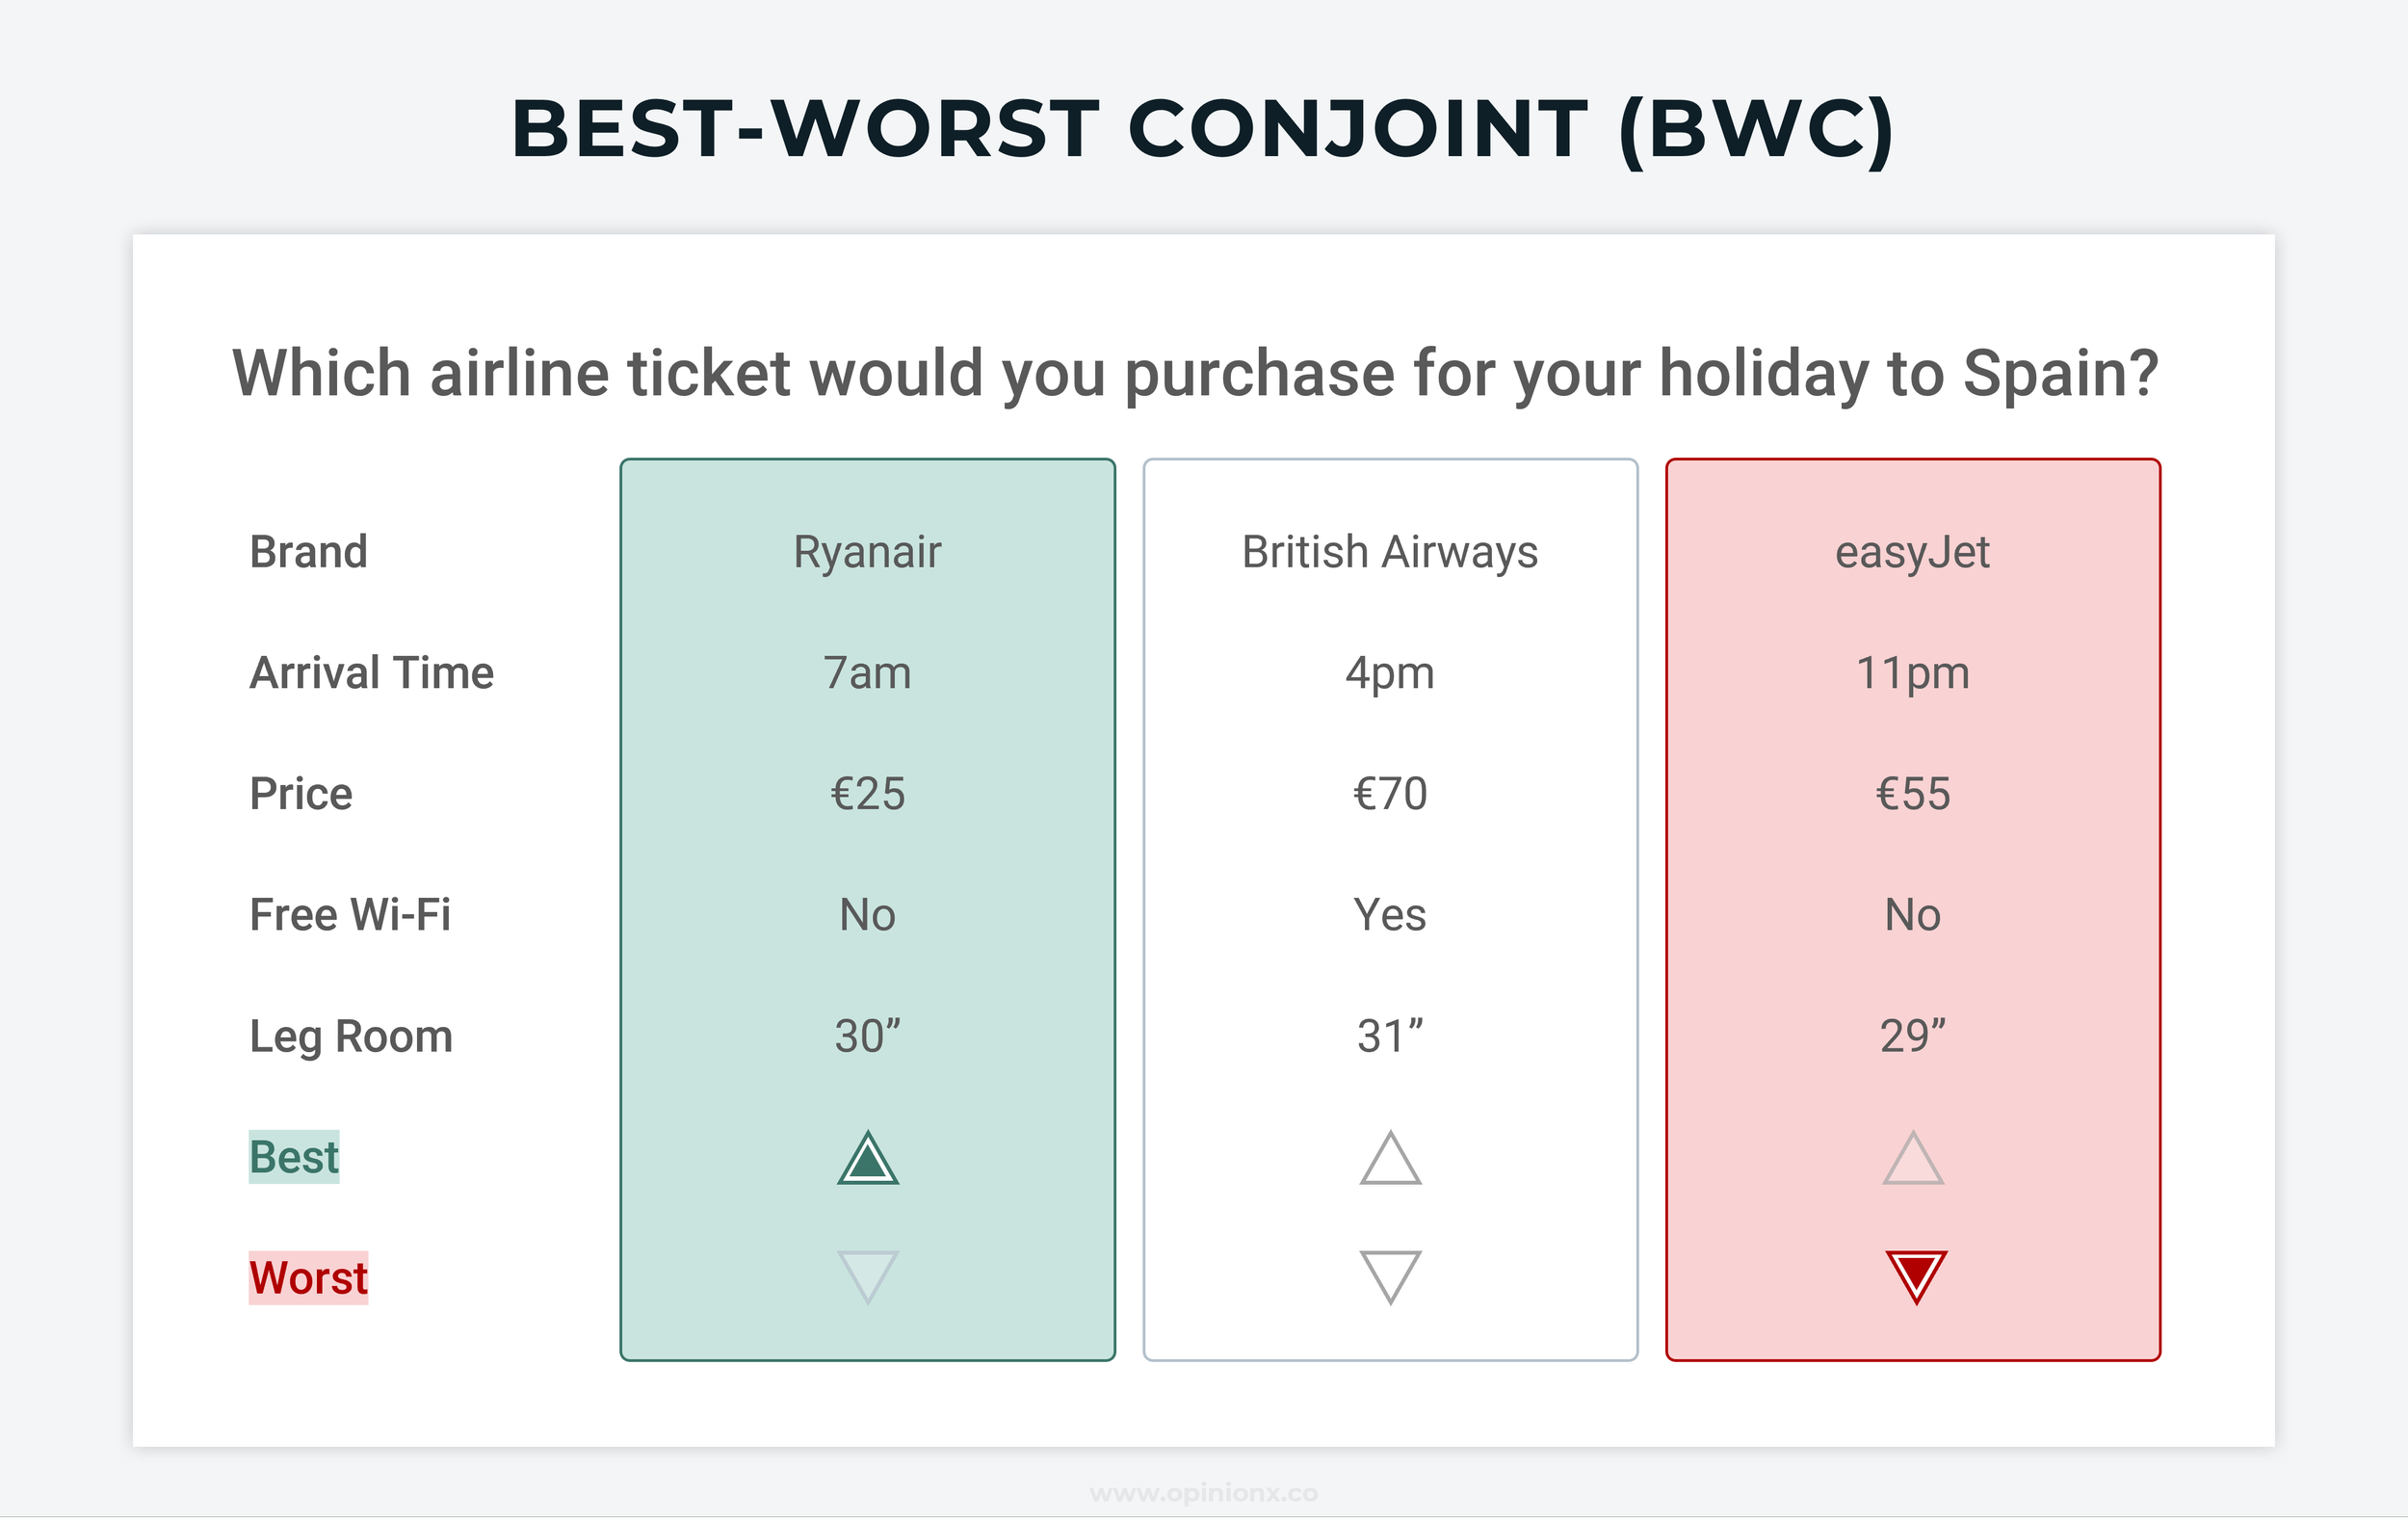
2. Best-Worst Conjoint Analysis (BWC)
Respondents identify the “best” and “worst” options from the set of profiles shown. This approach combines the voting format of MaxDiff Analysis (which is a form of best-worst scaling) with the attribute-based profiles structure of Conjoint Analysis. It requires some extra work from respondents, but collects more data per set of profiles shown. OpinionX does not have a Best/Worst Conjoint format, but it does offer free Best/Worst MaxDiff surveys with single-variable voting options.

3. Ranking-Based Conjoint Analysis (RBC)
Instead of respondents selecting just one profile or the best/worst options, they rank all the profiles from 1st to last. It uses the format from ranked choice voting, which is one of the best-known survey formats for ranking things, and applies it to conjoint analysis.
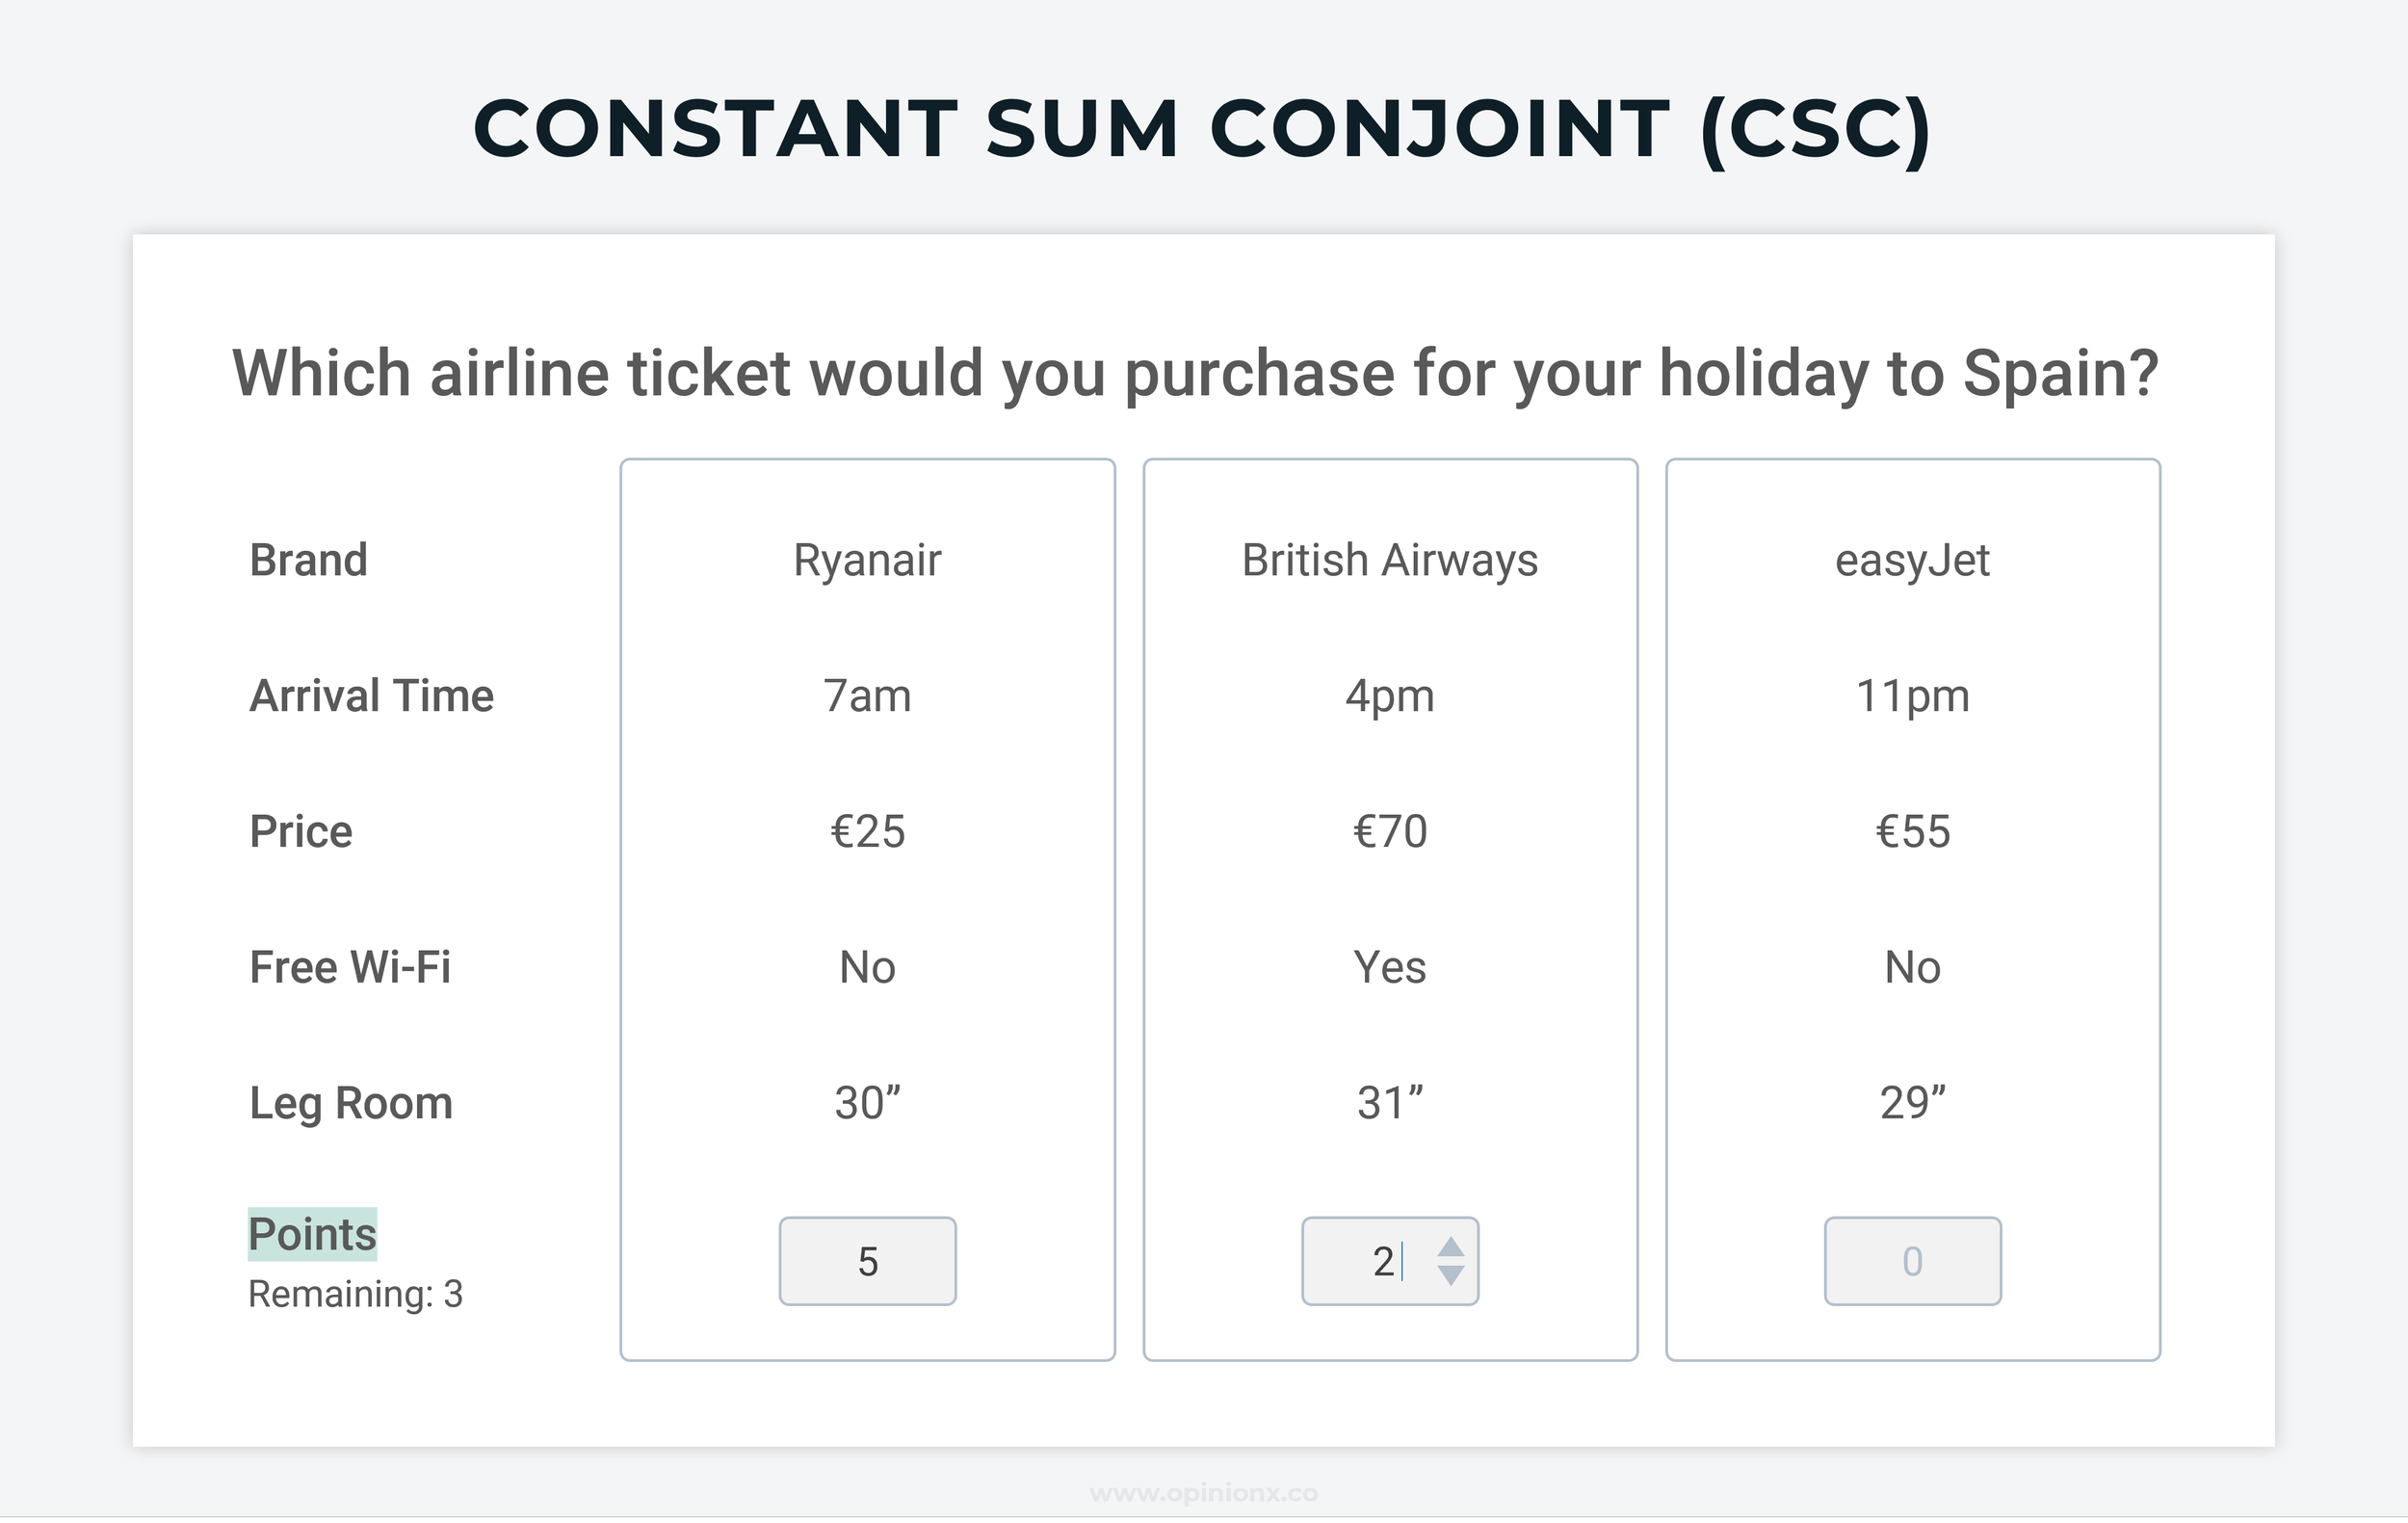
4. Constant Sum Conjoint Analysis (CSC)
Respondents are given a fixed number of points that they can allocate amongst the profiles shown in whatever distribution they choose, allowing them to show the magnitude of their preference towards the profiles shown. This approach combines the Constant Sum (also known as Points Allocation) format of normal ranking surveys with profiles-based voting in Conjoint Analysis.
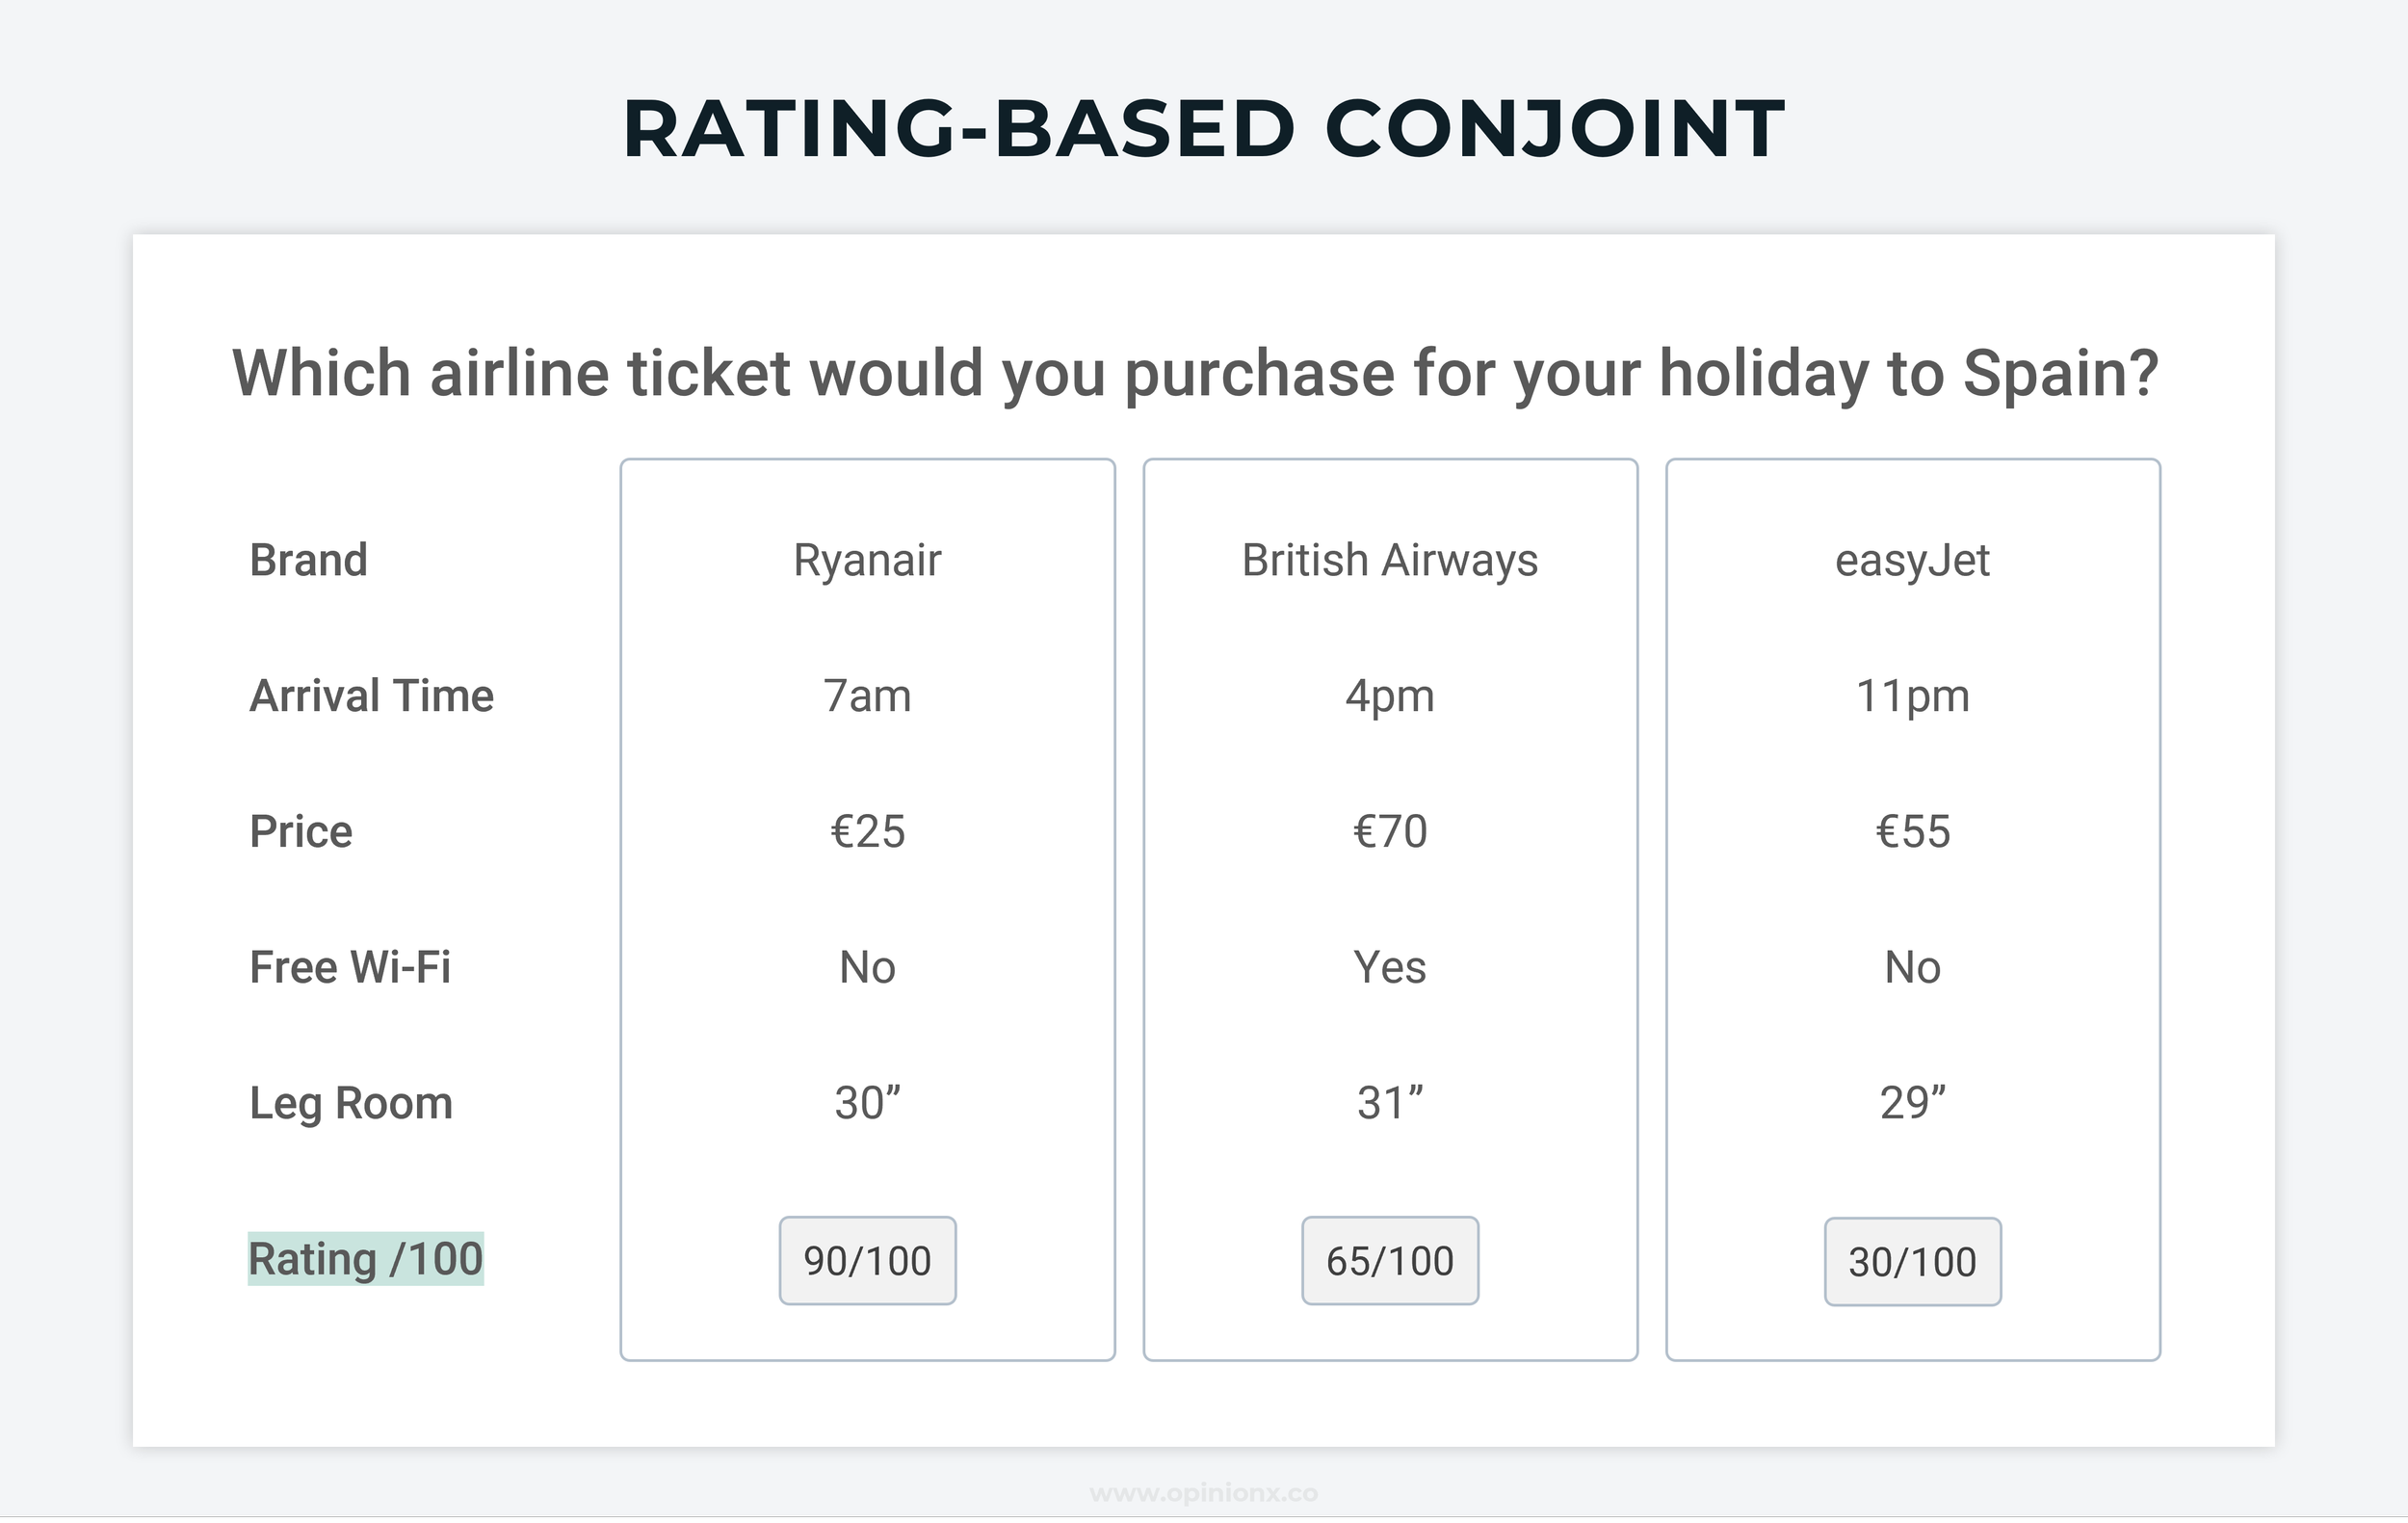
5. Rating-Based Conjoint Analysis
Respondents are asked to rate each profile shown on a scale from 0 to 100. Rating-based approaches are generally not recommended for understanding the relative importance people feel towards a set of options, as respondents tend to use a small range of the available points (eg. giving everything 60-80 points). Rating-based approaches also allow for ties, producing a higher proportion of useless data when it comes to calculating relative importance.
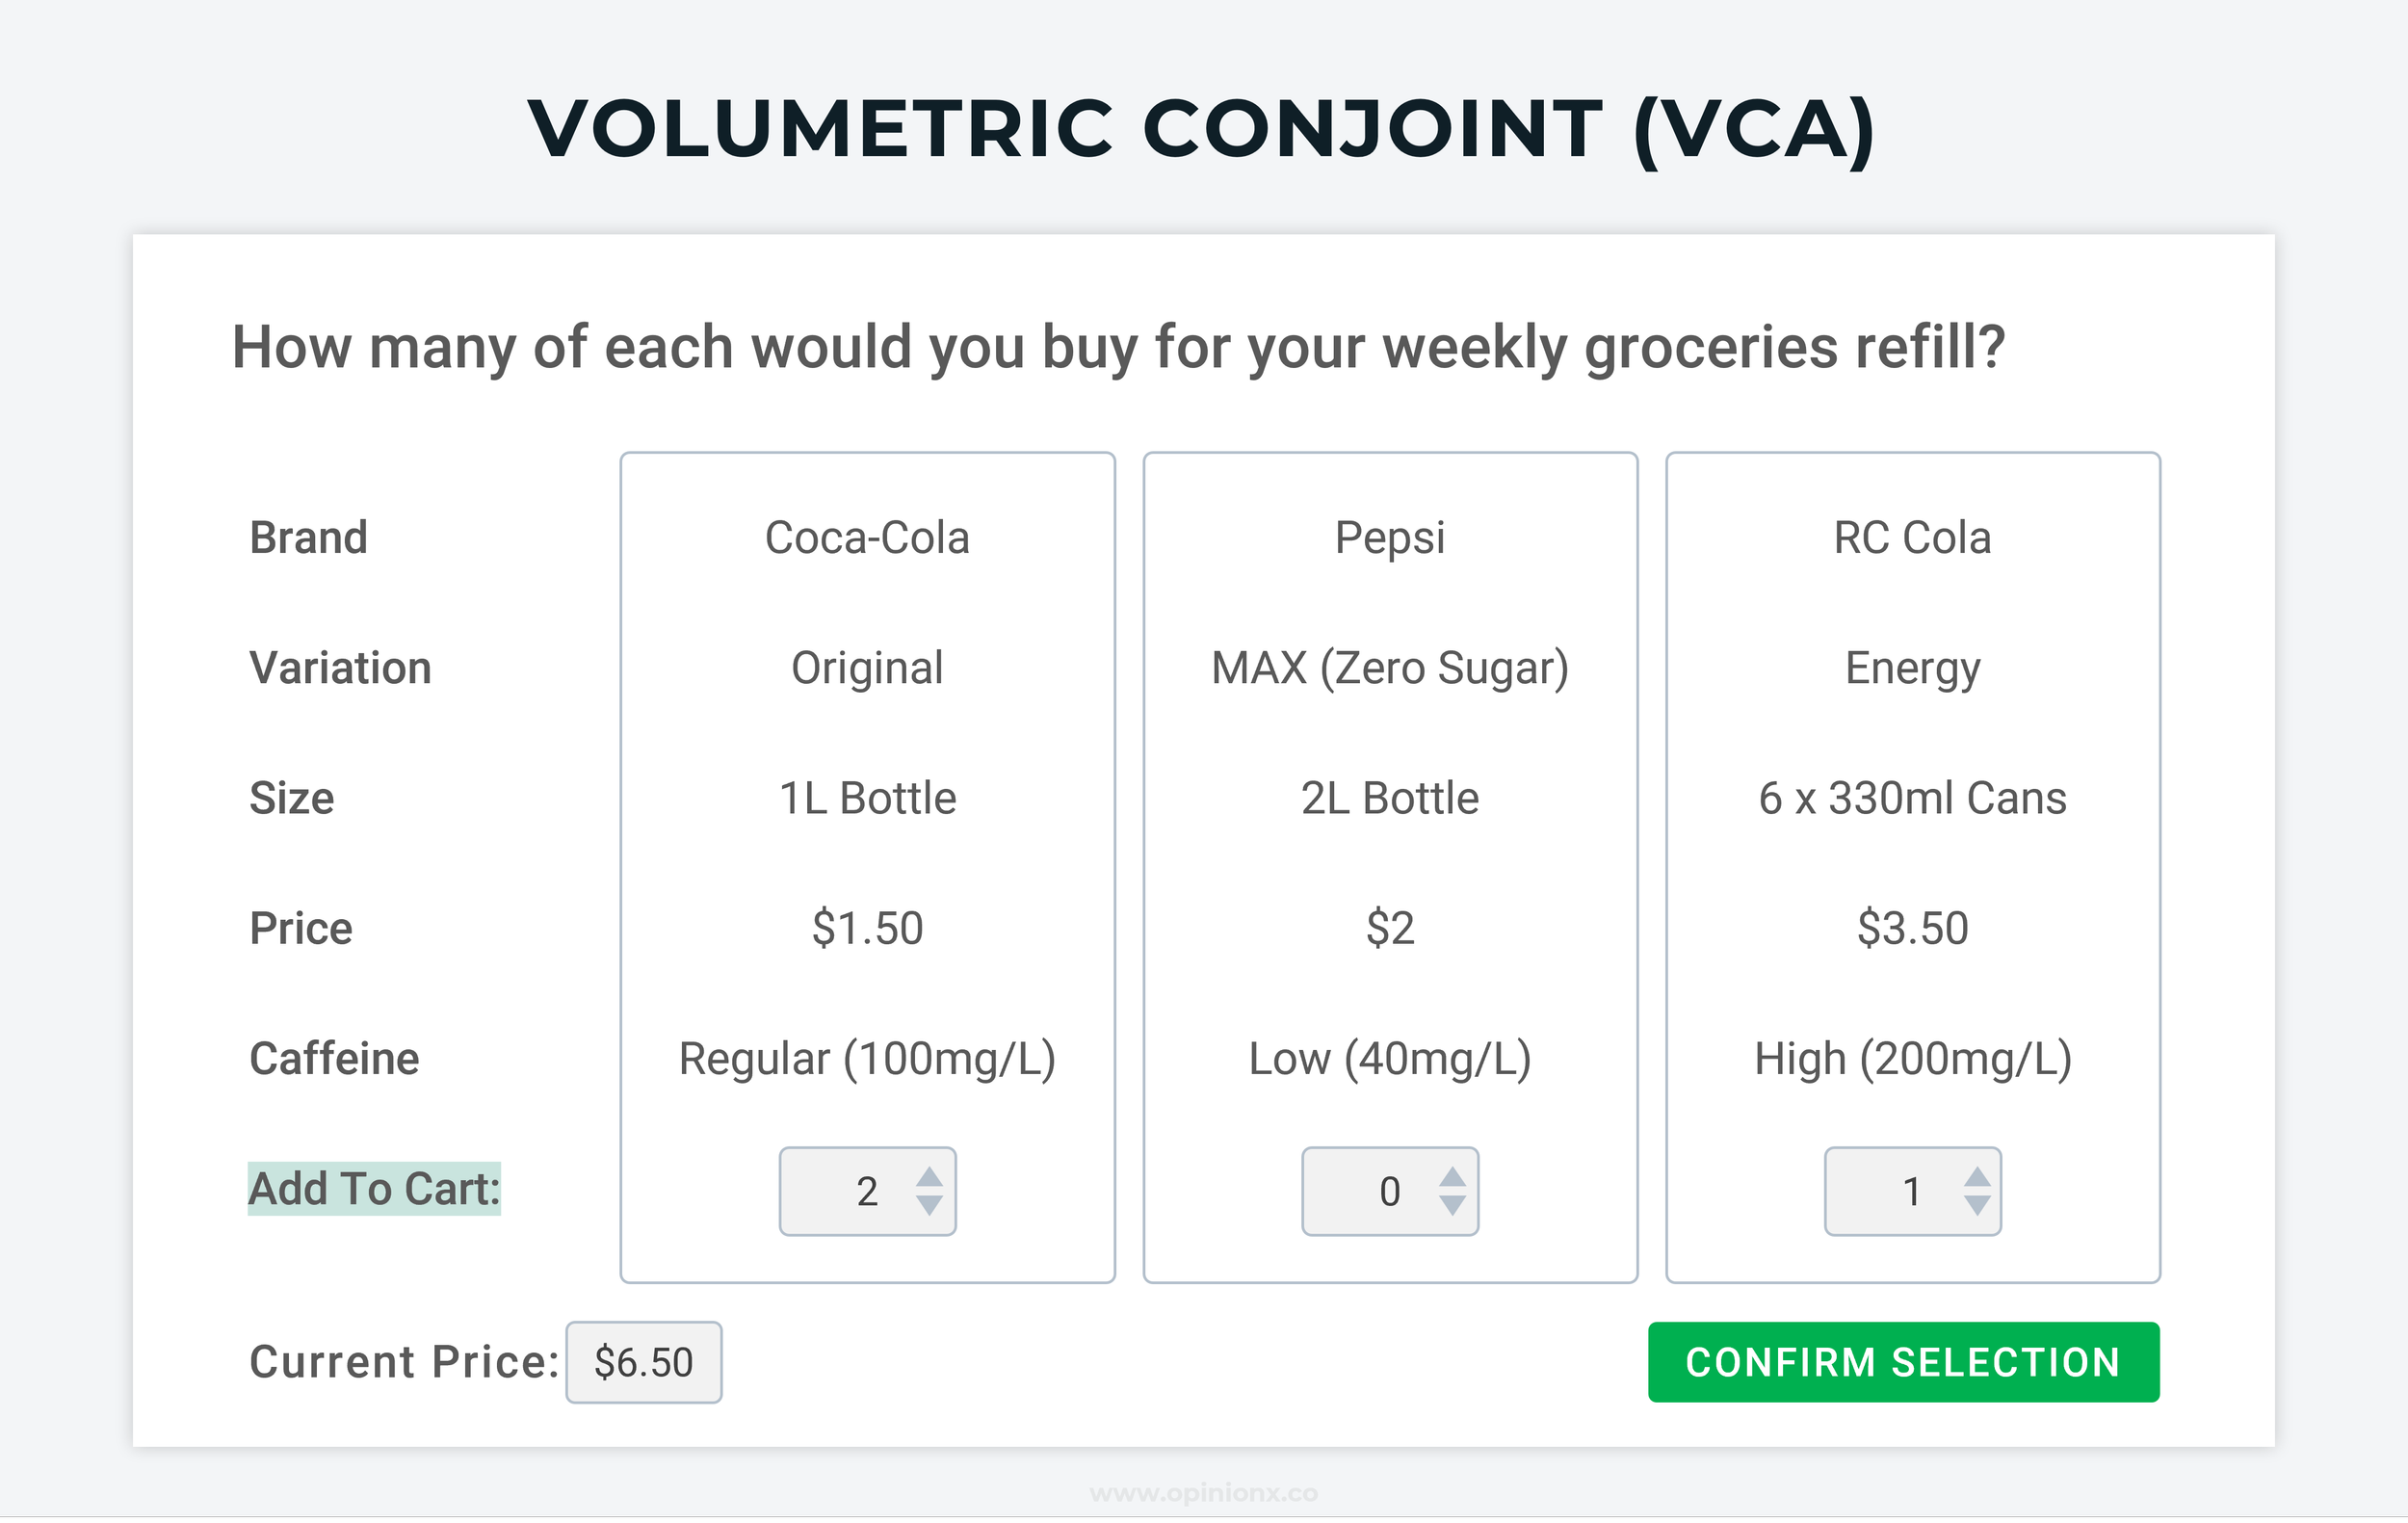
6. Volumetric Conjoint Analysis (VCA)
Respondents are given a scenario or task and told they can purchase as many of each product profile as they choose. Volumetric conjoint allows pricing to become a more realistic constraint in how respondents choose profiles — particularly when a limit is put on the budget they can spend on each set of profiles. This is similar to how a traditional points voting survey or constant sum question works.

7. Full-Profile Conjoint Analysis (FPC)
Full-Profile Conjoint follows a similar format to Choice-Based Conjoint, except the attribute levels on each profile are a static set of values that do not change. In this sense, it’s more like Pairwise Comparison or MaxDiff Analysis where respondents vote on single options rather than variable-based profiles. FPC is often used when you want to explore the overall attractiveness or appeal of different product configurations as a whole.
You can create Full-Profile Conjoint Analysis surveys on OpinionX — check out these interactive examples and our step-by-step guide to creating Full-Profile Conjoint surveys for more info.

8. Menu-Based Conjoint Analysis (MBC)
Respondents are then given a series of menus where they can build their preferred product or service by selecting one level from each attribute. The attributes available in each menu vary to test which attributes and levels have the highest relative importance to respondents.
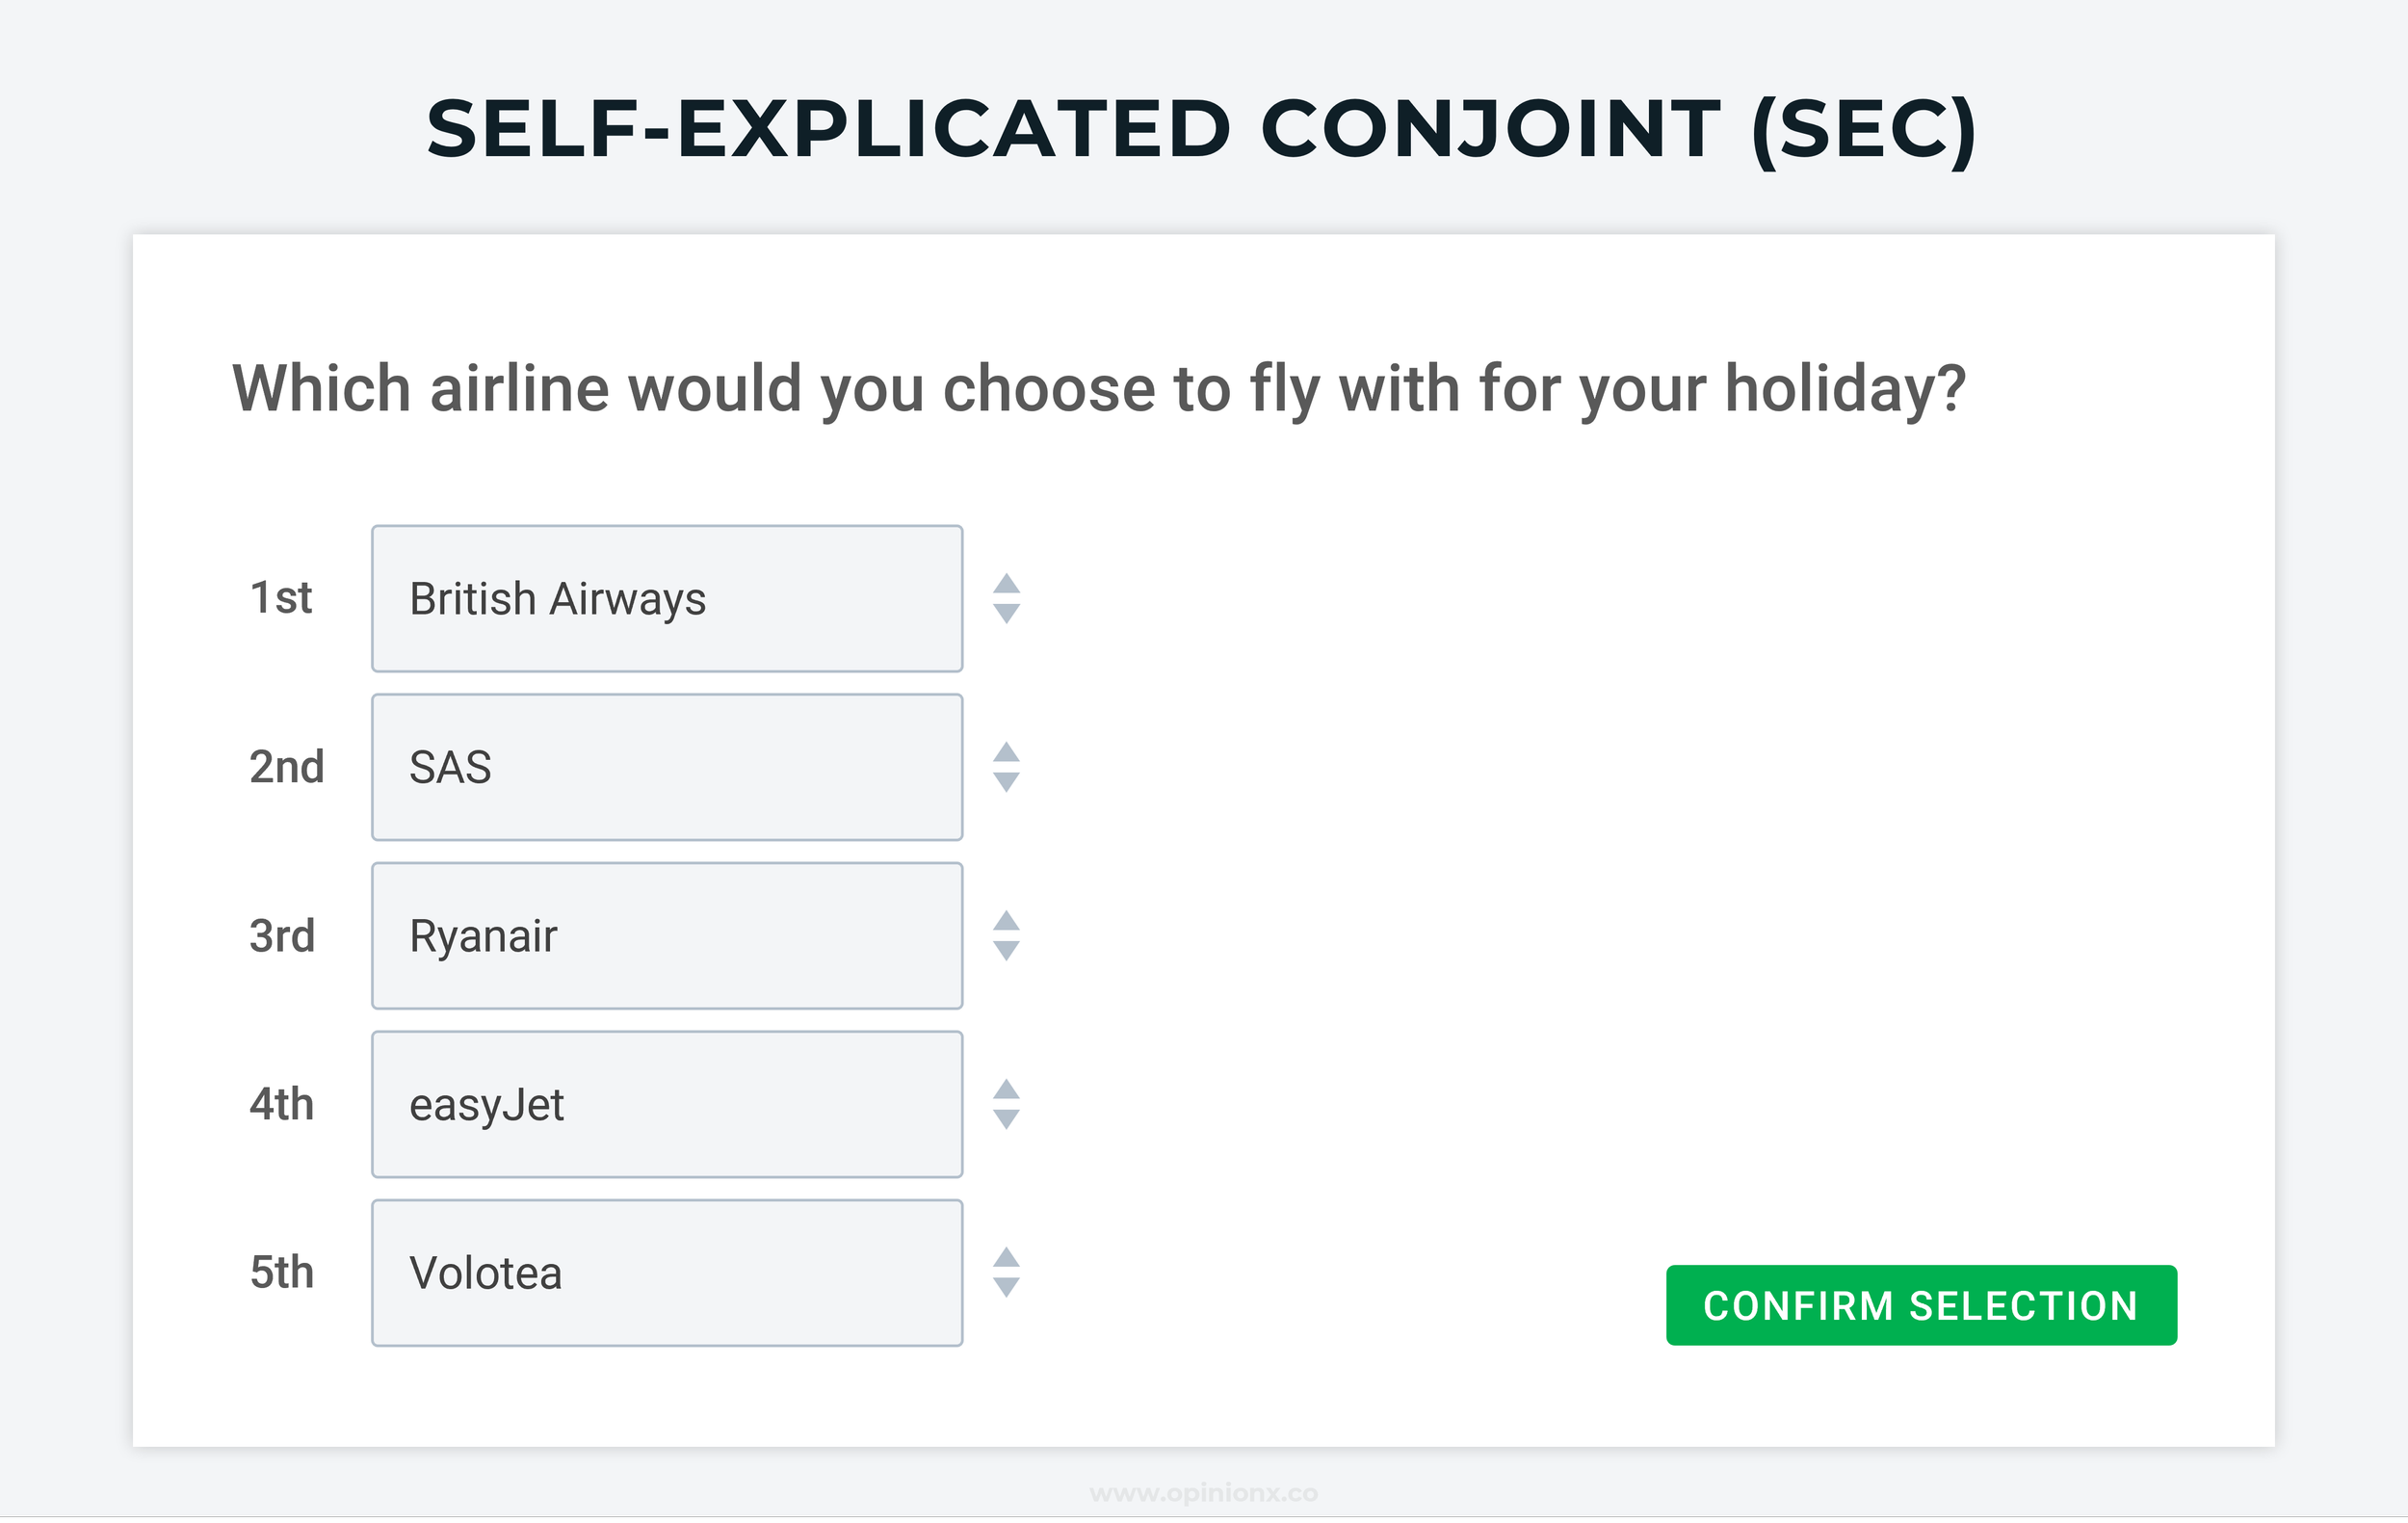
9. Self-Explicated Conjoint Analysis (SEC)
The Self-Explicated Conjoint isn’t really a conjoint analysis at all — it uses the same setup as a conjoint, where you assign a number of attributes (categories) and the range of “levels” (options) for each attribute. But then it asks the respondent to rank the levels altogether using a standard choice-based ranking format like points allocation, constant sum, maxdiff analysis, or ranked choice voting. Some other formats of Self-Explicated Conjoint use slightly different approaches, but overall it generally just breaks attributes down into attribute-by-attribute ranking exercises.
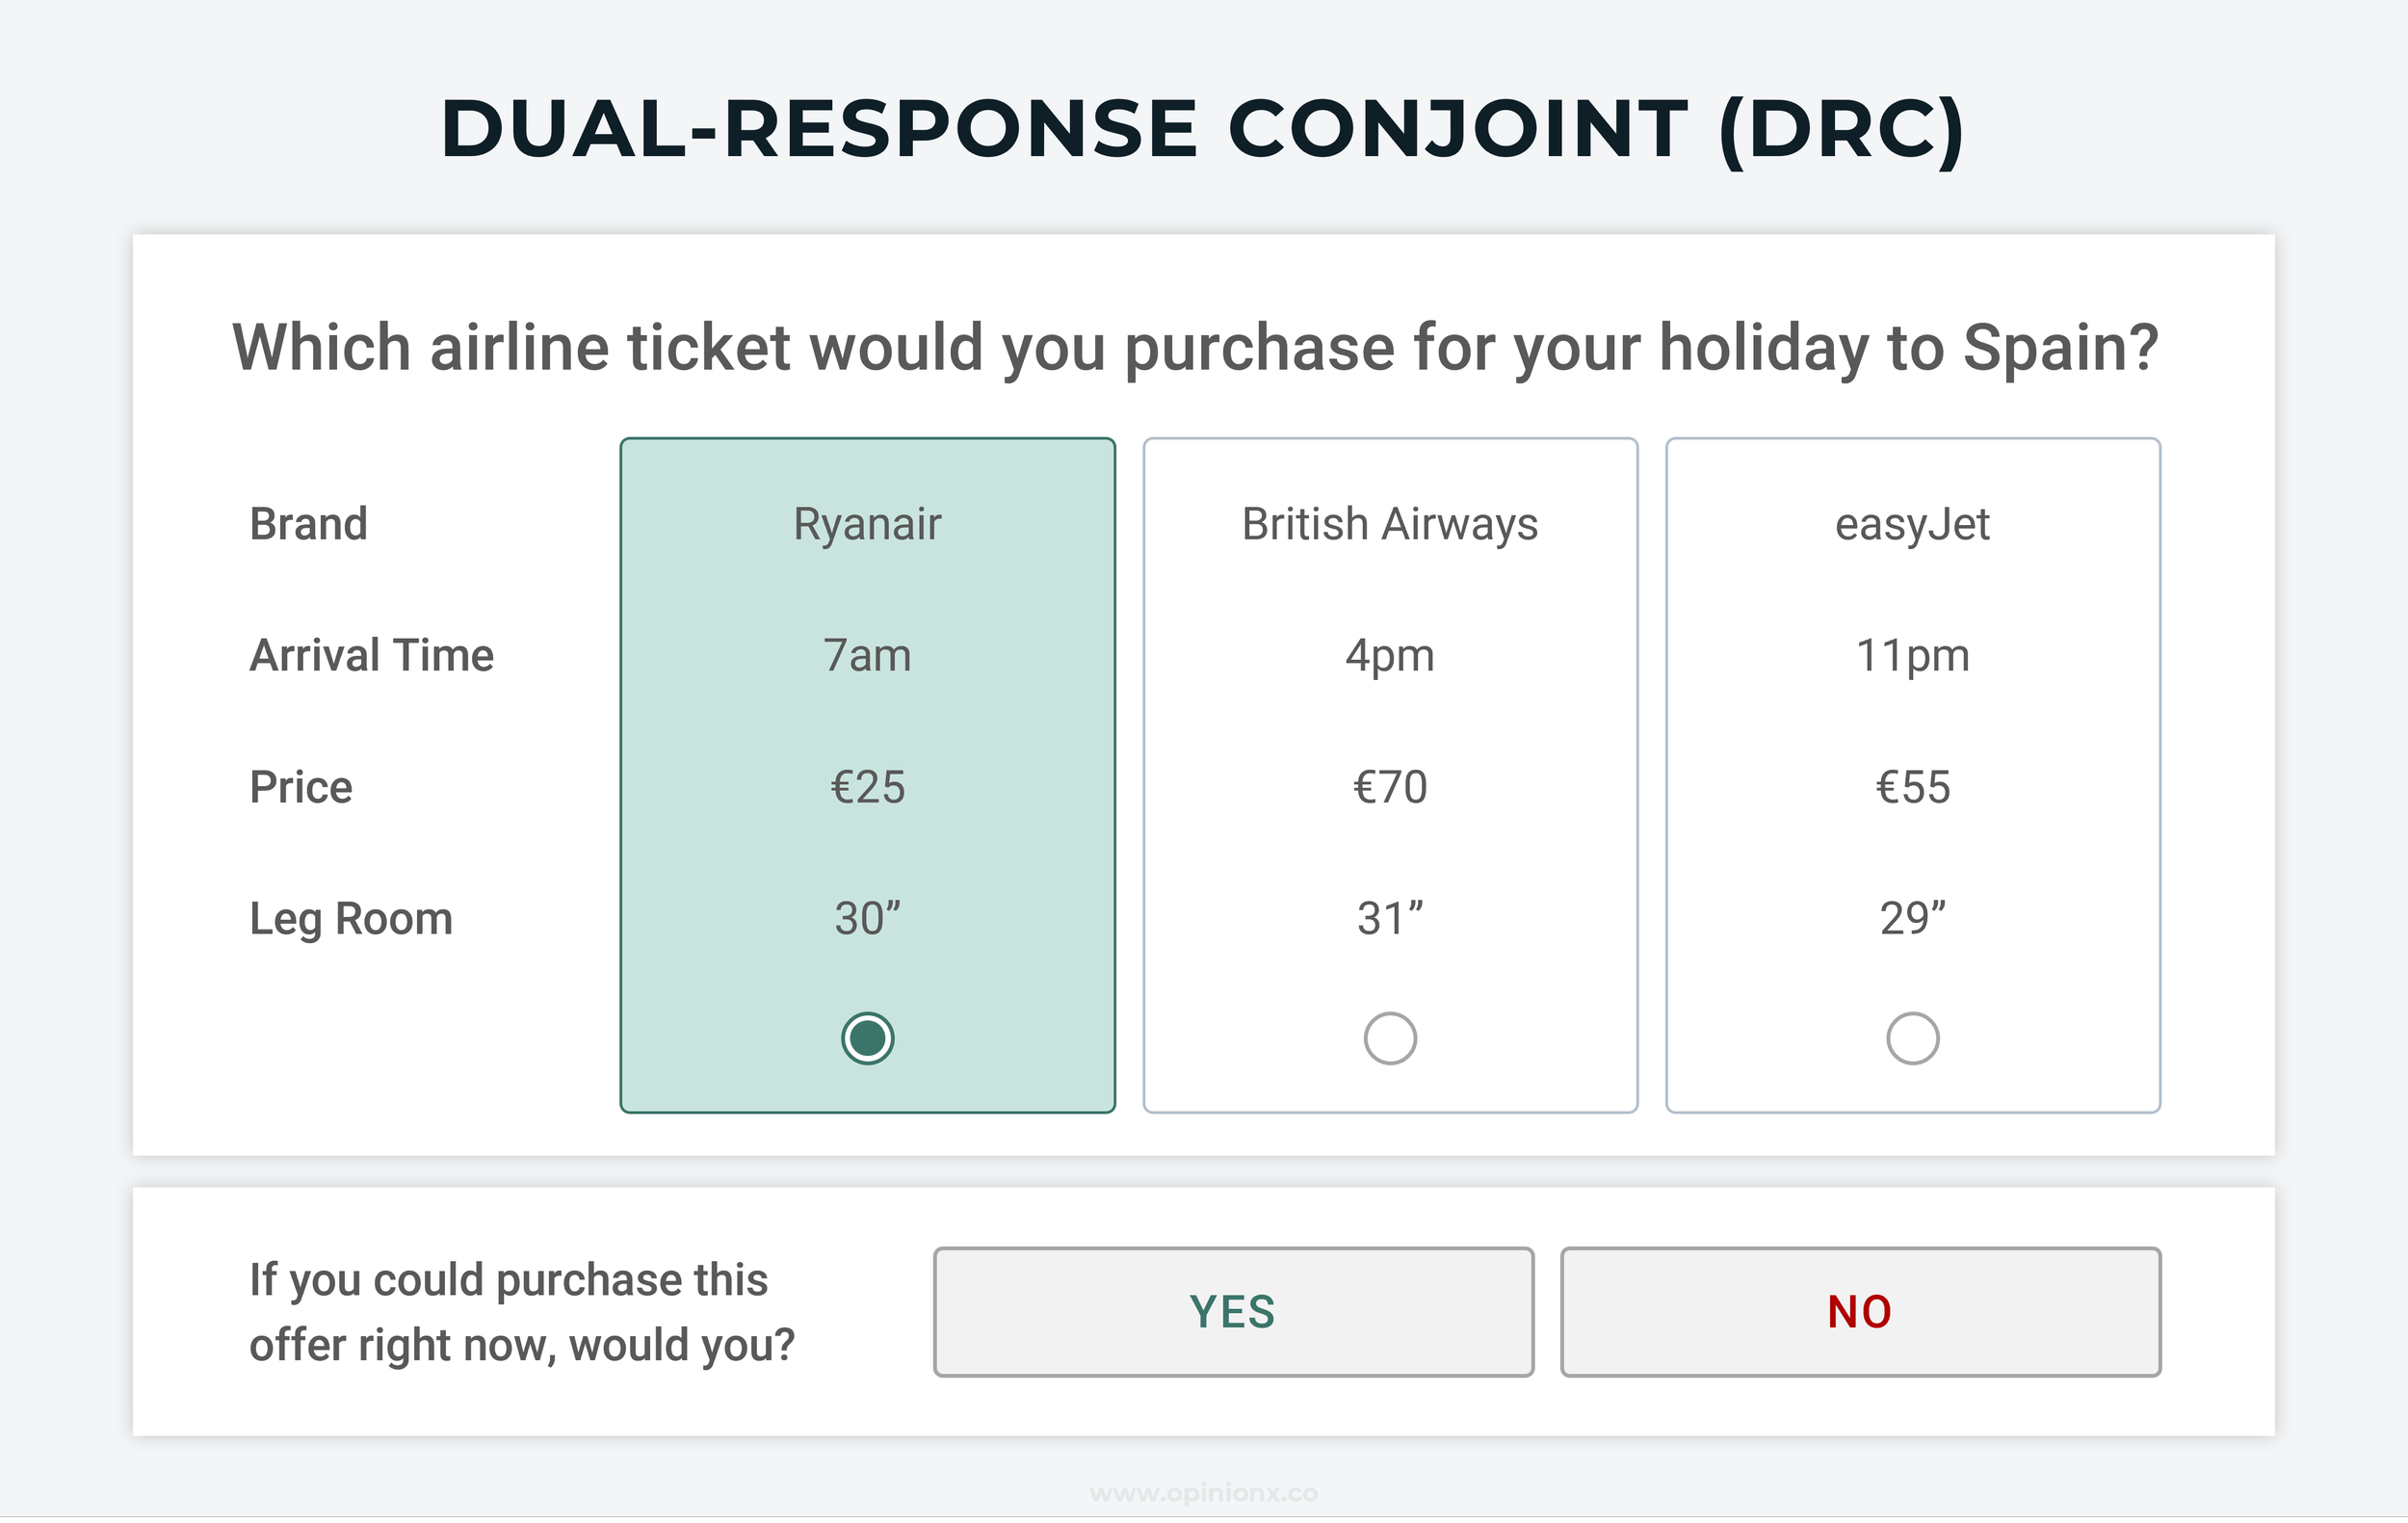
10. Dual-Response Conjoint Analysis (DRC)
Respondents complete a normal choice-based conjoint question initially (usually following the choice-based format), and then a follow-up question appears based on their choice. This breaks each set of profiles down into two data points — the selection of profile measures attractiveness, while the follow-up question measures likelihood of purchase.

11. Adaptive Conjoint Analysis (ACBC)
Adaptive conjoint surveys learn from respondents’ choices and change what they show next. This can either be done through screening questions (ranking, rating, duel-response, etc.) or simply by learning from standard choice-based profile selection. You can apply this self-learning to any conjoint method, but Adaptive Choice-Based Conjoint (ACBC) is the most common adaptive method used. ACBC surveys take considerably longer for respondents to complete, are a lot harder to set up, and are much more expensive as you are always going to require expert support to design and analyze an adaptive conjoint survey.

12. Time-Series Conjoint Analysis (TSC)
Time-Series Conjoint is not actually a different format for asking conjoint questions — it is a different way to analyze conjoint results. A time-series analysis looks at respondents in “waves” based on when they completed the survey, helping researchers understand how preferences are changing over time.

13. Latent Class Conjoint Analysis
Latest Class Conjoint Analysis is not a survey format, it’s an approach to analyzing conjoint results. Latent Class is a way of looking at patterns in voting data that can be used to segment respondents into groups with similar preferences. This is a form of segmentation analysis (eg. needs-based segmentation).
Alongside offering free conjoint analysis surveys, OpinionX comes with advanced segmentation and filtering analysis features on its paid tiers. These analysis features automatically calculate segmented results for your conjoint surveys, enabling teams to conduct Latent Class Conjoint Analysis without the need for any expert (expensive!) data scientists.
— — —
When To Consider Using Conjoint Analysis?
Conjoint analysis simulates a purchase decision where a customer compares a group of similar products. It takes a very rational view that customers decide which product is their favorite by comparing individual attributes like price, brand, and features. That means that conjoint is really only suited to research scenarios:
That simulate a simple, well-considered purchase between similar products.
Where only one person is involved in the purchase decision.
Where the customer already knows what kind of product they need.
Where you know which attributes the customer use to compare products.
Where those attributes have no overlap in meaning or possible options.
These are very specific requirements because conjoint is a very specific research format! Examples of research projects that meet these criteria include:
Modeling market share scenarios against competitor products.
Informing a product bundling or product mix strategy.
Calculating willingness to pay for existing product attributes.
There are plenty of other research methods that model people’s preferences using forced trade-offs that give you a lot more flexibility than conjoint analysis for a much cheaper price.
— — —
Further Reading About Conjoint Analysis:
• The Ultimate Guide To Conjoint Analysis
• 8 alternatives to conjoint analysis for trade-off research
• 5 criteria for assessing whether conjoint analysis suits your research scenario
• 10 examples of research scenarios that should NOT use conjoint analysis
• 10 most popular tools for creating conjoint analysis surveys (Free vs Paid)
• How to calculate conjoint analysis results in 8 Steps [Advanced]
— — —
About The Author:
Daniel Kyne is the Co-Founder of OpinionX, a free research tool for stack ranking people’s priorities — used by thousands of product teams to better understand what matters most to their customers. OpinionX has a bunch of free research methods for ranking people’s preferences — including Conjoint-style ranking methods like Pairwise Comparison and Constant Sum. Try it now!
Subscribe to The Full-Stack Researcher newsletter, where we share research strategies for founders and product teams: