
The Most Misunderstood Research Method In All The Land
“Conjoint analysis is one of the most misunderstood methods in user research. People reach for it thinking it means “measuring what matters most to customers”, but it only measures that in a specific case: comparing products in a purchase decision. It’s a genuinely excellent revealed-preference method for that job (willingness to pay, market-share modelling, product bundling), but it carries strict conditions (one decision-maker, easily comparable products, a customer who already knows what they need, and known attributes) that rarely hold for B2B or discovery research. Most people asking about conjoint actually want a simpler discrete-choice method like ranked choice voting, pairwise comparison, MaxDiff, or constant sum. This piece explains what conjoint is genuinely for, why it’s so often misapplied, and how to pick the right method instead.”
At least twice a month, I stumble across someone asking for advice about conjoint analysis. In most cases they don't know what conjoint is actually for. What's worse is how often the people replying don't understand what it's for either.
I've replied to so many of these posts recently that I figured it was time to share a simple explanation publicly, partly so I can send people this link instead of writing a new reply every time. The reason I bother isn't just that conjoint is extremely expensive (conjoint tools cost up to $30,000/year, and projects typically need a conjoint expert hired on top). It's that conjoint isn't well suited to most user research scenarios, and can even leave you with useless data that doesn't answer your core research objective.
This post covers five fundamental questions about conjoint analysis:
What is conjoint analysis? A quick definition and example.
Why do people so often misunderstand conjoint?
What's the right research approach to use?
When should I use conjoint analysis?
Where can I learn more?

What is conjoint analysis? (definition and example)
Conjoint analysis is a survey format that measures which attributes matter most to customers when they buy a product.
It presents a participant with 3-6 product "profiles", each made up of several "attributes". The participant compares the profiles and picks the one they like most. Then a new set of profiles loads, where the attribute categories are the same but the "levels" on each profile have changed. After a participant votes a few times, you can work out which attributes and levels influenced their decisions most.
Here's a quick example. You're hosting a barbecue this weekend and want a combination of burger ingredients that appeals to the most people possible. You run a quick conjoint survey with three attributes (filling, sauce and bun) and four options each (attribute options are known as "levels").

The results tell you which of the three attributes people care about most, and which levels within each attribute have the highest appeal (example results below).

Why do people so often misunderstand conjoint?
Most people think conjoint just means "measuring what's most important to people". In reality, conjoint only measures what's most important when people are comparing products in a purchase scenario.
That creates a whole set of conditions for conjoint research: there can only be one person involved in the purchase decision, the range of products must be easily comparable, the customer must already know what kind of product they need, and the researcher has to know what attributes the customer uses to compare products. Most of these only hold in simple consumer-goods scenarios, like deciding which laptop, shampoo, or barbecue burgers to buy. That makes sense: conjoint was popularised by the market research industry in the 1980s, whose customers were typically consumer-goods companies.
Buying software or B2B products isn't like this at all. There's usually more than one person involved in the decision. Customers often don't know which product will solve their problems, or how to compare products directly.
B2B decisions tend to be more about addressing needs and pains, gaining perceived benefits, and hitting key goals. Those intangible attributes are impossible to measure in a conjoint survey. Not impossible to measure at all, though, you just need the right research method.
What's the right research approach to use?
Most times someone posts a question about conjoint analysis, what they're actually after is discrete-choice research, the umbrella category of methods that conjoint belongs to.
Discrete-choice analysis (also called "discrete-choice modelling" or "choice-based research") shows people a set of options and infers their preferences from the choices they make. It's built on the principle that stated preferences are fundamentally unreliable: people often don't know what they want, or are swayed by other forces when they articulate their preferences (social status, perceived intelligence, an idealistic self-image). Examples of stated-preference methods include Likert scale questions and NPS surveys. Revealed preferences tend to predict true behaviour better.
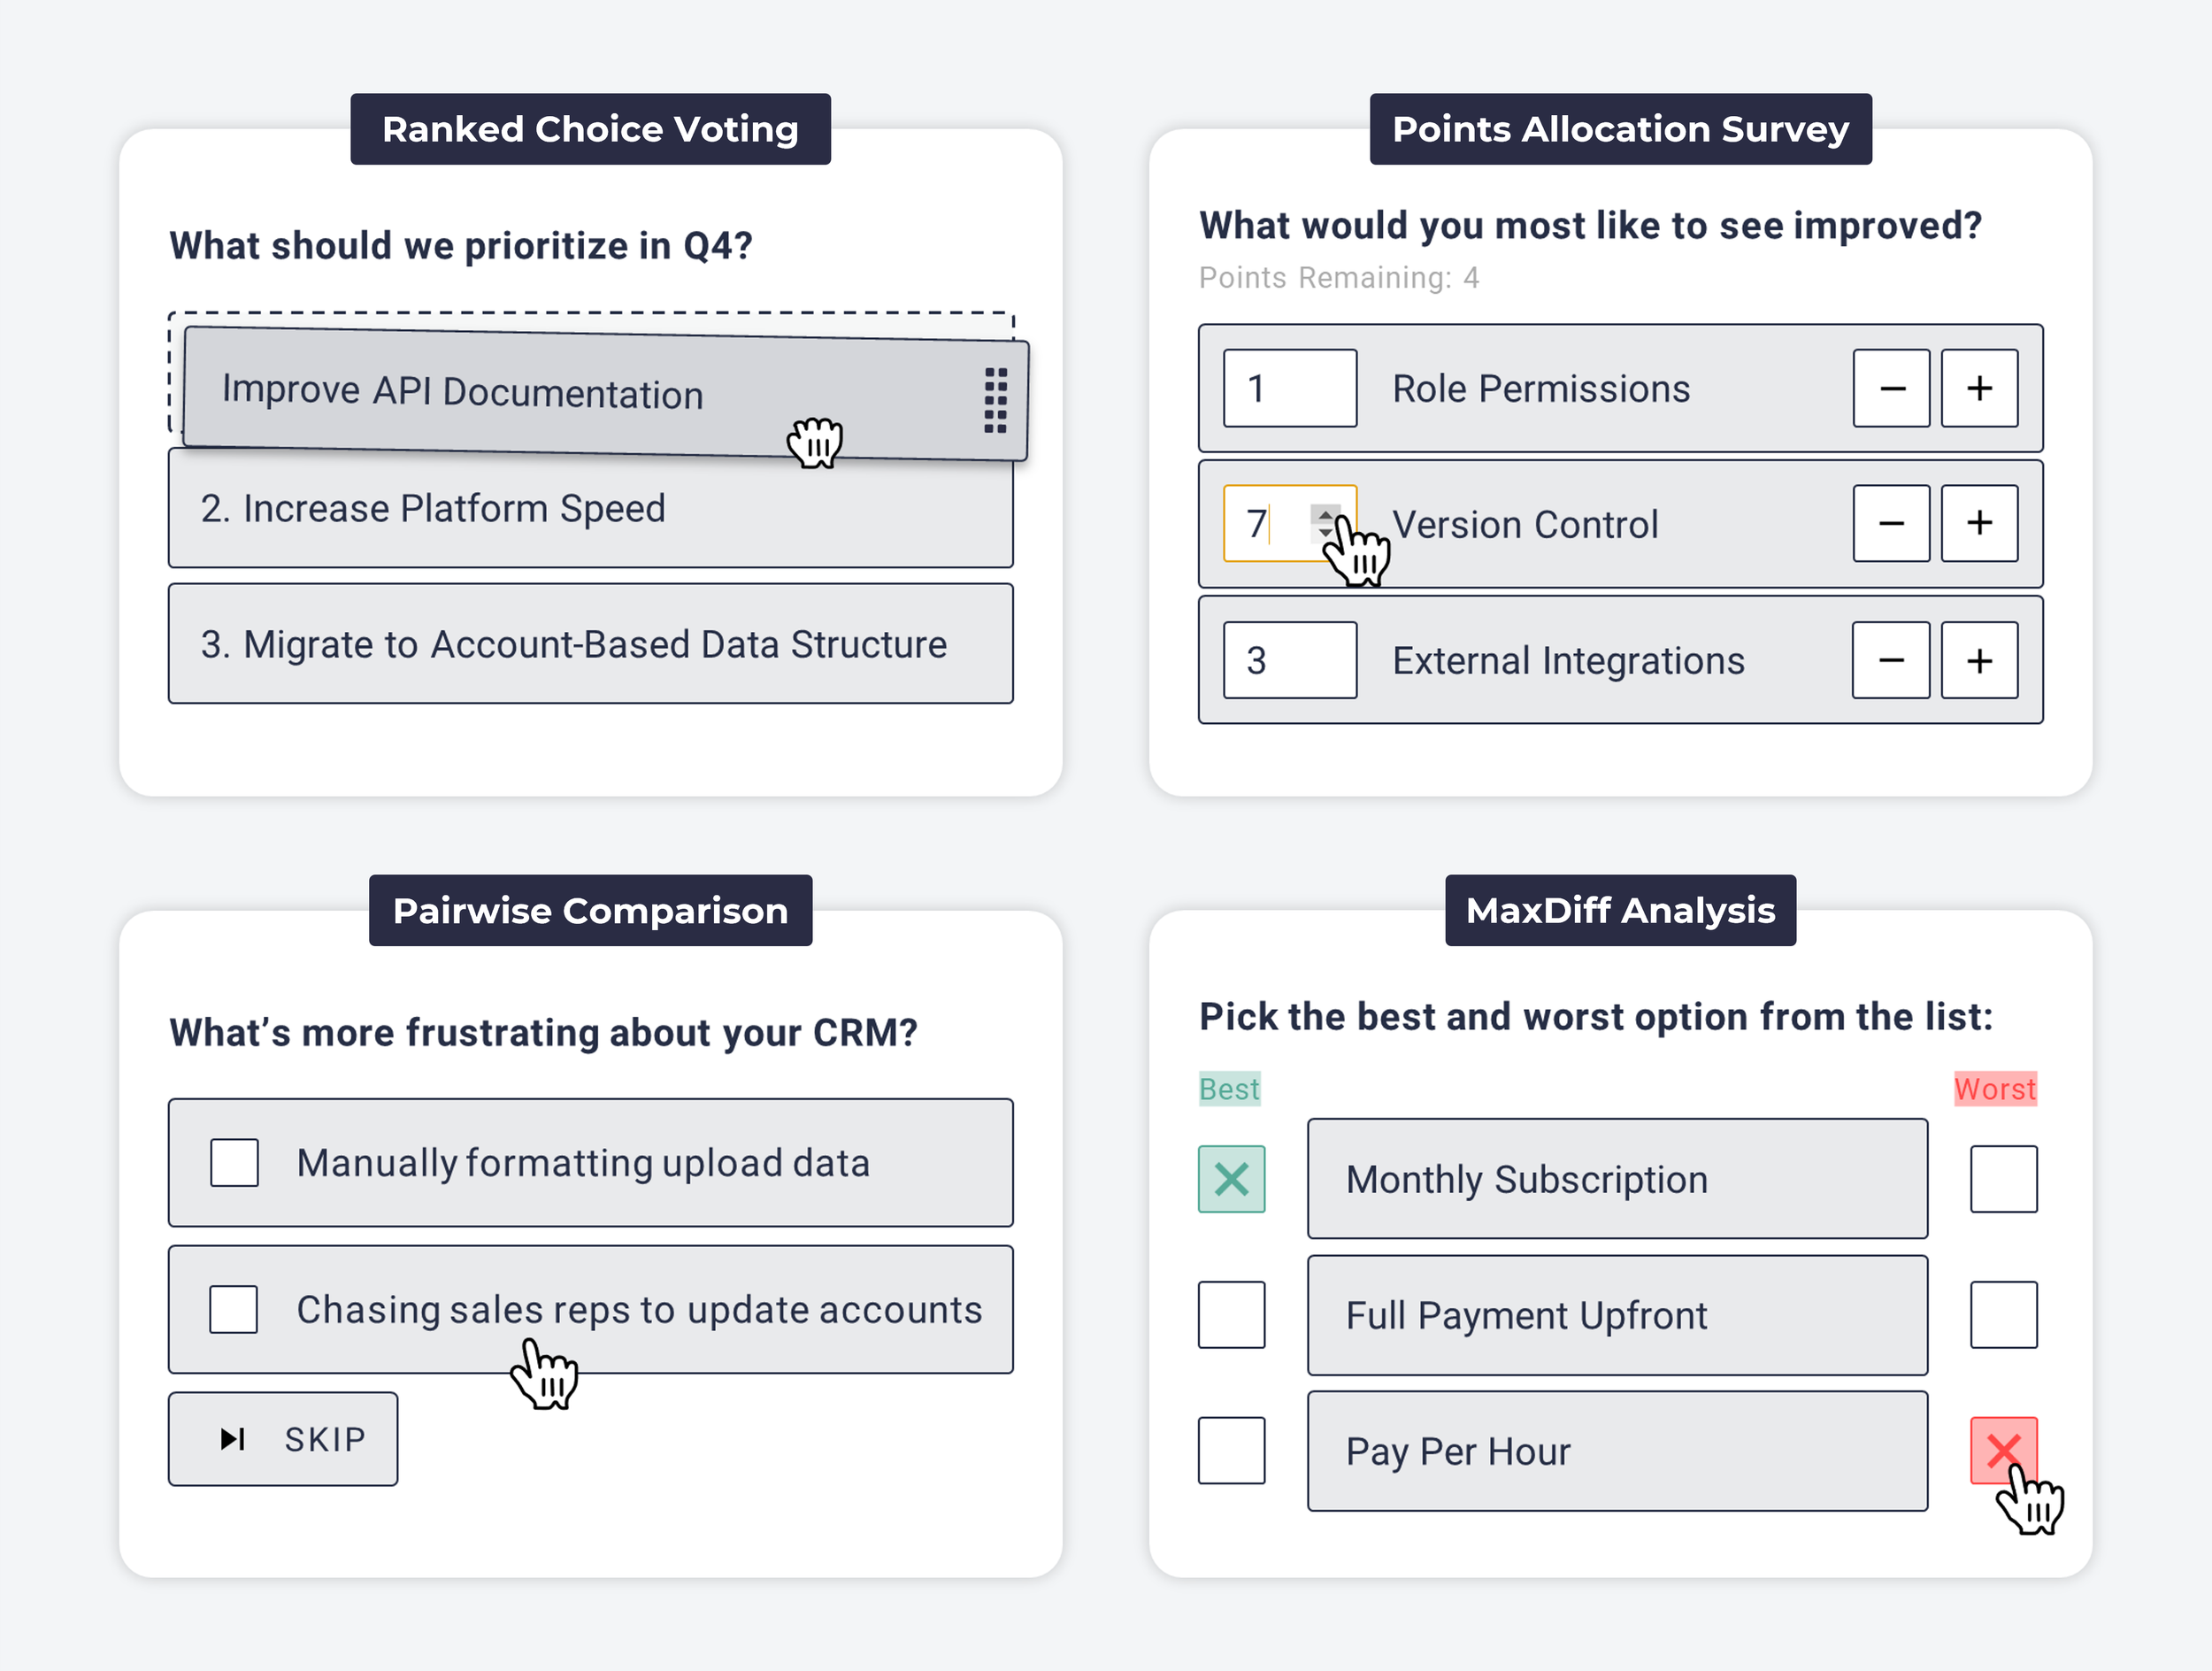
Conjoint analysis is a superb revealed-preference method for understanding how people act in purchase scenarios. But for plenty of other decisions, other discrete-choice methods bring advantages conjoint can't: context flexibility, lower cost, and less complexity. You've probably heard of several of them, like ranked choice voting, points allocation / constant sum surveys, pairwise comparison, and maxdiff analysis.
So when should I use conjoint analysis?
Conjoint is most useful for research involving purchase decisions: calculating customers' willingness to pay for existing features, modelling market share scenarios against competitor products, and informing optimal product bundling strategies (more on these examples here).
There's one detail that rules conjoint out even for projects that look suitable at first, and it comes down to attributes. If you want to use a conjoint survey to understand the relative importance of a list of options, you have to split those options into different "attribute" categories, because each attribute can hold a maximum of ~7 options. Your results will tell you which attributes were most important and the relative importance of the options inside each attribute, but people often don't realise you can't compare the importance of options across different attributes.

For many user research scenarios that focus on customer preferences, like product discovery, roadmap prioritisation, and assumption testing, you don't necessarily have distinct attribute categories (or if you do, you're often not sure what they are yet). But because you committed to conjoint, you're forced to fit its format, and that's how you end up with data that doesn't answer the primary research question you set out to address. That's the biggest risk in assuming conjoint is the right method for your research.
I wrote a longer post that goes into much deeper detail and includes 10 examples of user research projects that aren't suited to conjoint analysis, so continue there if the topic interests you.
Where can I learn more about conjoint analysis?
I spent the past fortnight writing 10,000+ words about conjoint analysis, split into a handful of separate articles.
To start, here's a breakdown of 8 research alternatives to conjoint analysis that explains the discrete-choice methods you can use to measure relative importance via revealed preferences.
If you're considering conjoint for your research, check whether your project meets these 5 criteria for assessing whether conjoint suits your scenario. If it does, here's a breakdown of the 10 most popular conjoint analysis tools, including whether they have a free plan and what the paid plan costs (spoiler: $3,000 to $30,000 per year, excluding support services).
To go deeper on the technical side, see my explanation of the 13 different types of conjoint analysis (with picture examples), or this advanced breakdown of how to calculate conjoint results in 8 steps.
Frequently asked questions
What is conjoint analysis used for? Measuring which product attributes matter most to customers when they compare products in a purchase decision. It's strong for willingness to pay, market-share modelling, and product bundling, and weak for most other research.
Why is conjoint analysis so often misunderstood? Because people assume it means "measuring what's most important to people" in general. It only measures that within a purchase comparison, and it needs strict conditions: one decision-maker, comparable products, a customer who knows what they need, and known attributes.
When should I NOT use conjoint analysis? When there's more than one decision-maker, when customers don't yet know what they need, when the options don't split cleanly into attribute categories, or in discovery and prioritisation research where you're still working out what the categories are. In those cases conjoint forces your data into a shape that doesn't answer your question.
What should I use instead of conjoint analysis? Another discrete-choice method suited to your decision: ranked choice voting, pairwise comparison, MaxDiff, or constant sum. These give you relative importance with more context flexibility, lower cost, and less complexity.
Is conjoint analysis expensive? Yes, relative to other methods. Dedicated conjoint tools run from roughly $3,000 to over $30,000 per year, and projects often need a conjoint specialist on top of that.
Conjoint analysis isn't bad, it's specialised. Nearly every misfire I see comes from reaching for it as a general "what matters most" tool when the real question was never a purchase decision. Work out which job you actually have first, and the method picks itself.
Want more like this? Over 42,000 researchers and product people get The Full-Stack Researcher in their inbox. Subscribe for the next one.
About The Author:
Daniel Kyne is the Co-Founder of OpinionX, a free research tool for stack ranking people’s priorities — used by thousands of product teams to better understand what matters most to their customers. OpinionX has a bunch of free research methods for ranking people’s preferences — including Conjoint-style ranking methods like Pairwise Comparison and Constant Sum. Try it now!