
Gabor Granger sample size calculator (how many people you need, and why)
Before a pricing study launches, someone always asks whether the sample is big enough. This page answers that with a free calculator, then shows you the reasoning behind those sizes so you can explain them.
Gabor Granger is a pricing survey that shows each person one price and asks if they'd buy at it. The results show which price earns the most, called the optimal price. The right Gabor Granger sample size depends on what you want to claim about that price, and on whether you'll split the results into groups.
 Research Toolkit
Gabor Granger sample size calculator
Answer three questions to see how many people to recruit.
Recruit 100 people
That gives you at least 100 people answering the price questions.
With 100 people, a result near 50% could be off by about 9.8 percentage points either way.
Enough for a direction: the optimal price will usually be right, or one price away.
Show the working
100 people per group ÷ 1.00 (no segments) ÷ 1.00 (people who'd buy at all) = 100.0, rounded up to 100.
OpinionX's guidelines: 100 people for a direction, 300 for a confident optimal price, and at least 100 in your smallest segment.
Create a free Gabor Granger survey ➡️What Gabor Granger sample size do you need?
There are three sizes to aim for, and each one lets you claim something different:
100 or more people: a direction. You'll know roughly where the best price sits. The optimal price will usually be right, or one price away from right.
300 or more people: a confident optimal price. You can name one price and stand behind it.
500 or more people: enough to split into groups. You can compare segments, like small and large companies, and still have at least 100 people in each.
These are OpinionX's guidelines for Gabor Granger. The rest of this page shows where they come from, so you have an answer when someone asks.
Why those sizes?
Every survey result has a margin of error, which is how far the result could be from the true answer, most of the time. Pew Research Center explains it with an example: say a survey has a margin of 3 points. If you ran it 100 times, about 95 results would land within 3 points of the truth (Mercer, Pew Research Center, 2016).
The margin shrinks as your sample grows. Here's the margin on a result near 50%, like "half of people would buy at $200":
100 people: about ±10 points
300 people: about ±6 points
500 people: about ±4 points
The same sum gives ±3 points for 1,067 people, which matches Pew's own figure.
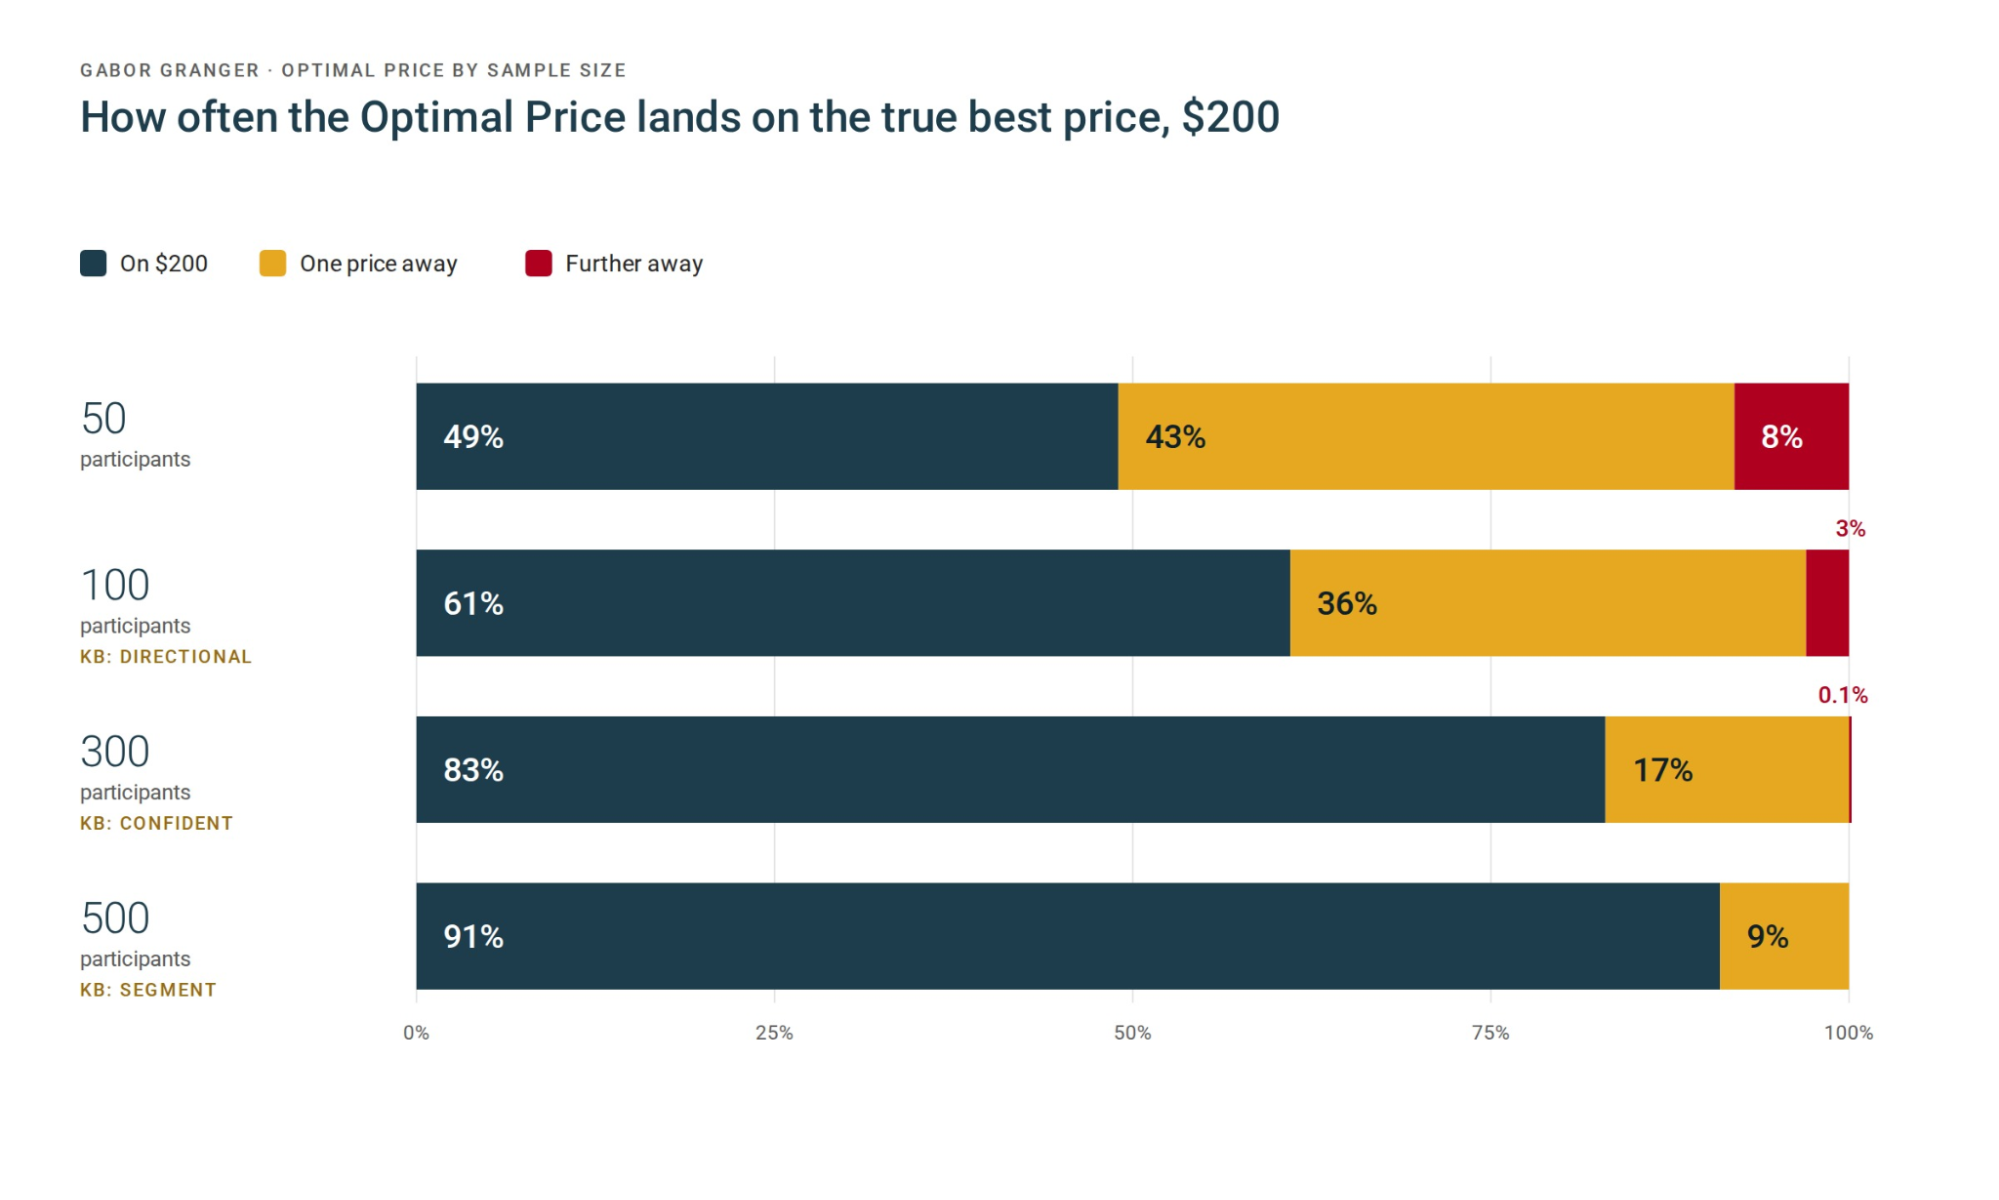
But a Gabor Granger study cares about one question above all: whether the optimal price is right, so we tested that directly with a simulation. The test used a robot vacuum priced from $120 to $400 in $40 steps, where the true optimal price is $200. It drew 20,000 random samples at each size and checked where the optimal price landed each time.
| People | Exactly right ($200) | One price away | Further away |
|---|---|---|---|
| 50 | 49% | 43% | 🔴 8% |
| 100 | 61% | 36% | 🟡 3% |
| 300 | 83% | 17% | 🟢 0.1% |
| 500 | 91% | 9% | 🟢 0% |
With 100 people, the optimal price was right or one price away 97% of the time. That's what "a direction" means. With 300 people, it was exactly right 83% of the time, and never more than one price away except in 1 run in 1,000. That's why 300 is the point where you can name a price.
What happens if your sample is small?
A small sample doesn't ruin a Gabor Granger study, it just makes the optimal price less exact. In the table above, even 50 people put the optimal price on $200 or a neighbouring price 92% of the time. The study still points at the right area, but it can't tell $160, $200 and $240 apart as well.
Report a small study with its uncertainty stated clearly. For example: "The optimal price is $200. With 100 people, it could also be $160 or $240, the prices on either side." That's more useful to a stakeholder than a single price they'll trust too much.
How to read a Gabor Granger chart explains how to see whether the top of your revenue line is flat or sharp. A flat top means the neighbouring prices earn about the same anyway.
How do segments change the sample size?
A segment is a group of people you want to compare, like students and professionals. Each segment is its own small sample, so the rule is simple: set your Gabor Granger sample size by your smallest segment.
Pew Research Center won't publish a result for any group with fewer than 100 interviews (Pew Research Center, 2021). The same 100 works as a minimum for each segment in a Gabor Granger study.
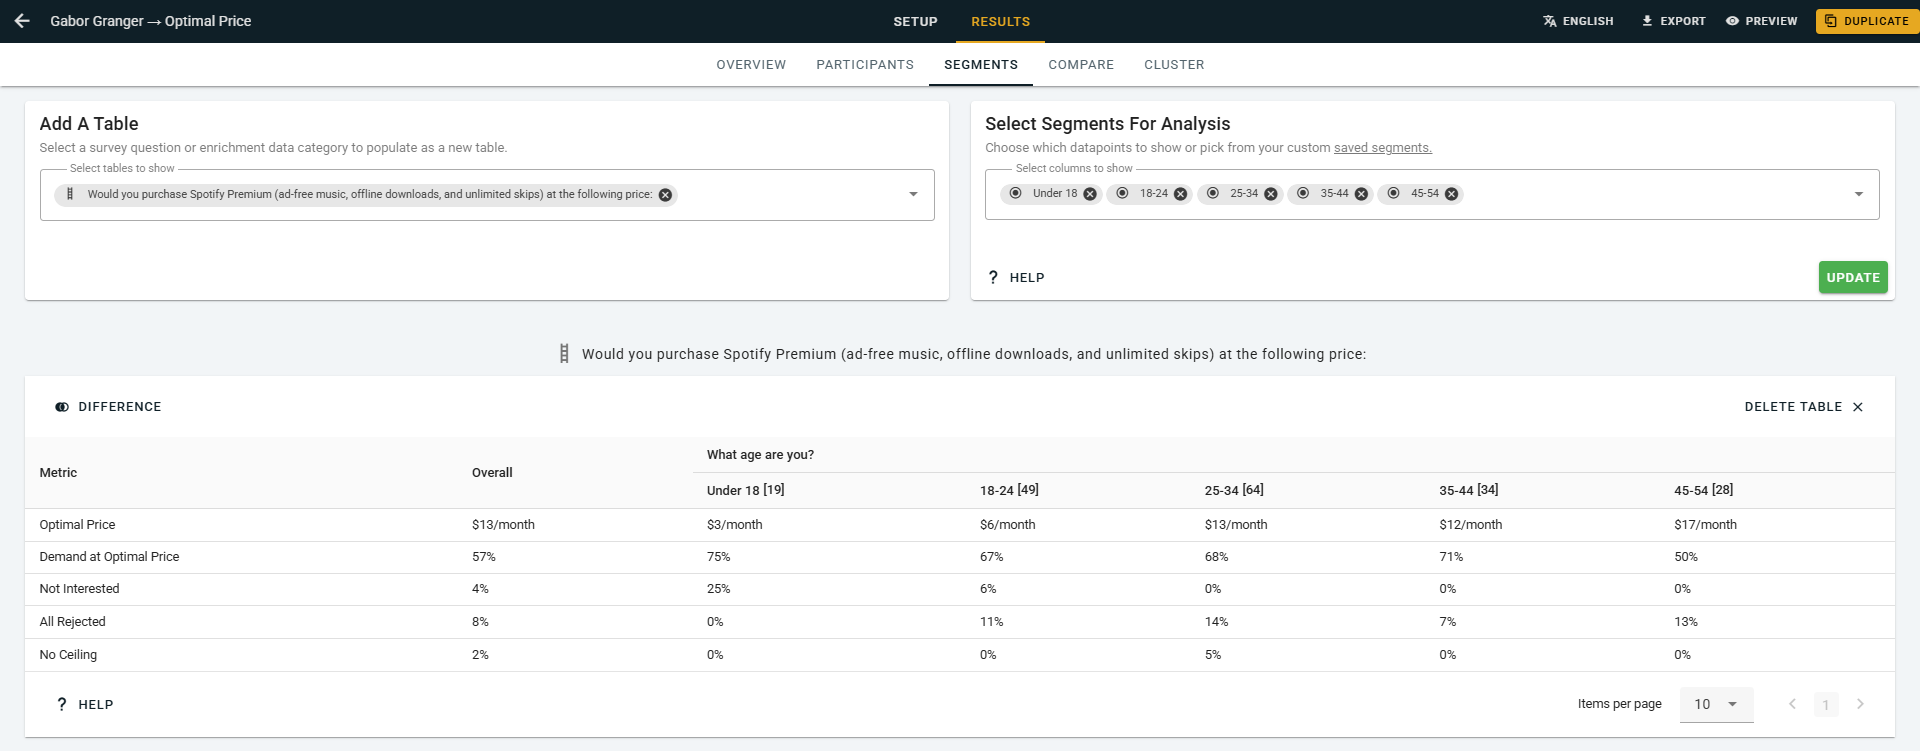
Here's the sum the calculator uses:
People to recruit = people per group ÷ smallest segment's share ÷ share who'd buy at all
For example, say your smallest segment is 20% of your sample, and you want 100 people in it. That's 100 ÷ 0.20 = 500 people. This is where the "500 or more to segment" guideline comes from.
There's one more group to plan for. Some people wouldn't buy your product at all. The interest prescreener, a first question that asks whether someone would buy at all, sends them past the price questions. That keeps your results clean, but it means they don't count towards your sample. If 20% of people fail the prescreener, you need 100 ÷ 0.80 = 125 people to get 100 answers on price.
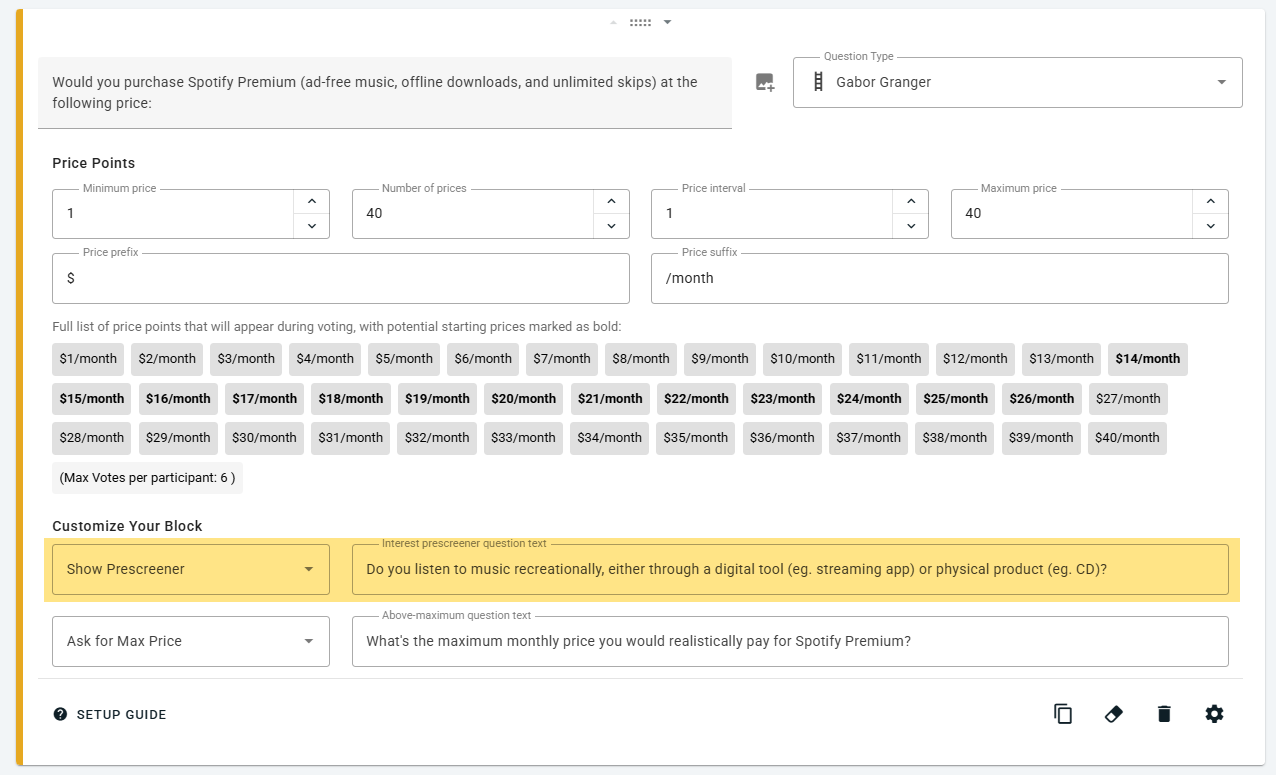
How to segment Gabor Granger results shows a full example. If you need to find more people, how to find free participants covers where to look.
What are the limitations of this calculator?
OpinionX has no significance testing, which checks whether a difference between two results could be down to chance. These sizes tell you how steady your Gabor Granger results are; they don't come from a significance test or its p-value, the figure that test produces.
The simulation also used one product with one revenue line. A flatter top makes the optimal price move around more, and a sharper top makes it move less. Treat the table as a guide to the pattern, since your product's curve will differ.
And a bigger sample can't fix a badly set-up study. If your price range misses the right price, more people won't help. Common mistakes in Gabor Granger studies and how to choose your Gabor Granger price points cover the problems no sample size can fix.
The Gabor Granger guide covers the rest of the method. If you'd like to test your survey before you recruit, every method is on OpinionX's free tier.
