
How to choose your Gabor Granger price points (range, interval and the 10% check)
Gabor Granger surveys help you find the revenue-maximising price for your product by showing target customers a series of prices with yes/no voting for whether they’d buy at each price.
But before anybody votes on your Gabor Granger survey, you need to choose which prices will be shown. If the optimal price for your product isn't included in the range of prices you test, the survey can't find it. And it won't show an error, it'll still draw a neat chart and name an optimal price, but that price will be wrong.
This guide shows which price fields to fill in and where your Gabor Granger price points should come from. It explains why including a lot more prices costs you less than you'd think, and how to tell if the price range you chose was wrong.
Which price fields do you fill in?
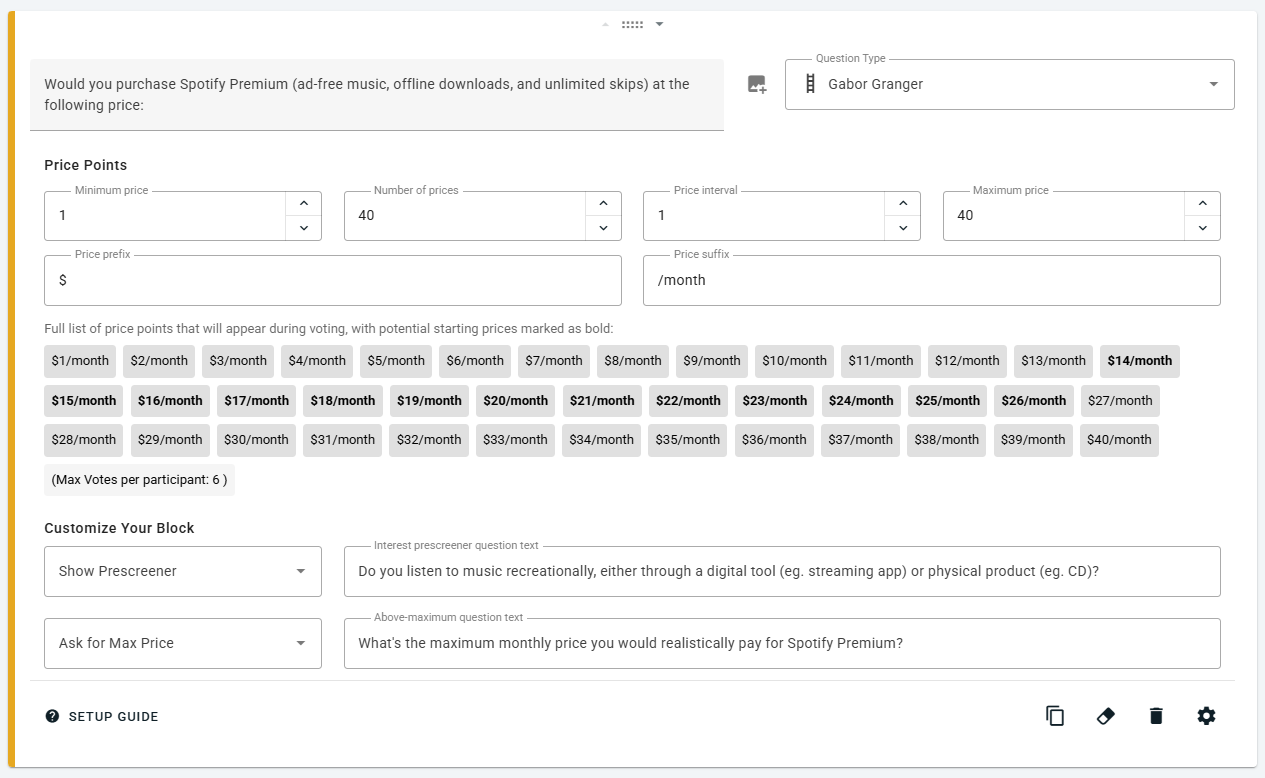
A Gabor Granger question on a survey platform like OpinionX has four price fields:
Minimum price: the lowest price a survey respondent could vote on.
Number of prices: how many prices you’re testing.
Price interval: the gap between each price point.
Maximum price: the highest price you want included in the test.
You always choose the minimum price and the number of prices. Then choose either the price interval or the maximum price, and the survey builder will automatically fill in the fourth field for you.
Here’s an example of Gabor Granger price setup in action:
With a $10 minimum price, 5 prices, and a $2.50 price interval, you get a maximum price of $20.
If you change the maximum price from $20 to $30, the survey platform will automatically increase the price interval to $5.
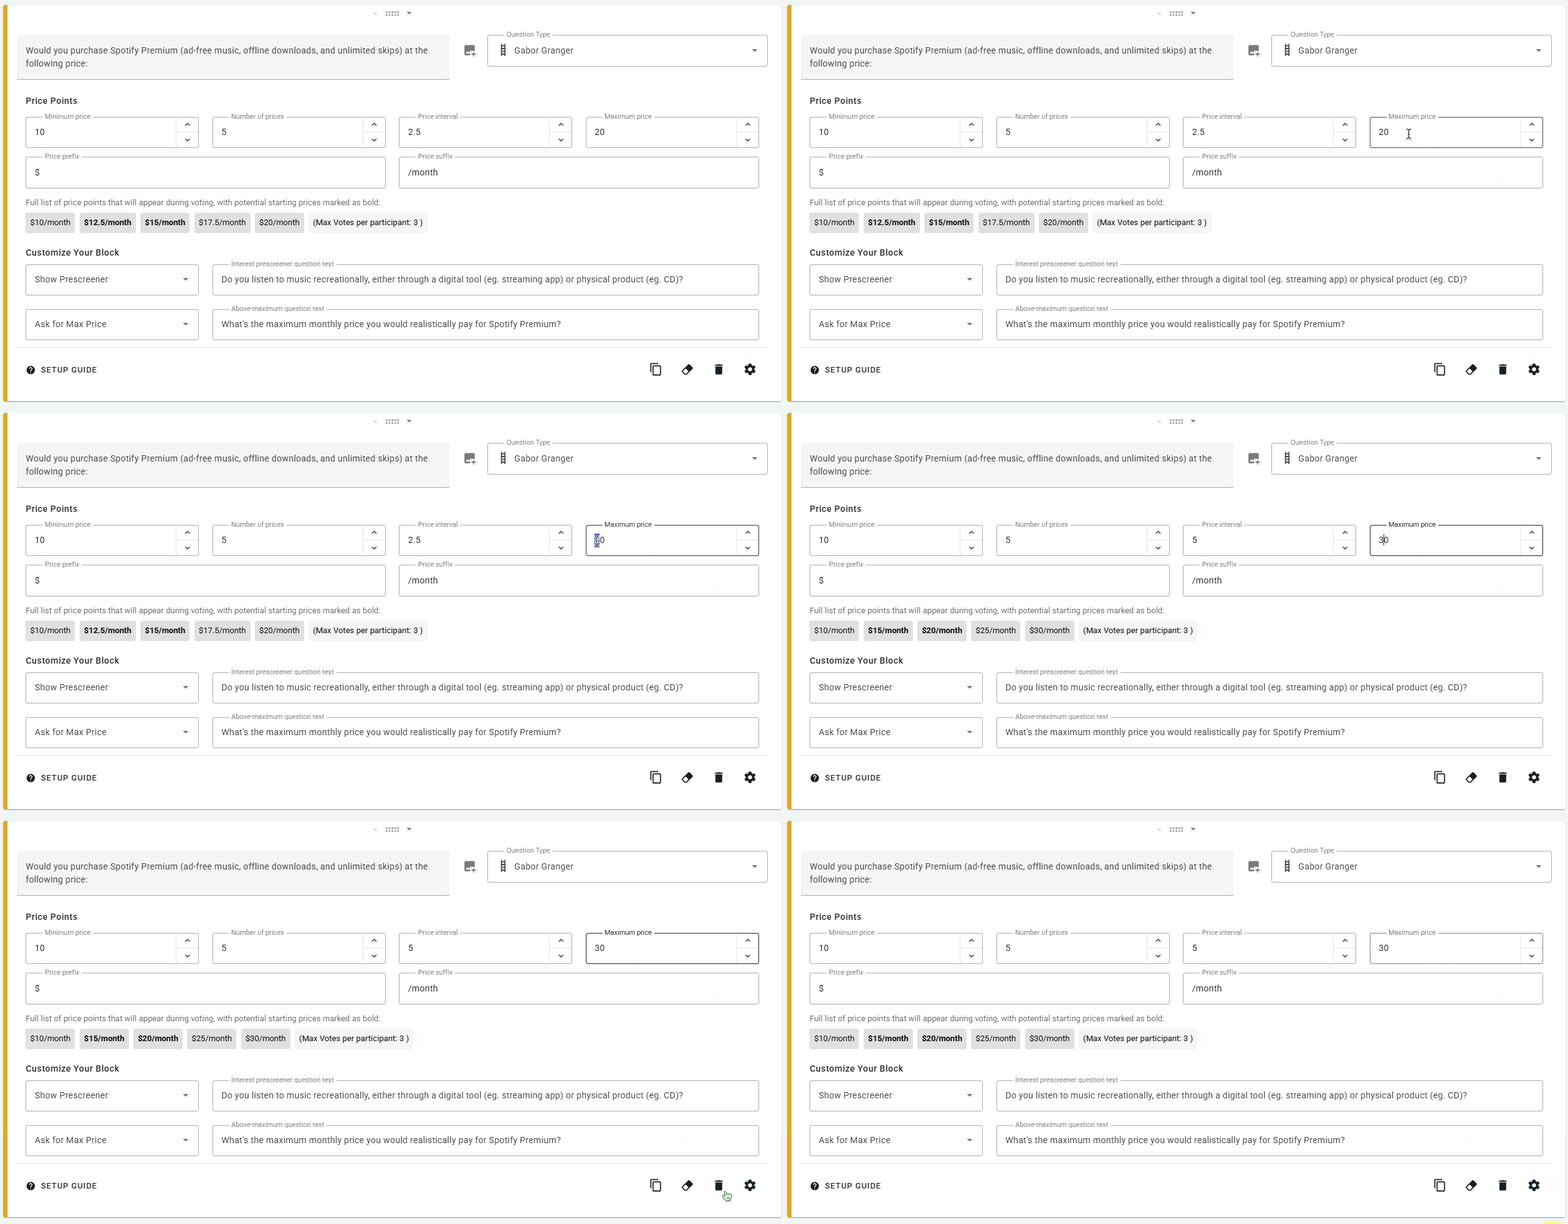
Type the maximum price yourself, because it's the field most likely to ruin a study if it's wrong, as the example at the end shows. Ideally, the price interval should be a logical number, like $2.50 or $5 increase per product, not a random interval like $2.73 which will result in quite odd prices being shown to survey respondents.
Below the fields, the builder lists every price a participant could see. The prices shown in bold in the example above are the prices that can be chosen by the survey tool as the first vote for a new participant. Those starting prices are chosen at random from the middle third of your price range. This avoids two common pitfalls with Gabor Granger: showing every respondent the same starting point will bias your results, and showing participants a starting price from the high or low extremes in your price range may impact how reasonable they think your product is.
Where should your Gabor Granger price points come from?
If you're staring at an empty minimum price field, use one of these three sources to overcome your writers’ block.
1. A Van Westendorp study. This is a different pricing survey method. It asks people four questions about the prices where your product would seem too cheap and too expensive. Its results mark the two edges of the price range your market accepts. Set your minimum price at or just below the lower edge, and your maximum price well above the upper edge (because some buyers will pay more than most). Our Van Westendorp guide explains the method step by step, and Van Westendorp vs Gabor Granger helps you understand their differences.
2. Your competitors' prices. Buyers will compare you against available alternatives anyway, so set your minimum price below the cheapest credible one in your market, and your maximum price above the most expensive.
3. Your current price. If you already sell the product, test around today's price while allowing a much wider range for minimum and maximum price than you would currently consider. People judge a new price against the one they already pay, and they react more strongly to a rise than to a cut (Kalyanaram and Winer, Marketing Science, 1995).
How many prices should you test?
It's tempting to test only a few prices, like 5. But 5 prices give you a chart with just 5 bumpy points. The optimal price can then only be one of those 5, so it could be off by a whole price interval.
People used to assume testing more prices in a Gabor Granger survey meant asking respondents to answer a lot more questions. If a Gabor Granger survey moves up/down by just one price point at a time, 15 prices could take 15 questions to complete. OpinionX has a smart system for that shrinks the number of required votes dramatically. Known as binary search, after each answer it jumps to the middle of the remaining possible price range. That means that every yes/no vote eliminates half of all possible prices. With binary search on OpinionX, testing 15 prices in a Gabor Granger survey takes only 4 to 5 questions to complete. Testing 100 prices means voting just 8 times. Learn more about how binary search picks the next price for Gabor Granger if you want to dive deeper into this aspect of GG research.
The conclusion therefore is that you should test a wide price range with a small price interval between each. This lets you go wide enough to ensure the right price is almost certainly inside your testing range, with intervals small enough that the optimal price lands on an actual specific price.
How wide is too wide?
There's one limit, and it comes from those bold first prices. Each person's first price comes from the middle third of your price range. For example, with a $10 minimum price and a $50 maximum price, the first prices fall between about $23 and $37.
If you push the maximum price far above where you expect the answer, the middle third moves up with it and everyone starts on a high price. That's a problem, because the first price people see pulls their later answers towards it (Tversky and Kahneman, Science, 1974).
One study showed this with a question very like a Gabor Granger opener. People first said whether they'd buy an item at a price equal to the last two digits of their social security number, then named the most they'd pay, and people with higher digits named higher amounts (Ariely, Loewenstein and Prelec, Quarterly Journal of Economics, 2003). A later repeat of this kind of study found a much weaker effect (Maniadis, Tufano and List, American Economic Review, 2014). Either way, randomising the first voting price spreads the pull across everyone, and limiting it to the middle third minimises this biasing, helping ensure that more reliable Gabor Granger results for you.
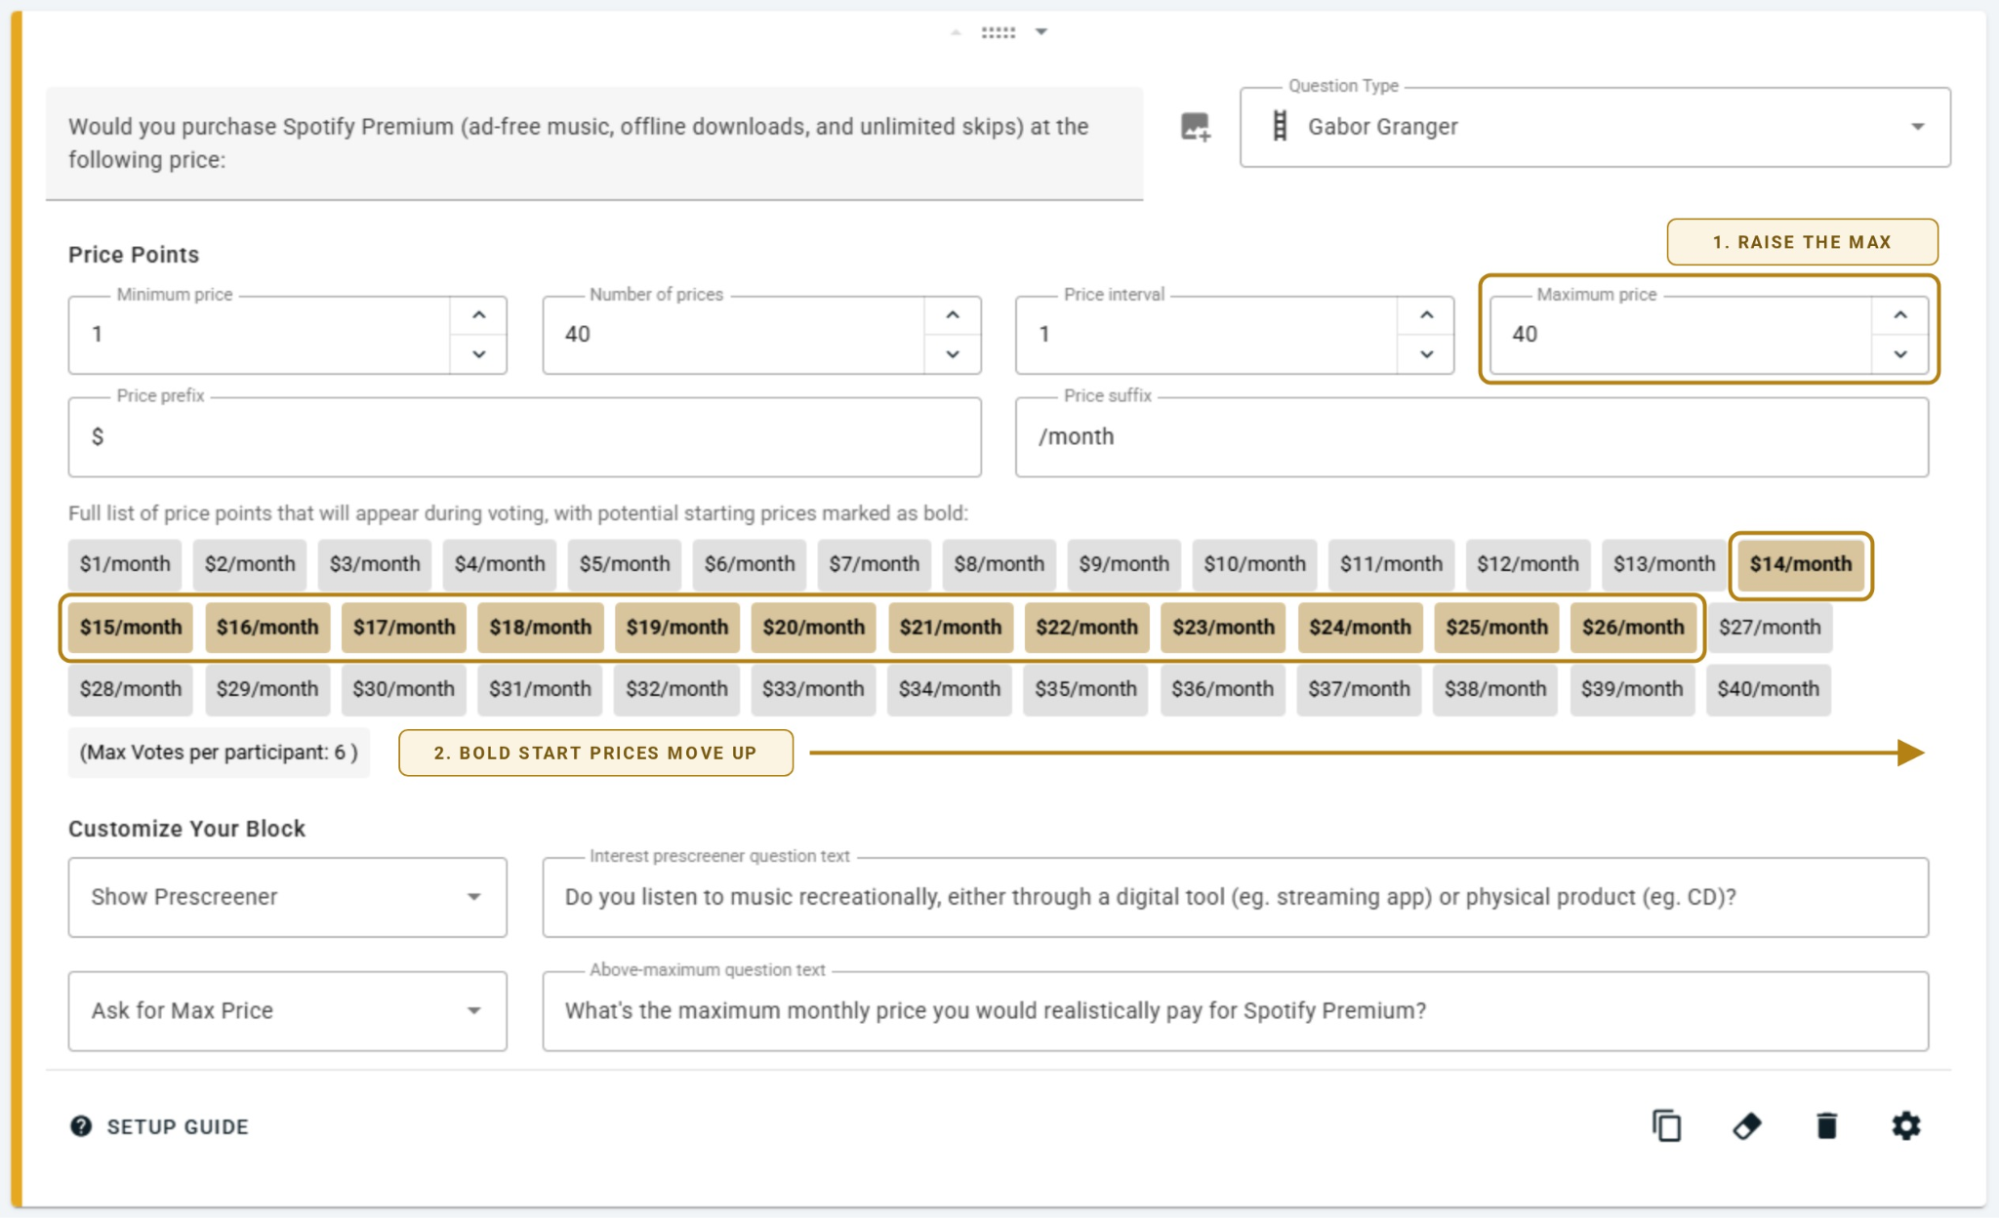
Centre your price range on the price you expect, then widen it evenly on both sides.
How do you know your range was wrong?
When your results come in, check two figures above the chart before anything else:
No Ceiling % = the share of people who said yes to every price, even your maximum price.
All Rejected % = the share of people who said no to every price, even your minimum price.
If either one of these stats goes above 10% of your survey participants, then the right price is probably outside the range you allowed for when setting up your Gabor Granger survey.
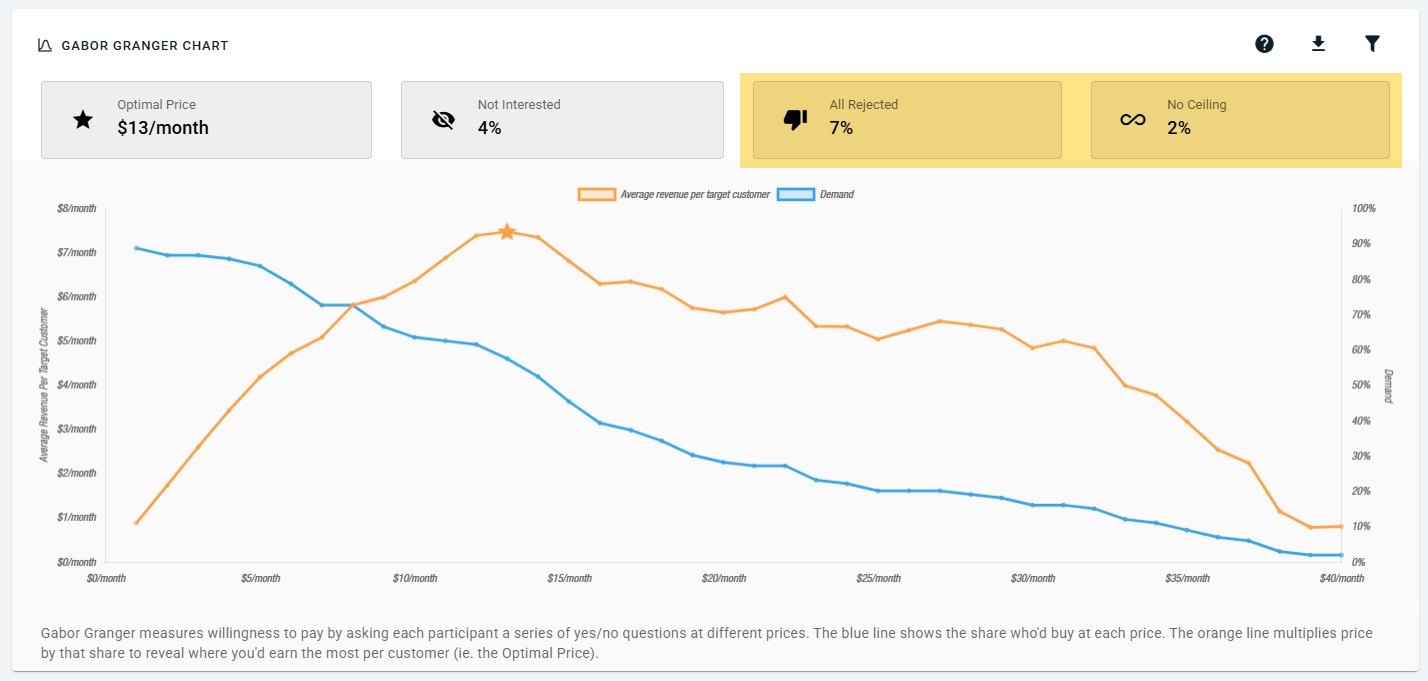
A high percentage of No Ceiling respondents means your maximum price is too low. Gabor Granger surveys run on OpinionX automatically ask these No Ceiling respondents to state the most they'd really pay. This is an optional feature you can disable, and their responses don’t feed into the chart. Instead, their answers appear in a table for you to use to assess whether you need to change your maximum price, and if so, by how much.
A high percentage of All Rejected means your minimum price is too high, or people don't want the product at all. To find out which, lower your minimum price and run the survey again. If the percentage for All Rejected drops, your narrow price range was the problem. On OpinionX, view your participant-level data to see how each person answered.
Check these two figures, No Ceiling and All Rejected, before you look at the optimal price. Your optimal price still looks exact even if it’s wrong, so it's easy to trust. Our guide ‘how to read a Gabor Granger chart’ covers the rest of the results process in detail.
What does a good price range change in Gabor Granger?
A shop sells a reusable water bottle for $20. It wants to know whether it can charge more.
Their first Gabor Granger study used a price range picked in an internal meeting. It had a $15 minimum price, 5 prices and a $2.50 price interval, so the maximum price was just $25.
The chart said the optimal price was $25. But No Ceiling was 24%, more than twice the 10% quality limit. Almost a quarter of people said yes to every single price, so the optimal price was $25 only because the survey had no higher price to show them.
If their Gabor Granger survey on OpinionX had the feature enabled for asking those No Ceiling people the most they'd really pay, they could see that many of them said between $30 and $35.
The second study centred its price range on those answers. It had a $10 minimum price, 81 prices and a $0.50 price interval, so the maximum price was $50. The first prices fell between about $23 and $37, around the $30 to $35 answers. With 81 prices, each person still answered 8 questions or fewer.
| First study: range from a meeting | Second study: range from evidence | |
|---|---|---|
| Minimum price | $15 | $10 |
| Number of prices | 5 | 81 |
| Price interval | $2.50 | $0.50 |
| Maximum price | $25 | $50 |
| No Ceiling | 🔴 24% | 🟢 4% |
| All Rejected | 🟢 3% | 🟢 6% |
| Optimal price | $25, the maximum price | $32.50 |
In the second study, No Ceiling and All Rejected are both under 10%. The first study said to raise the price from $20 to $25, a 25% increase. The second said to charge $32.50, a 62.5% increase, and all that changed was the price range used for the Gabor Granger voting.
Setting a range for a product nobody has priced before? Book a free call with one of our research experts who can check your Gabor Granger survey before you launch, including your price range configuration, product description and audience targeting.
What can't a good price range fix?
A good range can't fix an unclear product description. People can only price what they think they're buying, so if some think the price includes delivery and others don't, your results mix two different offers.
Write the description before you set any prices. Say what's included, what isn't, and anything a buyer would ask before paying. Then put the unit in the price suffix, so people see "$12 per month" and know exactly what they're paying for.
The Gabor Granger guide covers the full method.
The sample size calculator shows how many people you need, and common mistakes in Gabor Granger studies covers what else can go wrong.
