
Free Gabor Granger template: questions, price ladder and analysis (Google Sheets)
Gabor Granger is a pricing survey that shows each person one price and asks if they'd buy at that price. A yes brings a higher price, and a no brings a lower one. The result tells you which price earns the most, called the optimal price.
This free Google Sheets template lets you run a Gabor Granger study in any survey tool. It gives you the Gabor Granger questions to copy, builds your list of prices, and turns yes and no answers into demand and revenue at every price. There's no email form and no login. Click the button below to make a copy into your own drive.
What's in the template?
The template has five tabs:
Start here: Which cells to edit. You only ever type in the yellow cells.
1. Price ladder: type three values and get every price to test, plus a branch map for your survey tool.
2. Paste votes: paste one row of answers per participant.
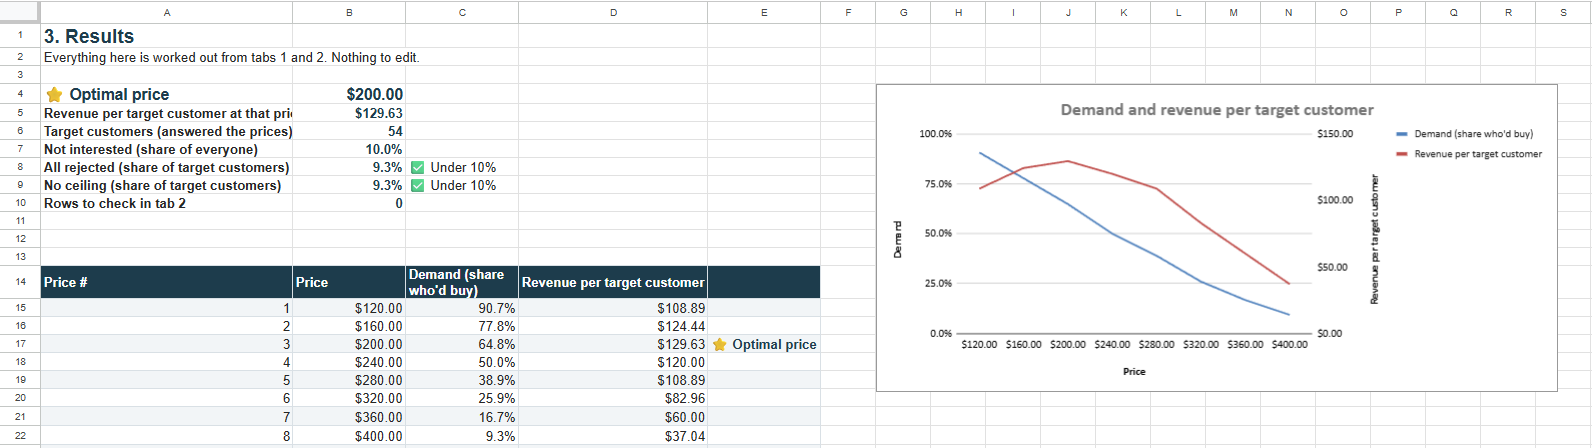
3. Results: demand and revenue at every price, the optimal price, two warning checks and a chart.
4. Questions: the three Gabor Granger questions to copy into your survey.
5. How it works: every formula explained.
It comes with a simulated example: a robot vacuum tested at 8 prices from $120 to $400, with 60 participants.
Which Gabor Granger questions should you ask?
There are three Gabor Granger questions in the template. Copy them word for word, and replace [product] with a clear description of what you're pricing.
1. The prescreener, asked first, before any price:
Would you purchase our product if it were available at a reasonable price? (Yes / No)
Anyone who says no skips the price questions. Without it, people who'd never buy say no to every price, and your results look worse than they really are.
2. The price question, asked once per price:
Would you purchase [product] at the following price: [price] (Yes / No)
3. The above-max question, only for people who said yes to your highest price:
What's the maximum price you would realistically pay for this product?
Their answers show how far above your range the right price might be.
Two tips: say what's included in the price and what isn't, so everyone prices the same offer, and put the unit next to the price, like "$12 per month". Common mistakes in Gabor Granger studies explains why an unclear offer ruins the results.
How do you build the price ladder and branch map?
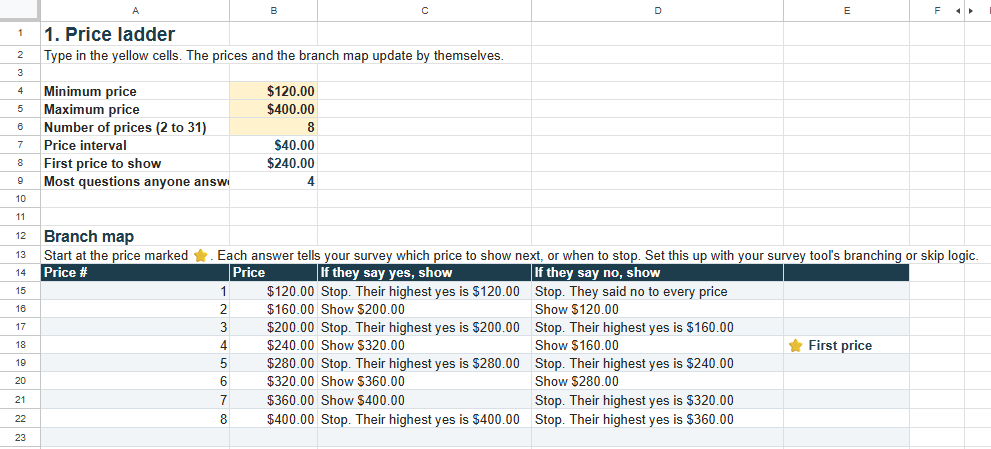
The price ladder is the list of prices you'll test. In tab 1, you type three values in the yellow cells: the minimum price, the maximum price and the number of prices. The sheet works out the gap between prices and lists them all.
For example, a $120 minimum, a $400 maximum and 8 prices give you a gap of $40. So the prices are $120, $160, $200, and so on up to $400.
Below the prices, the branch map tells your survey which price to show next. Every row has one price, what to show after a yes, and what to show after a no. In the example:
Start at $240, marked ⭐.
After a yes at $240, show $320. After a no, show $160.
When there's no price left to show, the survey stops. The map tells you the person's highest yes at that point.
The map uses binary search: each answer rules out half the prices still possible. With 8 prices, nobody answers more than 4 questions. How a Gabor Granger survey picks the next price explains the question counts.
To set it up, make one yes-or-no question per price, then use your tool's branching or skip logic to follow the map. How to choose your Gabor Granger price points covers picking the minimum and maximum.
How do you turn yes and no votes into a demand curve?
In tab 2, paste one row per participant. Put a name or ID in column A, their prescreener answer in column B, and Yes, No or a blank under each price. A blank means they never saw that price.
The sheet works out each person's highest yes. It also labels three groups:
Not interested: said no to the prescreener.
All rejected: said no to every price.
No ceiling: said yes to the maximum price.
Everyone who answered the price questions counts as a target customer.
Tab 3 does the rest:
Demand at a price is the share of target customers whose highest yes is at or above that price. In the example, 35 of the 54 target customers had a highest yes of $200 or more. So demand at $200 is 35 ÷ 54 = 64.8%.
Revenue per target customer is the price times demand. At $200, that's $200 × 64.8% = $129.63.
The optimal price is the price with the highest revenue per target customer. In the example it's $200, marked ⭐.
Tab 3 also runs two checks. If more than 10% of target customers said no to every price, or yes to every price, the right price is probably outside your range. In the example, both are 9.3%, so the range is fine. How to read a Gabor Granger chart explains what to do when they aren't.
Tab 2 also flags any row where someone said no below their highest yes. The branch map makes that impossible, so a flag usually means a pasting mistake.
What are the limitations of a spreadsheet version?
A spreadsheet can do the maths, but a tool built for Gabor Granger does a few jobs better.
Everyone starts on the same price. Branching logic can't pick a random first price, so the template always starts in the middle. The first price people see pulls their later answers towards it (Tversky and Kahneman, Science, 1974), and when everyone starts on the same price, that pull pushes every answer the same way.
The prescreener only works if your tool skips people. You need branching logic that sends a "no" past the price questions.
You paste the answers yourself. Nothing updates on its own until you paste in new data.
Segments take extra work. To compare groups, like students and professionals, you paste each group into its own copy of the template. How to segment Gabor Granger results explains why it's worth doing, and the sample size calculator shows how many people each group needs.
OpinionX runs Gabor Granger with a random first price, a built-in prescreener and segments, on a free tier that allows 25 participants per survey.
The Gabor Granger guide covers the method in full, and there's a Van Westendorp guide if you haven't picked a price range yet.
