
How to segment Gabor Granger results (and when to build two plans)
A Gabor Granger survey gives you one optimal price, the one that earns the most money from everyone you surveyed. But "everyone" is often two or more groups who would pay very different amounts. When this happens, the optimal price is an average, and it might suit none of your customers optimally.
This guide shows how to segment Gabor Granger results and how to read the segmented data. It also shows when a gap between groups means you need two plans instead of one single price.
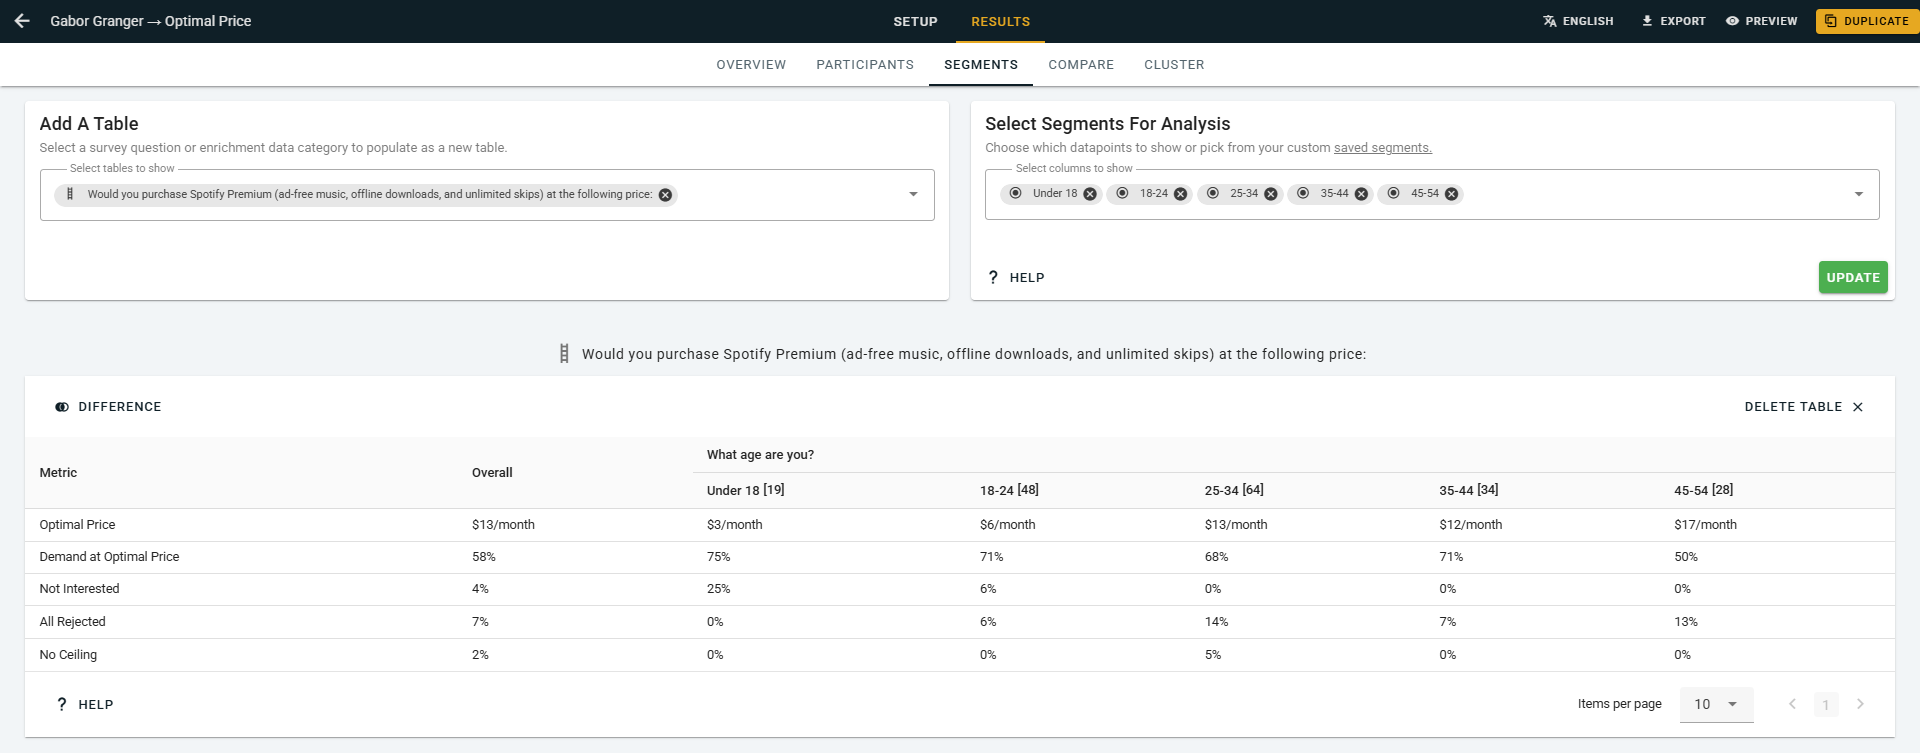
Why might one optimal price be wrong for everyone?
A segment is a group of people you want to compare. Within the context of surveys, segmentation means isolating one group of people from the overall population of respondents. For example, a survey that engages a random sample of people at a university campus may want to filter the results to focus on just PhD researchers or to compare PhD and Masters researchers.
The idea goes back to 1956, when Wendell Smith described treating one mixed market as several smaller markets that want different things (Smith, Journal of Marketing, 1956).
Here's an example of what that means for price. A language-learning app surveyed 300 people: 150 students and 150 professionals. Across all 300, the optimal price was $25 a month.
The answer changes when you split by segment:
Students: optimal price $15 a month.
Professionals: optimal price $40 a month.
So the $25 price is too high for students; only 30% of them would buy at $25, compared with 80% at $15. And it's also too low for professionals; at $25, 88% of them would buy, and 65% would still buy at $40. The $25 price came from mixing the two groups together, even though neither group, on its own, would have picked it.
How do you split Gabor Granger results by segment?
To segment Gabor Granger results on a survey platform like OpinionX, you need a question that sorts people into groups, and then you filter or compare the results by that question.
1. Add a multiple-choice question to your survey. For example: "Which best describes you?" with the options “Student” and “Working professional”. Each answer becomes a tag that puts respondents into separate segments.
2. Filter your results. Filtering shows the results for one segment at a time. The demand line, the revenue line and the optimal price all recalculate for that group. You can activate a filter by clicking any bar chart from a previous multiple-choice survey, for example.
3. Compare many segments at once with crosstab analysis. The Segments Tab on OpinionX puts up to 30 segments side by side as columns in a table. It's called a crosstab, which means a table that shows the same results once for each group. The table shades higher values darker, so the groups that would pay more stand out. To choose which question to split by, click "Select Segments" in the top right of the table.
The Segments Tab is on OpinionX's free tier. Our guide to crosstab analysis explains how to read this kind of table in more detail.
What does the segmented example show?
The table below shows the revenue line for each segment. The chart calls it "Average revenue per target customer". It's the price times the share of people who'd buy at that price, so it's the money you'd make from each person surveyed.
For example, at $15, 80% of students would buy. $15 × 80% = $12.00 for each student surveyed.
| Price per month | Students | Professionals | Everyone |
|---|---|---|---|
| $10 | $9.00 | $9.80 | $9.40 |
| $15 | $12.00 ⭐ | $14.40 | $13.20 |
| $20 | $10.00 | $18.40 | $14.20 |
| $25 | $7.50 | $22.00 | $14.75 ⭐ |
| $30 | $4.50 | $24.00 | $14.25 |
| $35 | $2.80 | $25.20 | $14.00 |
| $40 | $2.00 | $26.00 ⭐ | $14.00 |
| $45 | $0.90 | $20.25 | $10.58 |
| $50 | $0.50 | $15.00 | $7.75 |
The star marks the optimal price in each column. Three points stand out:
The students' revenue peaks early and drops fast. Above $20, most students stop buying.
The professionals' revenue keeps climbing until $40. They're far less put off by a higher price.
The "Everyone" column is almost flat from $20 to $40. Revenue stays between $14.00 and $14.75. That flat top is a warning sign, because it often means two groups are pulling the peak in opposite directions.
How to read a Gabor Granger chart explains the demand and revenue lines in more detail.
When is a gap a packaging answer, not a pricing one?
One $25 plan for everyone earns you $14.75 per person surveyed. Now try two plans: a student plan at $15 and a professional plan at $40. Students bring in $12.00 each on average when you account for customer rejection, and professionals bring in $26.00 each. With equal numbers of each customer segment, that's ($12.00 + $26.00) ÷ 2 = $19.00 per person, about 29% more than the single price would have delivered.
There's a catch, though: the two plans only work if professionals don't just buy the student plan, so the professional plan needs something professionals want and students don't. For the language app, that might be business vocabulary courses and a certificate employers recognise. Shapiro and Varian call this versioning, selling different versions so each group picks its own (Shapiro and Varian, Harvard Business Review, 1998).
This is why a big gap between segments is a packaging question. You're deciding what goes in each plan as well as what to charge.
Use this as a rule of thumb: if one segment's optimal price is at least double another's, one price will lose one of those segments, so look at two plans. Here, $40 is 2.7 times $15, so two plans are worth designing; if the gap is smaller, say $20 and $25, keep just one price.
MaxDiff can then show you which features to put in the higher plan. MaxDiff and Gabor Granger in one survey covers running both at once.
But beware these are survey figures. People usually say they'd pay more than they really do, by about 21% on average (Schmidt and Bijmolt, Journal of the Academy of Marketing Science, 2020).
Designing plans around a segment split is easier with help. A research expert will check your segments, prices and audience with you before you launch, for free.
How many people does each segment need?
Every segment you add splits your sample into smaller groups, and smaller groups give less reliable results. For example, 300 people split into 2 segments gives you 150 per segment, while the same 300 people split into 6 segments gives you only 50 per segment.
OpinionX's guidance is 100 or more people for a directional result, and 500 or more if you plan to segment. Treat each segment as its own small study, with at least 100 people in it. In the language app example, that's why each group had 150.
If you still need help, our sample size calculator works out the sample for your study. And if you're short of people, how to find free participants covers where to look.
What are the common mistakes?
Choosing segments after you see the results. The Segments Tab can show 30 segments. If you look through all of them, a few will look different by chance, so decide on your one to three segments before you launch, and write down why you chose them.
Splitting until the groups are tiny. A segment of 20 people can put the optimal price almost anywhere. If a segment falls below 100, treat its result as a hint, not a robust insight.
Using segments you can't charge differently. The Segments Tab screenshot at the start of this article splits results by gender. That's useful to understand, but you can't sell a "men's plan", and people also feel it’s unfair when a company charges more just because it can (Kahneman, Knetsch and Thaler, American Economic Review, 1986).
So, segment by something your plans can match, like student status, company size or how often people use the product. Needs-based segmentation and psychographic segmentation cover how to choose useful segments.
Common mistakes in Gabor Granger studies covers the mistakes that happen before you segment, such as testing the wrong prices. How to choose your Gabor Granger price points shows how to avoid that one.
The Gabor Granger guide covers the full method. You can run the survey and segment the results on our free tier.
