
How to read a Van Westendorp chart (with a worked example)
A Van Westendorp chart puts four lines and four crossing points on one graph, which is a lot to take in the first time you see one. Fret not, every part of the chart answers one plain question about price, so you can learn to read the whole chart in about five minutes if you look at one line at a time.
Van Westendorp analysis is the step where you turn those four lines into an optimal price and an acceptable price range for your product. If you want to learn more about Van Westendorp pricing research overall rather than diving specifically into the details about the VW chart, check out this beginner’s guide.
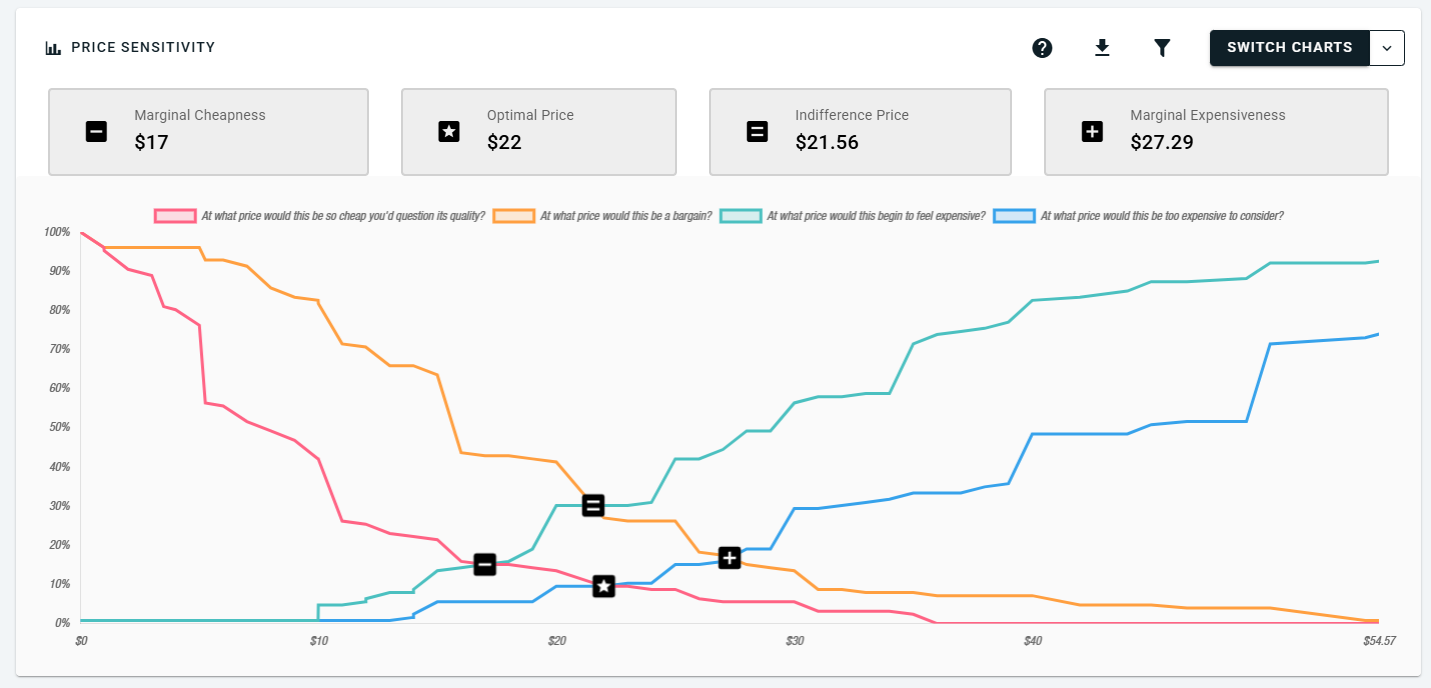
The worked example in this guide uses actual answers from a practice Van Westendorp survey that OpinionX ran about a 30oz Stanley Cup, the insulated water bottle. The guide covers what each of the four lines shows, how to find the optimal price point, the acceptable price range and the indifference price point, and the misreadings that lead people to the wrong price.
What does each line on a Van Westendorp chart show?
A Van Westendorp survey, also called the Price Sensitivity Meter, asks each participant four price questions about one product. The questions ask at what price the product would be so cheap they'd question its quality, a bargain, starting to get expensive, and too expensive to consider. Each of the four lines on the chart shows the answers to one of them. Peter van Westendorp first published the four questions in 1976, in a paper for ESOMAR, the global market research association (ESOMAR).
The horizontal axis (x-axis) shows prices, and the vertical axis (y-axis) shows the share of participants, from 0% to 100%. Each line tells you, at every price, what share of participants put that price into one of the four groups.
Step 1: Read the "too cheap" line on its own
The "too cheap" line shows, at each price, the share of participants who would think the product is so cheap that they'd question its quality. If someone says $10 is too cheap, then $8 and $5 are too cheap for them as well, so the line counts everyone whose "too cheap" answer is that price or higher. That's why the line starts near 100% at the left and falls as the price increases on the x-axis.
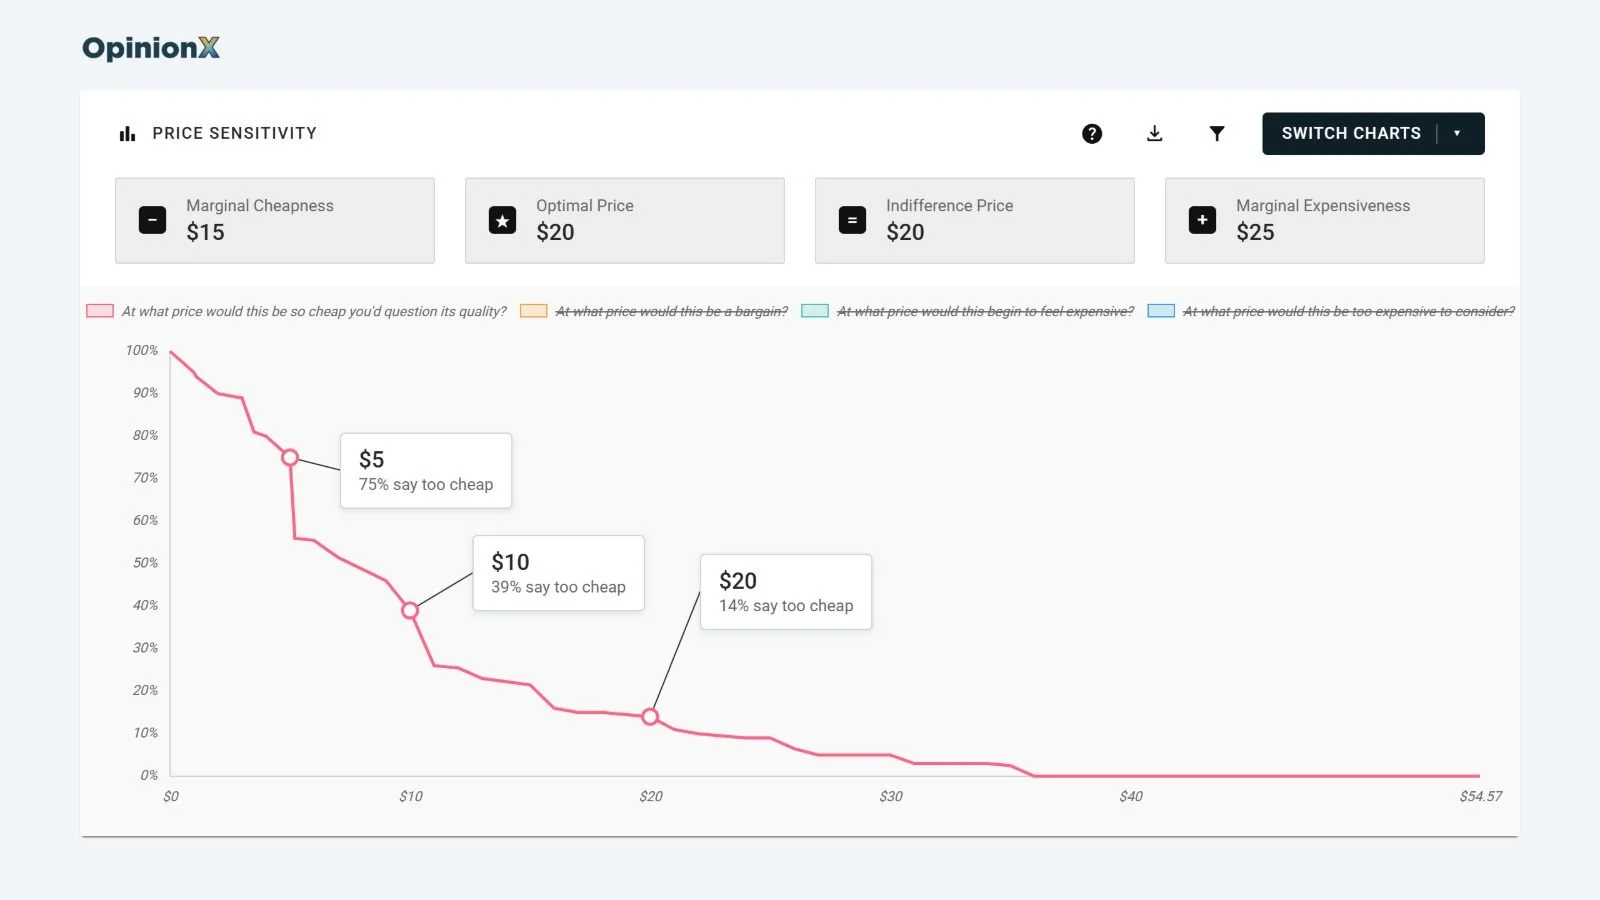
In the Stanley Cup survey, 75% of participants say $5 is too cheap, 39% say $10 is too cheap, and only 14% say $20 is too cheap. Read any point on the line the same way: pick a price on the x-axis, go up to the line, and the y-axis tells you what share of people think that price is too cheap.
Step 2: Add the other three lines
The "bargain" line works the same way as the "too cheap" line, so it also falls from left to right. The "getting expensive" and "too expensive" lines work the other way round. If someone says $40 is too expensive, then $50 and $60 are too expensive for them as well, so those two lines count everyone whose answer is that price or lower, and they rise from left to right.
Here's what the four lines show at a few prices in the Stanley Cup survey:
| Price | Too cheap | Bargain | Getting expensive | Too expensive |
|---|---|---|---|---|
| $5 | 75% | 97% | 1% | 1% |
| $10 | 39% | 79% | 8% | 4% |
| $15 | 19% | 60% | 19% | 9% |
| $20 | 14% | 39% | 36% | 13% |
| $25 | 10% | 26% | 47% | 21% |
| $30 | 7% | 16% | 59% | 32% |
| $40 | 1% | 9% | 81% | 50% |
| $50 | 1% | 5% | 90% | 70% |
The lines in this survey jump at round prices like $10, $20 and $25, because most participants type round figures. A Van Westendorp chart built from actual answers looks like a set of steps, not the smooth curves you'll see in textbook diagrams.
How do you find the optimal price point on a Van Westendorp chart?
The optimal price point on a Van Westendorp chart is where the "too cheap" line and the "too expensive" line cross. At that price, the fewest participants reject the product outright on price, either because it seems so cheap they'd doubt its quality or because it costs more than they'd consider paying.
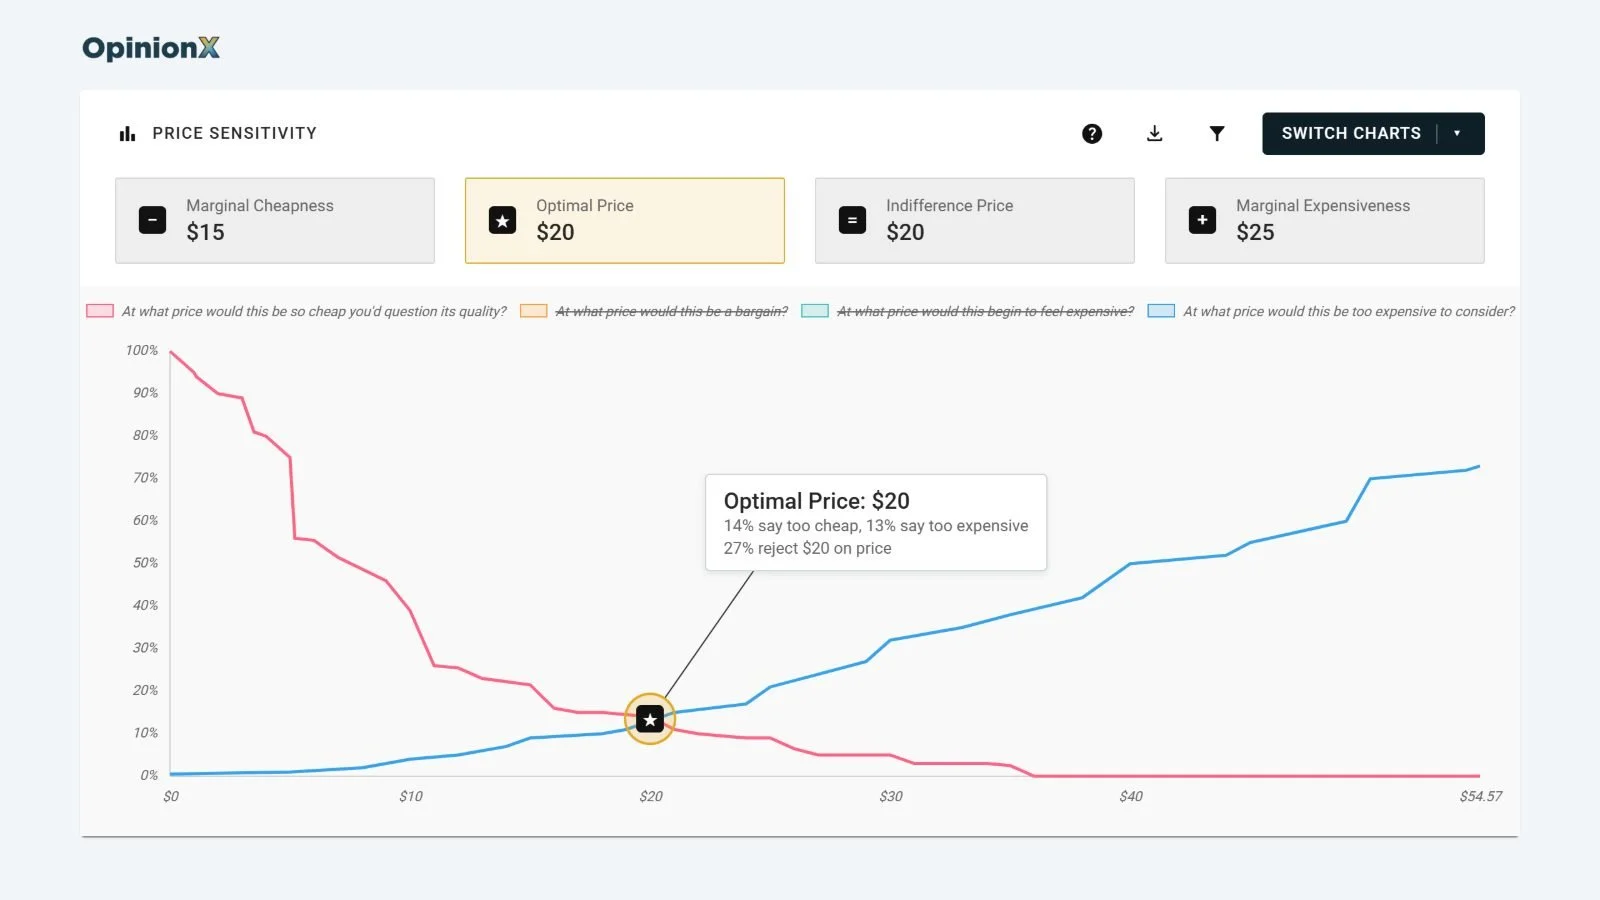
In the Stanley Cup survey, the “too cheap” and “too expensive” lines cross at $20. That means at $20, 14% of participants say the product is too cheap and 13% say it's too expensive, so up to 27% of people in total reject considering the product at $20, while approximately 73% will consider that price within a reasonable range for consideration.
You can check in the table above that fewer people reject $20 than the prices either side of it: at $15, 19% say too cheap and 9% say too expensive, so 28% reject it, and at $25, 10% say too cheap and 21% say too expensive, so 31% reject it.
How do you find the acceptable price range?
The acceptable price range is the span of prices most of your target customers accept, and two more crossing points mark its edges.
The bottom edge is the point of marginal cheapness, where the "too cheap" line crosses the "getting expensive" line. In the Stanley Cup survey that happens at $15, where 19% say the cup is too cheap and 19% say it's getting expensive. Below $15, more people think the price is suspiciously low than think it's starting to get expensive, which is a sign the price is hurting how people judge the cup's quality.
The top edge is the point of marginal expensiveness, where the "bargain" line crosses the "too expensive" line. In the Stanley Cup survey that happens at $25: 26% call $25 a bargain and 21% say it's too expensive, and just above $25 the share calling it a bargain drops to 19%. Above $25, more people rule the cup out as too expensive than see it as a bargain.
So the acceptable price range for a 30oz Stanley Cup in this survey runs from $15 to $25, with the optimal price point of $20 in the middle of it.
What is the indifference price point?
The indifference price point is where the "bargain" line crosses the "getting expensive" line. At that price, as many participants think the product is a bargain as think it's getting expensive, so it tends to show the price people see as normal or expected for the product.
In the Stanley Cup survey, the indifference price point is also $20. At $20, 39% call the cup a bargain and 36% say it's getting expensive, and just above $20 the share calling it a bargain drops to 27%. Don't be fooled though, the optimal price point and the indifference price point don't always land on the same price, and when they're far apart, the price people expect isn't the price the fewest people reject.
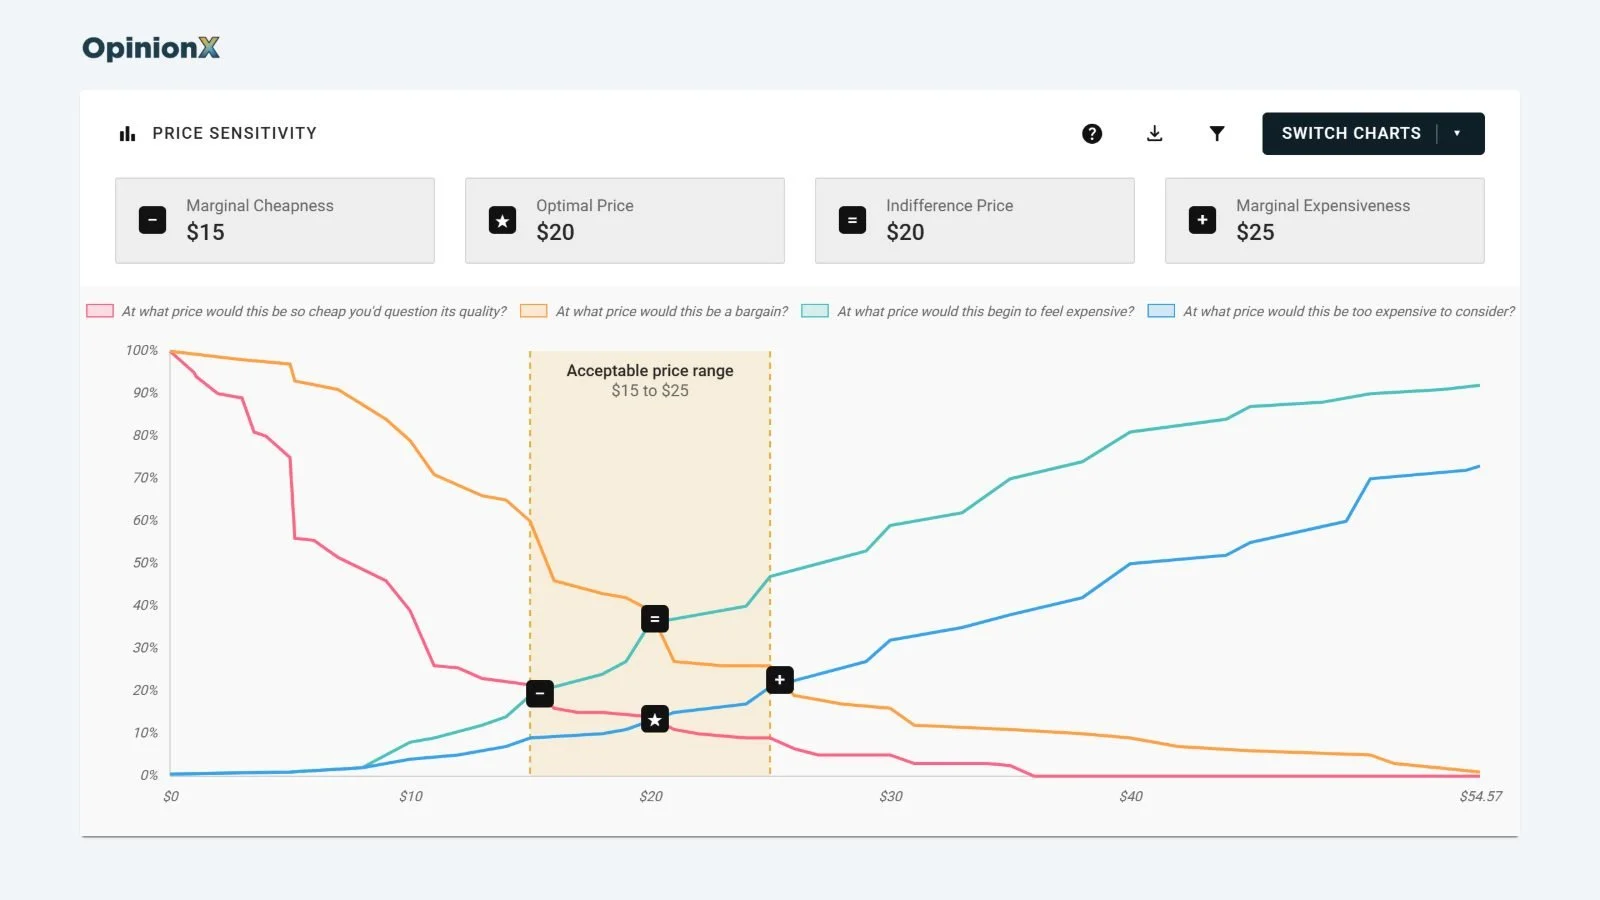
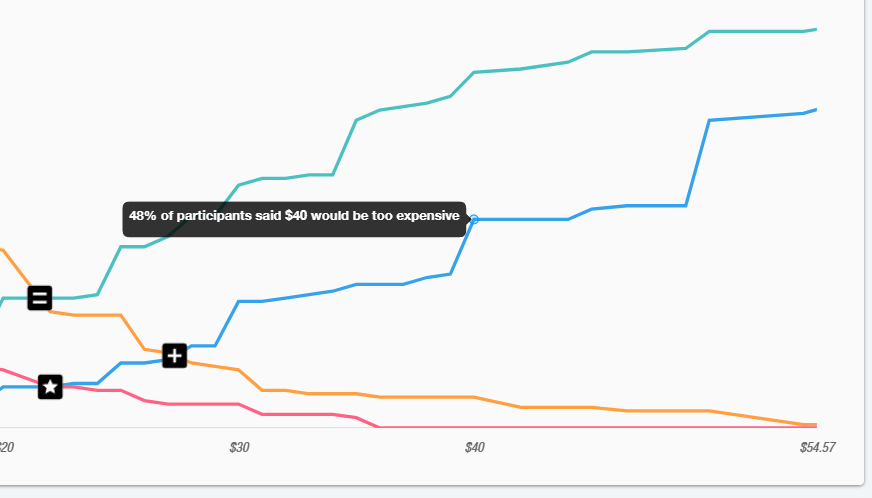
On OpinionX, the Van Westendorp question type runs the analysis for you and labels all four of these prices on the chart. Not sure what a line means? Hover over any point on the chart and a box explains what that line shows at that exact price.
What are the common misreadings and limitations in Van Westendorp analysis?
The most common mistakes in Van Westendorp analysis come from treating the chart as an answer to a question it never asked.
❌ Treating the optimal price point as the price that earns the most revenue. The optimal price point is the price the fewest people reject, which isn't the price that earns the most revenue. A Van Westendorp survey never asks whether anyone would buy, so it can't tell you about revenue. Our guide to the Newton-Miller-Smith extension explains the two extra questions that turn the chart into a revenue estimate.
❌ Reading the y-axis as the share of people who would buy. The y-axis shows how people feel about a price, such as 13% saying $20 is too expensive. It doesn't mean the other 87% would buy at $20, and people say in surveys that they'd pay about 21% more than they really do when money is on the line (Journal of the Academy of Marketing Science, 2020).
❌ Assuming nobody rejects the optimal price. At the Stanley Cup's optimal price of $20, 27% of participants still reject the price. The optimal price point is the price with the fewest rejections, not a price everyone accepts.
❌ Trusting the exact crossing price from a small survey. Each line comes from the share of participants who gave a price, so in a small survey a few unusual answers can move a crossing by several dollars. The pricing consultancy 5 Circles Research suggests at least 200 participants for a business product and 400 for a consumer product. Our Van Westendorp sample size calculator shows how many participants your own study needs.
❌ Comparing acceptable price ranges from tools that draw the range differently. There are two common ways to find the edges of the acceptable price range. The version in this guide, which OpinionX and our Google Sheets template use, crosses "too cheap" with "getting expensive" and "bargain" with "too expensive". The original version flips the middle two lines into "not a bargain" and "not getting expensive" before crossing them, as this open textbook walkthrough shows. The R package pricesensitivitymeter calls the version in this guide the "narrower" range (package documentation). On the Stanley Cup answers, the original version gives an acceptable price range of $10 to $35 instead of $15 to $25, so check which version a tool or report uses before you compare two ranges.
❌ Reading one chart for everyone. If different customer segments would pay very different prices, one combined chart hides that, because it mixes their answers into one set of lines. In one OpinionX survey, people who cycle to work had a $26 optimal price, while people who commute by public transport had a $15 optimal price for the same product. Our guide on how to segment Van Westendorp results shows how to compare segments, and our guide to crosstab analysis explains how to put many segments side by side in one table.
❌ Leaving in answers that contradict themselves. Every participant's four prices have to rise in order, from too cheap to too expensive. The Stanley Cup survey used a plain number question, and 9 of the 143 people who answered all four questions gave prices out of order, such as a bargain price higher than their too-expensive price. Run Van Westendorp on a basic forms tool and you'll have to find and remove those answers by hand before you build the chart. The Van Westendorp question type on OpinionX stops participants from entering a lower price than their previous answer, and the "Based on" label on the chart shows how many valid participants the results come from.
Rather build the chart yourself? Our Van Westendorp Google Sheets template turns exported survey answers into the four lines and finds the crossing points for you. If you're deciding between Van Westendorp and a survey that tests specific prices, our guide on Van Westendorp vs Gabor Granger explains which one gives you the answer you need. And for the full method, from writing the four questions to choosing your participants, read our Van Westendorp pricing guide.
About to run your first Van Westendorp survey and want someone to look over your product description and price settings before it goes out? Book a free 30-minute setup call and a research expert will walk through the survey with you, with no obligation.
The Van Westendorp question type is on OpinionX's free plan, with up to 25 participants per survey, and it draws the chart and labels the four key prices for you.
