
How to segment Van Westendorp results (with a worked example)
A Van Westendorp survey gives you one acceptable price range for your whole market, and that single range can hide groups of customers who would pay very different prices. In a practice Van Westendorp survey OpinionX ran about a 30oz Stanley Cup, the 134 valid participants accepted prices from $15 to $25, with an optimal price of $20. Split by how they get to work, people who cycle accepted $25 to $35, while people who take public transport accepted $10 to $18. The $20 price that looked right for everyone sits outside the acceptable price range of both groups. Van Westendorp segmentation is how you find splits like this before you set a price.
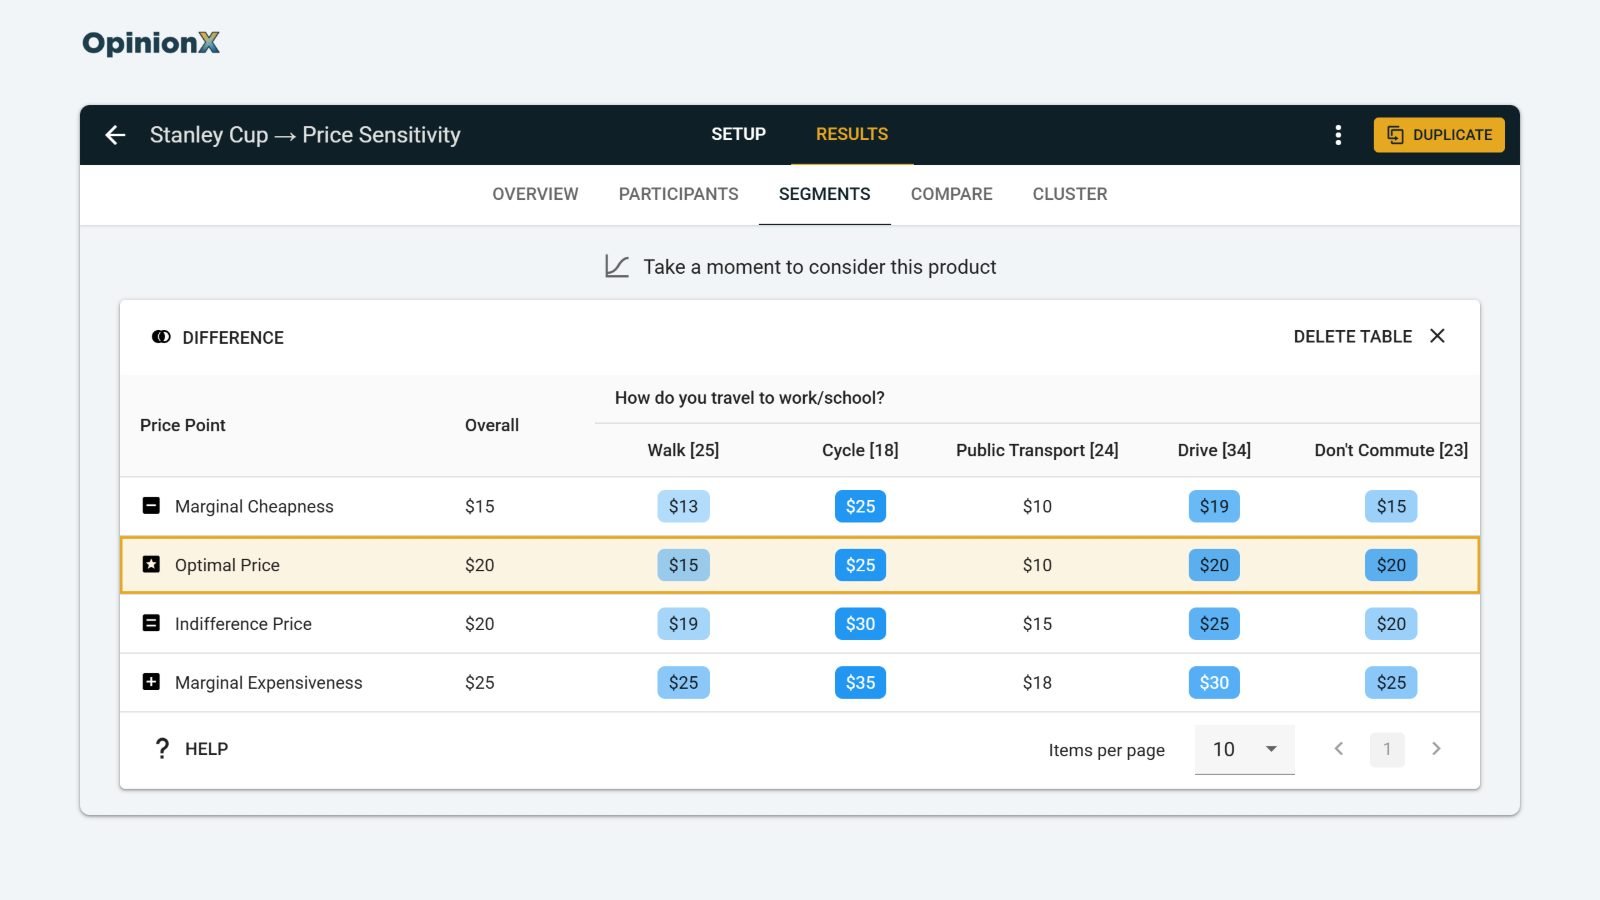
This guide covers why one acceptable price range misleads when groups disagree, how to split the four Van Westendorp lines by customer segment on OpinionX, how to turn the results into segmented or tiered pricing, and how many participants each segment needs.
Why does a single acceptable price range mislead?
A Van Westendorp survey, first published by Peter van Westendorp in 1976 (ESOMAR), asks each participant four price questions about one product. The questions ask at what price the product would be so cheap they'd question its quality, a bargain, starting to get expensive, and too expensive to consider. The chart turns those answers into four lines, and the points where the lines cross give you the acceptable price range (the prices most people don't reject) and the optimal price point (the price the fewest people reject as too cheap or too expensive). Our guide How to read a Van Westendorp chart explains each line and crossing with the same Stanley Cup data.
Each line adds up everyone's answers. When two groups want very different prices, their answers mix, and the lines cross somewhere between the two groups instead of where either group sits. The overall result can look comfortable while both groups are unhappy with it.
The Stanley Cup survey shows this at $20. Across all 134 participants, 14% say $20 is too cheap and 13% say it's too expensive, which looks like a safe price. Among the 18 people who cycle to work, though, 33% say $20 is so cheap they'd doubt the cup's quality. Among the 24 people who take public transport, only 12% call $20 a bargain and 46% say it's getting expensive. So at the same $20 price, the cyclists start to doubt the cup's quality while the public transport commuters are close to ruling it out.
How do you split Van Westendorp results by segment?
A customer segment is a group of participants you look at on its own, such as people on one pricing plan or in one country. Splitting Van Westendorp results by segment means redrawing the four lines using only that group's answers, which gives the group its own acceptable price range and optimal price.
Step 1: Collect the information that defines each segment
You can only split results by information you have about each participant, and on OpinionX there are two ways to get it. You can add a multiple-choice question to the same survey, such as the "How do you travel to work or school?" question in the Stanley Cup survey, and each answer tags that participant. Or you can import data you already hold, such as each customer's plan or company size from your CRM, and match it to participants.
Choose segments that connect to a pricing decision. A segment you can price, package or market to separately, such as current plan, company size or the job customers use your product for, is worth more than one you can't act on. Our guide to needs-based segmentation explains how to group customers by what they need the product to do, which ties each segment to a reason someone would pay more or less.
Step 2: Filter the chart to one segment
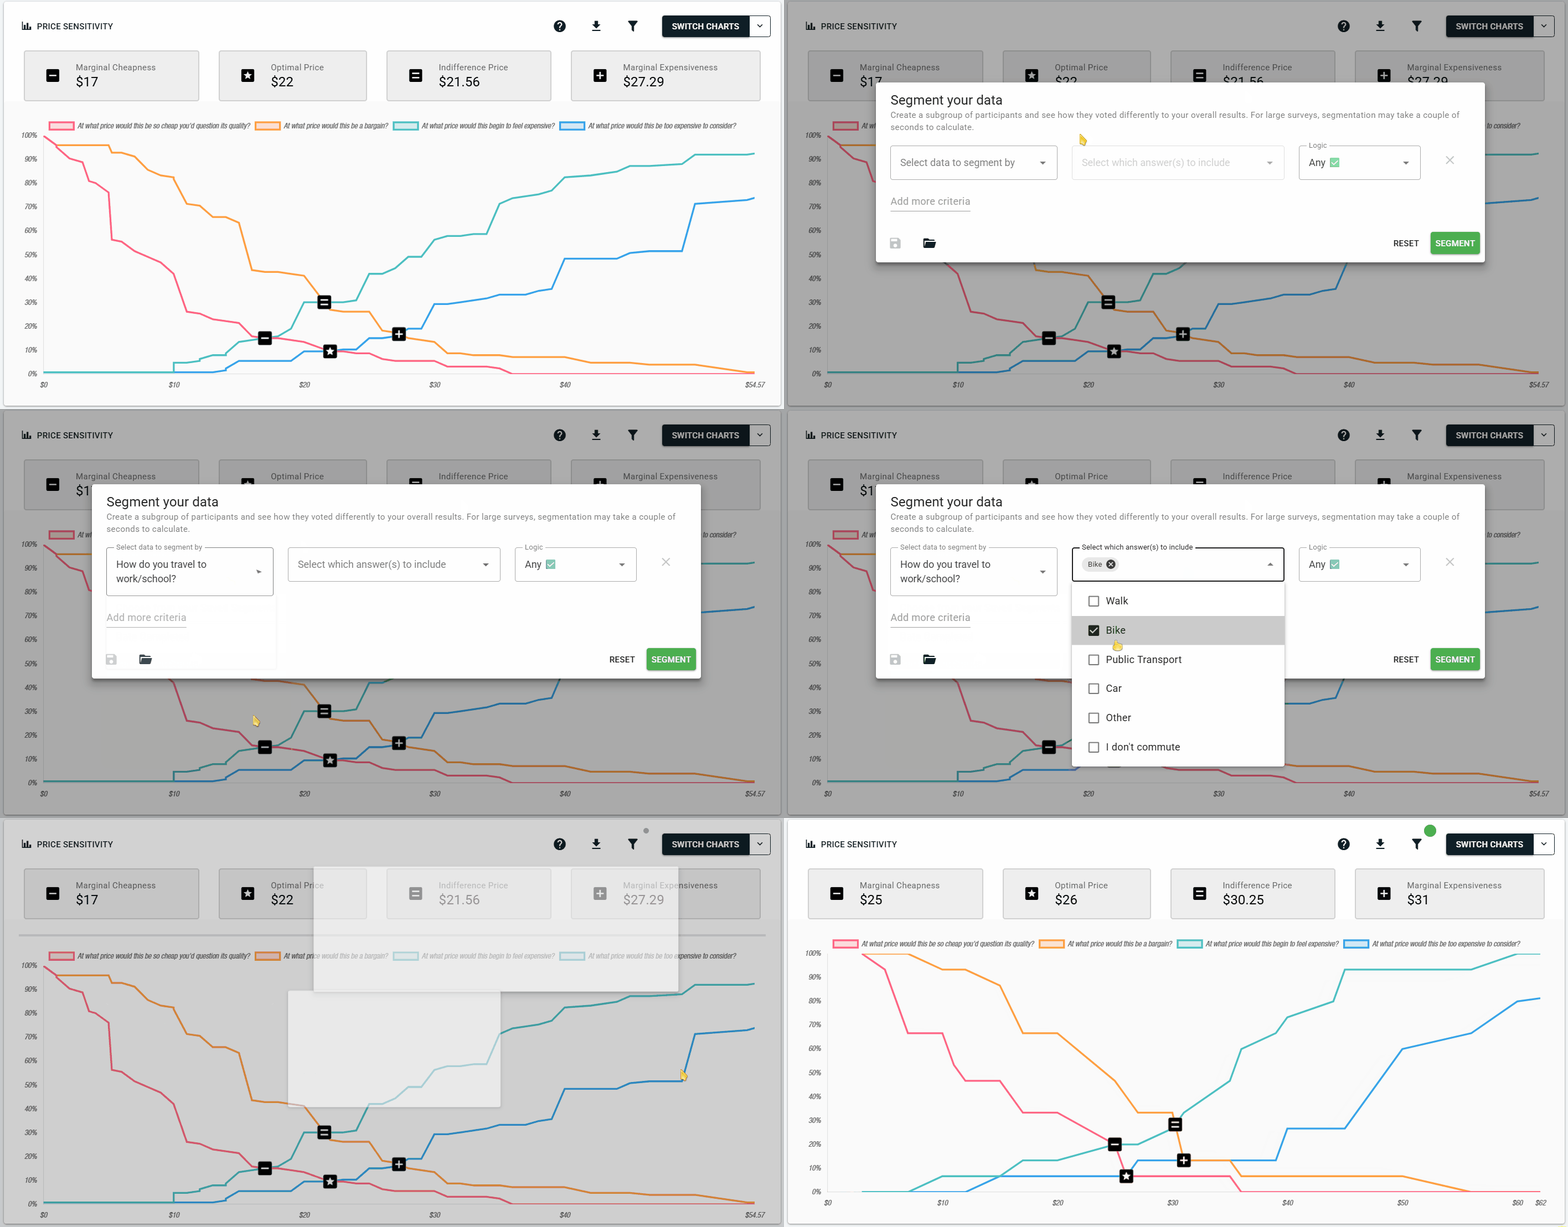
On your Van Westendorp results dashboard on OpinionX, it’s easy to filter your results to exclude everyone except to one segment, such as people who cycle to work. The chart redraws all four lines from that group's answers only, and the four key prices update with it, so you see that group's acceptable price range and optimal price.
Step 3: Compare segments side by side
OpinionX’s Compare Tab puts the Van Westendorp charts for two segments next to each other, so you can see where their lines sit apart. To view even more groups at once, the Segments Tab goes further and builds a crosstab (a table with one column per segment), so you can scan many groups at once and spot the ones that would pay far more or far less than everyone else; the crosstab at the top of this guide is the Segments tab for the Stanley Cup survey. Our guide to crosstab analysis explains how to read that kind of table.
Here are the Stanley Cup results for each commuter group with at least 18 participants:
| Segment | Participants | Acceptable price range | Optimal price point | Indifference price point |
|---|---|---|---|---|
| Everyone | 134 | $15 to $25 | $20 | $20 |
| Cycle to work | 18 | $25 to $35 | $25 | $30 |
| Drive | 34 | $19 to $30 | $20 | $25 |
| Don't commute | 23 | $15 to $25 | $20 | $20 |
| Walk | 25 | $13 to $25 | $15 | $19 |
| Public transport | 24 | $10 to $18 | $10 | $15 |
The indifference price point is where as many people call a price a bargain as call it getting expensive, which tends to show the price a group sees as normal.
Choosing segments and making sure each one ends up with enough participants is the part of a segmented pricing study that most often goes wrong. Want a research expert to check your segment questions and sample size before your survey goes out? Book a free 30-minute setup call, with no obligation.
How do you turn segmented results into a pricing decision?
Segmented Van Westendorp results lead to one of two situations, and each one points to a different decision.
✅ The ranges overlap. When every segment you care about accepts some of the same prices, pick a price inside the overlap. In the Stanley Cup survey, people who drive accept $19 to $30 and people who don't commute accept $15 to $25, so any price from $19 to $25 sits inside both ranges.
✅ The ranges don't overlap. When two segments accept completely different prices, one price will be wrong for at least one of them. In the Stanley Cup survey, people who cycle accept $25 to $35 and people who take public transport accept $10 to $18, so no single price works for both. You then have three options:
Offer two versions at two prices, such as a basic and a premium version, each priced inside one segment's range. That's how tiered pricing works: you price each tier for the segment it's meant for.
Sell through channels that reach one segment, such as a cycling shop, and price for that segment there.
Choose the segment you want to win and price for it, accepting that the other segment will find the price wrong.
Van Westendorp tells you which prices each segment accepts, but not which price earns the most revenue from each one. Add the Newton-Miller-Smith extension to your survey and each segment gets a revenue estimate too, and our comparison of Van Westendorp vs Gabor Granger explains how to test specific prices per segment once you know each one's range.
What are the limitations of Van Westendorp segmentation?
The biggest catch with Van Westendorp segmentation is that every segment needs enough participants of its own. The cyclists in the Stanley Cup survey are only 18 people, and a Van Westendorp chart built from 18 people moves a lot when a few answers change. The pricing consultancy 5 Circles Research suggests at least 200 participants for a business product and 400 for a consumer product before you rely on a result.
To check how much the small groups move, we drew 2,000 random samples from each group's actual answers. The cyclists' optimal price landed anywhere from $15 to $40 in 90% of the samples, and the public transport commuters' landed between $6 and $20. The cyclists' optimal price came out higher in 97% of the samples, so the gap between the two groups is very likely to be there in the market, but the exact prices for each group aren't reliable at this size. Our Van Westendorp sample size calculator works out how many participants you need when you plan to read your smallest segment on its own, which is around 100 per segment to see roughly where its price sits.
Compare enough segments, too, and some differences turn up by chance. Split results into 30 segments and a few will look unusual even when they aren't, so treat a surprising segment as a question to test again, not a finding.
Finally, a segment you can't reach, package or price separately tells you something interesting about your market but doesn't change what you charge.
For the full Van Westendorp method, from writing the four questions to choosing participants, read our Van Westendorp pricing guide. Want to segment by how your customers think instead of who they are? Our guide to psychographic segmentation covers grouping people by their attitudes and priorities.
The Van Westendorp question type, with filters, the Compare tab and the Segments tab, is on OpinionX's free plan with up to 25 participants per survey, so you can build and test a segmented study before you run it.
