
Van Westendorp and Gabor Granger in one survey (how to build it and read it)
Two pricing surveys that answer two different questions. Van Westendorp asks people what prices feel too cheap, a bargain, getting expensive and too expensive, revealing the price range that your market accepts. Gabor Granger shows people one price at a time and asks if they'd buy at each, revealing which price point earns you the most revenue overall.
This guide covers what each method adds and the two catches in running them together. Then it shows how to build the survey step by step, and how to turn the two results into one price.
What does each method add?
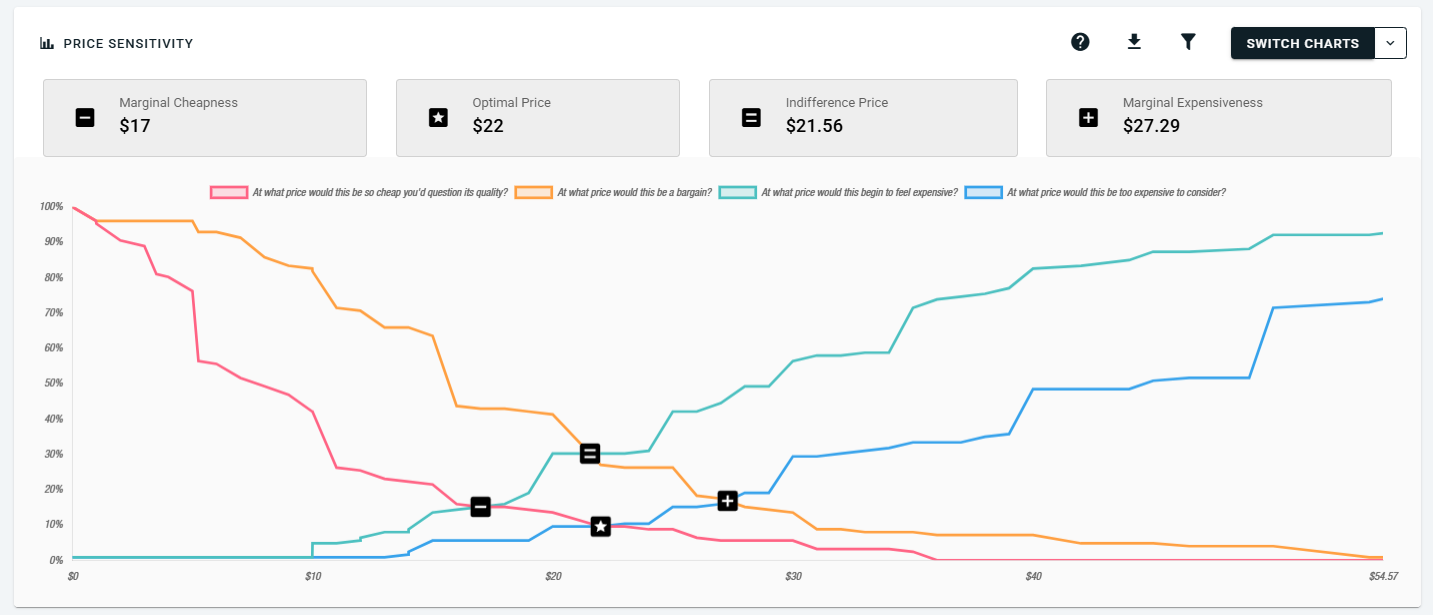
Van Westendorp gives you the acceptable range. It asks four questions, first published by Peter van Westendorp in 1976 (van Westendorp, ESOMAR Congress, 1976). You get two edges where the answers cross. Marginal Cheapness is the lowest acceptable price: below it, too many people think the product is so cheap it must be poor quality; Marginal Expensiveness is the highest: above it, too many people rule it out. Everything in between is the acceptable range.
Gabor Granger gives you the max revenue. It shows each person a price and asks yes or no. From those answers you get demand, the share of people who'd buy at each price. Price times demand gives revenue per target customer, and the price where that peaks is the optimal price. The method dates back to André Gabor and Clive Granger (Applied Statistics, 1961).
Each method misses what the other catches. Van Westendorp never asks anyone whether they'd actually buy something. Its own "Optimal Price Point" is the price the fewest people reject, which is different from what earns the most money. Gabor Granger never asks whether a price looks suspiciously cheap, so it can point to a price that earns well but that a big share of people think is too expensive.
If you only have room for one, Van Westendorp vs Gabor Granger covers which to choose.
What's the catch with running both at once?
There are two, and both are about how you set up the survey.
You can't use the acceptable range to set your Gabor Granger prices. Gabor Granger needs its price range chosen before the survey goes live, and the acceptable range from Van Westendorp only exists once people have answered. In one survey, you use the acceptable range afterwards, to judge the Gabor Granger result.
The fix is to give Gabor Granger a wide price range. For example, if you expect a price around $200, test from $100 to $400. A wide range costs participants very few extra questions, as how a Gabor Granger survey picks the next price explains. If you have no idea where the price should be, run a small Van Westendorp survey first. Our free plan allows 25 participants per survey, which is enough to find a rough price range to test. How to choose your Gabor Granger price points covers the rest.
The order of the two blocks changes the answers. The first price people see pulls their later answers towards it (Tversky and Kahneman, Science, 1974). If Gabor Granger comes first, people see your prices before they name their own. Their Van Westendorp answers then lean towards your prices, which removes what Van Westendorp is best at: finding what people think without your prices in their head.
So put Van Westendorp first. Though this has a cost too, because earlier answers in a survey can affect later ones (Tourangeau, Rips and Rasinski, The Psychology of Survey Response, 2000). Someone who just said $180 feels expensive may say no to $200, even if they'd have said yes otherwise. That's a smaller problem than anchoring the Van Westendorp answers to your prices, but it means the two results aren't fully independent.
How do you build it on OpinionX?
Both methods are built-in question types, and both are on the free plan. Add Van Westendorp first, then Gabor Granger.
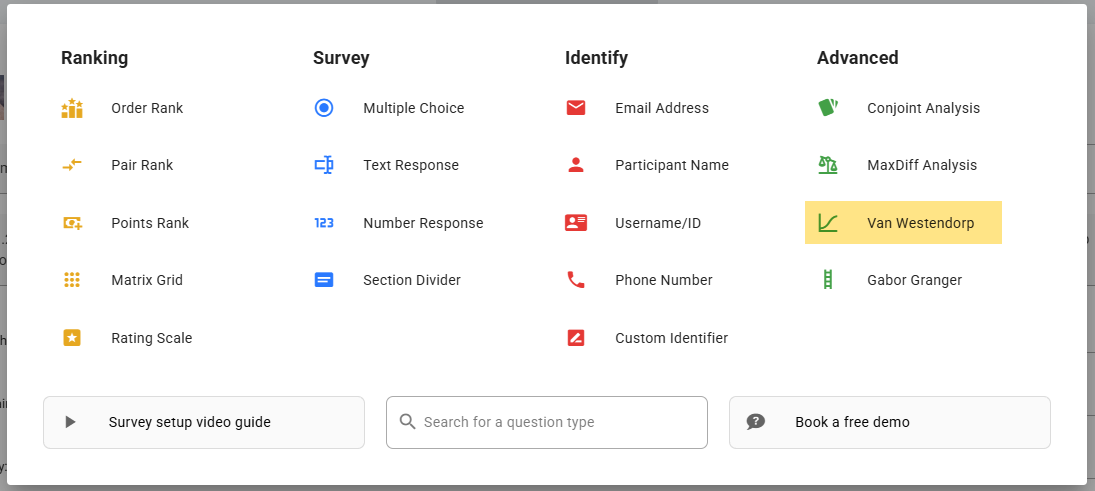
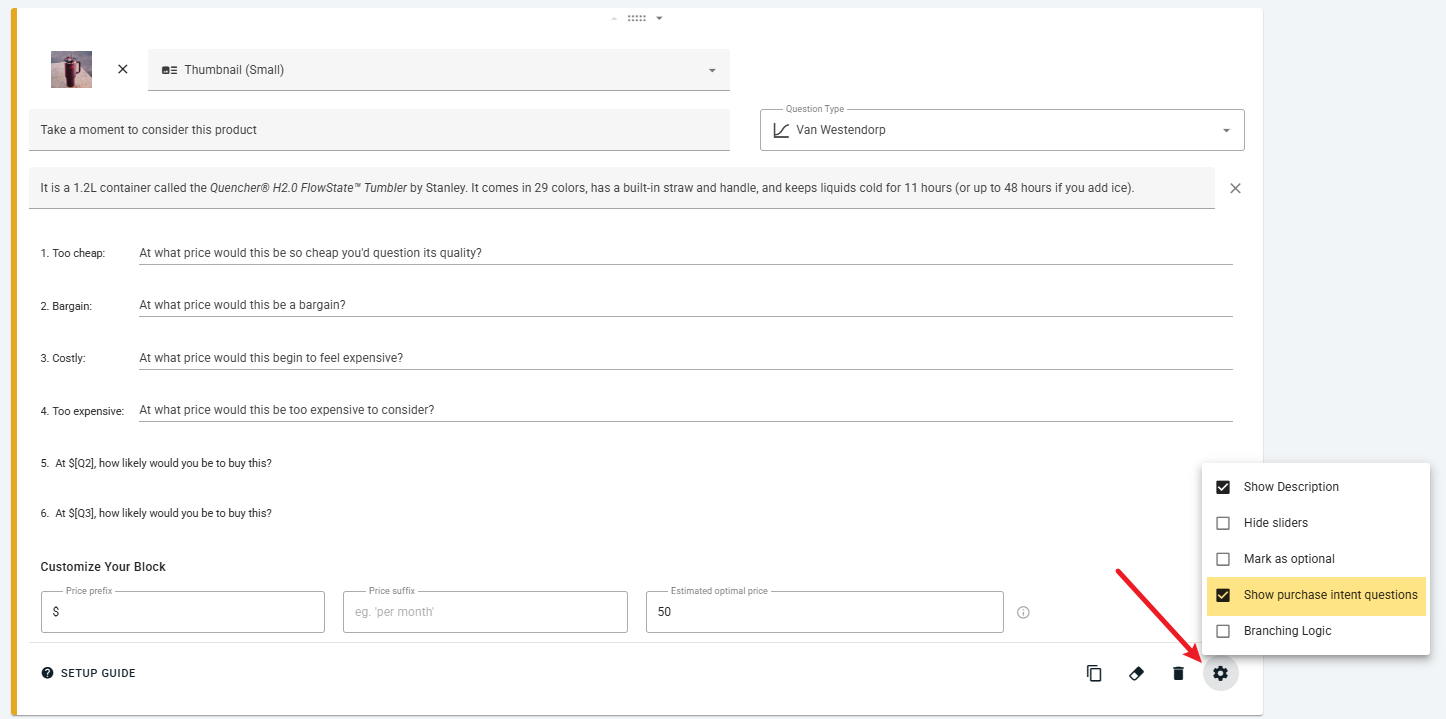
1. Add the Van Westendorp block. Create a survey, click to add a question, and choose Van Westendorp from the Advanced list.
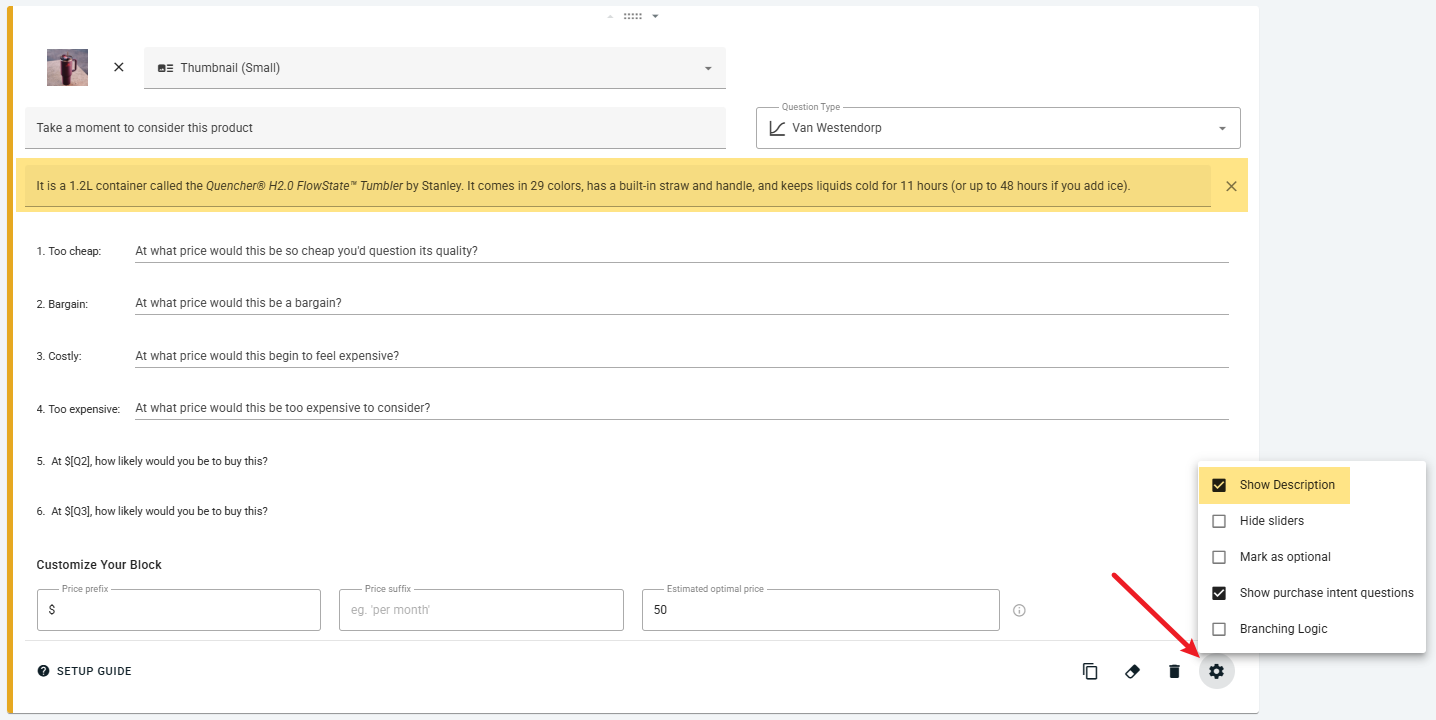
2. Describe what's being priced. Add a clear description and a product image. Use the block settings (the ⚙️ icon) and turn on "Show description" if you need more room.
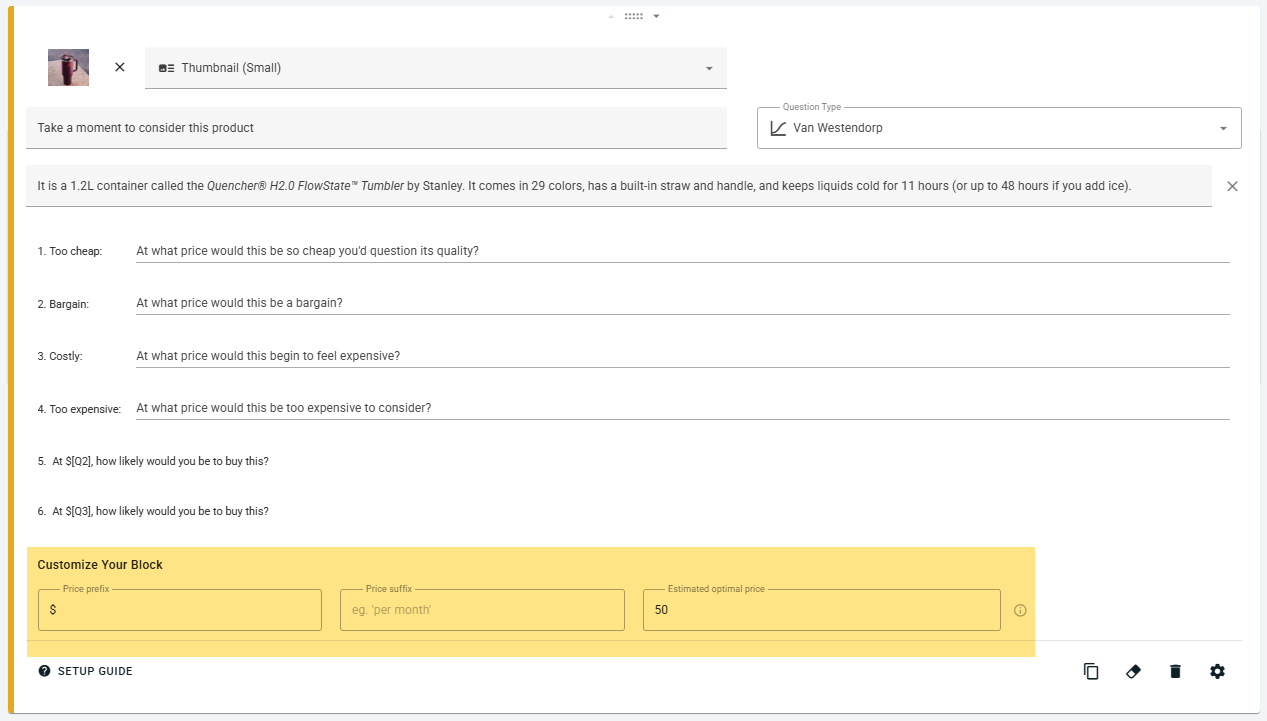
3. Set the Price estimate. This is roughly what you expect the product to cost. It sets where the price slider starts, and people can still go higher. Add your currency as the price prefix and any unit, like "per month", as the price suffix.
4. Decide on the price elasticity questions. The "Show purchase intent questions" setting adds two questions that ask how likely people are to buy at their own bargain and expensive prices; this is enabled by default. With Gabor Granger in the same survey, you don't need them to find a revenue-maximising price. Keep them on if you'd like a second estimate to compare, or turn them off to keep the survey shorter.
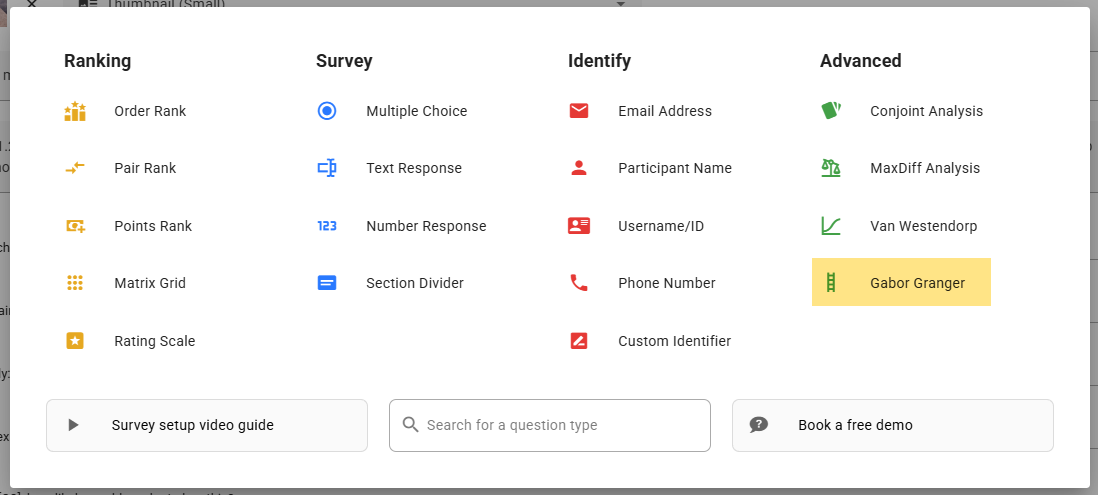
5. Add the Gabor Granger block. Click "Add another question" and choose Gabor Granger from the Advanced list. Use exactly the same description, image, prefix and suffix as the Van Westendorp block, so people price the same offer twice.
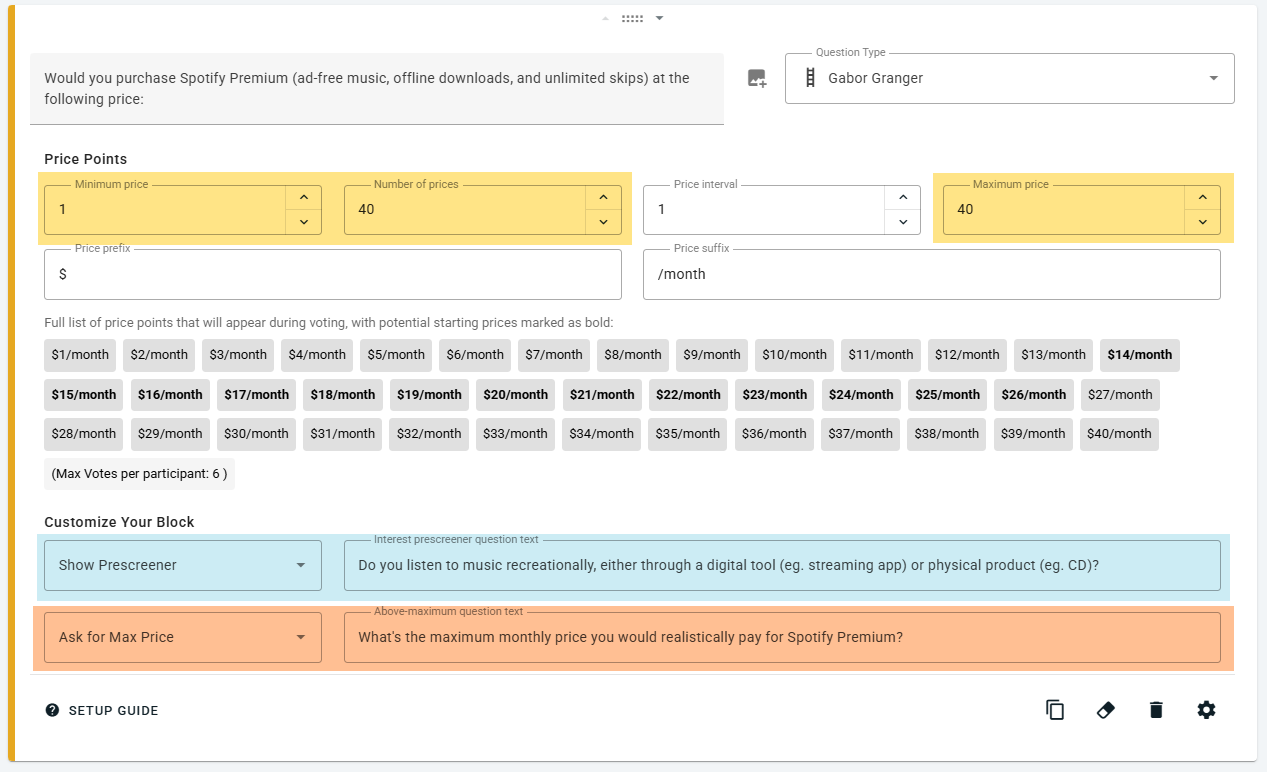
6. Set a wide price range. Type the minimum price, the number of prices and the maximum price. Keep the Interest Prescreener on, so people who'd never buy skip the prices. Keep the Above-Max Question on, so anyone who says yes to your highest price tells you what they'd really pay.
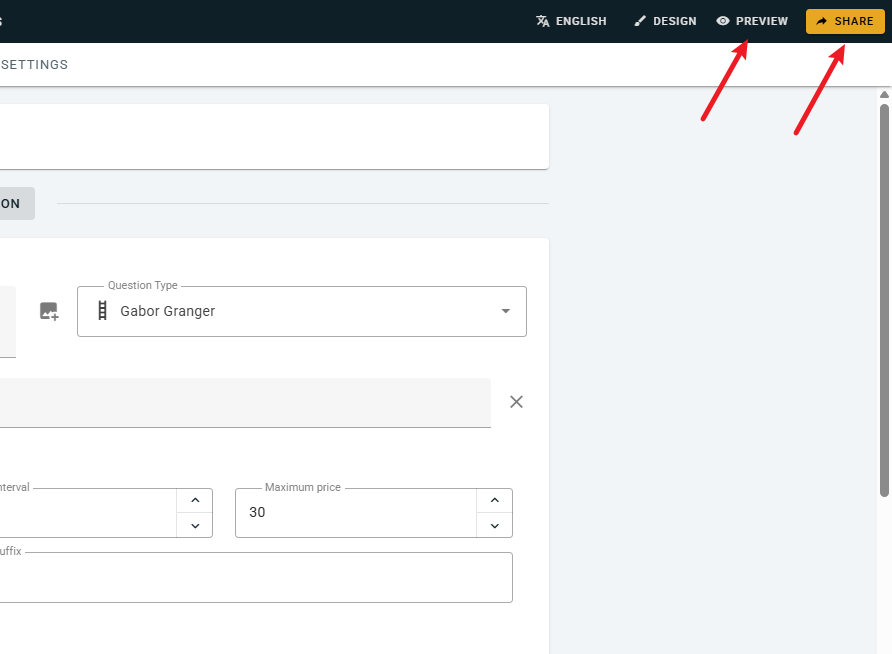
7. Preview, then share. Click Preview to take the survey yourself. When it's ready, click Share and choose how to send it.
The Gabor Granger price range is the hardest setting to fix after launch. A research expert will check both blocks and your audience with you before you launch, for free.
How do the two results combine into one price?
Here's a simulated example: a robot vacuum, tested by 60 people with both blocks. Gabor Granger tested 8 prices from $120 to $400.
Van Westendorp said:
Marginal Cheapness: $130
Optimal Price Point: $135
Indifference Price Point: $186
Marginal Expensiveness: $210
The acceptable range is therefore $130 to $210.
Gabor Granger said: the optimal price is $200, earning $129.63 per target customer. At $160, it earns $124.44, only 4% less.
Now put them together. The optimal price of $200 sits inside the acceptable range, but only $10 below its upper edge. In the Van Westendorp answers, 27% of people already called $200 too expensive. Meanwhile, dropping to $160 costs only 4% of revenue and sits well inside the acceptable range.
So there are two sound price decisions: charge $200 to earn the most, knowing it's close to where people start ruling the product out, or charge $160 for nearly the same revenue from a price far fewer people object to. The survey can't choose for you, but it shows exactly what each option trades.
Notice that Van Westendorp's Optimal Price Point, $135, is far from $200. The two prices answer different questions: $135 is the price the fewest people reject, and $200 is the price that earns the most.
In general, where the Gabor Granger price lands tells you what to do:
| Gabor Granger's optimal price is… | What it means | What to do |
|---|---|---|
| 🟢 Inside the acceptable range | It earns the most and most people accept it | Use it. If it's near an edge, check whether a price further inside earns almost as much |
| 🟠 Above Marginal Expensiveness | It earns the most, but many people think it's too expensive | Look at the revenue at Marginal Expensiveness. If it's close, the lower price is the safer call |
| 🟠 Below Marginal Cheapness | It earns the most, but many people think it's so cheap it must be poor quality | Consider a price at or above Marginal Cheapness, and check the Gabor Granger price range wasn't set too low |
How to read a Gabor Granger chart explains the revenue line, and the Van Westendorp guide explains the four points.
What are the limitations?
The two results aren't independent. The same people answer both, and their Van Westendorp answers can push their Gabor Granger answers, so when the two agree, part of that agreement comes from the survey itself.
Neither method shows competitors. People price your product on its own when answering your survey. If buyers will compare you with a rival's price, conjoint analysis puts rivals in the question.
Stated answers run high. People claim they'd pay about 21% more than they really do (Schmidt and Bijmolt, Journal of the Academy of Marketing Science, 2020). Use the revenue figures to compare prices, and keep them out of any forecast.
The results might disagree. Gabor Granger and Van Westendorp may both produce an ‘optimal price’ output, but they don’t actually measure price perceptions, willingness to pay, or price sensitivity in the same way. When they disagree, you’ll need to consider why that might be the case.
The survey is longer. Each person answers four Van Westendorp questions plus the Gabor Granger questions. Check the sample size calculator so you recruit enough people for both.
The Gabor Granger guide covers the method in full.
