
Comparing The Top 10 Most Popular Conjoint Analysis Tools (Free vs Paid)
Conjoint analysis is a powerful research method for uncovering which product attributes matter most to users when comparing products and making purchase decisions. It helps teams make data-driven decisions about pricing, feature prioritization, bundling, and more.
But not all conjoint tools are created equal. Options range from free, no-frills survey builders to enterprise-grade platforms costing upwards of $30,000 per year that require expert consultants to operate. Choosing the wrong one can mean lost time, poor-quality insights, and a lot of wasted money.
This post examines 10 of the most popular conjoint analysis software platforms to help you choose the best fit for your next user research project. If you’re still getting up to speed on conjoint analysis, these guides will help you learn the basics:
Ultimate Guide to Conjoint Analysis (Explanation, Tools, Examples)
13 Types of Conjoint Analysis (Explained with Image Examples)
8 Alternative Survey Methods To Use Instead Of Conjoint Analysis
How your Conjoint Analysis results are calculated (advanced guide)
Let’s dive into the reviews…
10 Most Popular Conjoint Analysis Software Tools:
After reviewing a broad range of research platforms, I created a detailed overview of each conjoint analysis software provider:
— — —
1. OpinionX
OpinionX is a survey platform built for ranking people’s preferences and priorities, trusted by over 36,000 organizations worldwide including teams at Google, Amazon, and Spotify.
OpinionX is one of the very few conjoint analysis tools that lets you design and analyze full conjoint surveys for free. All conjoint analysis functionality is unlocked on the free plan, with surveys available for up to 10 participants, making it ideal for learning, testing setups, and early validation — before scaling to larger samples on a paid plan.
Let’s take a closer look at:
i. How OpinionX Works
ii. OpinionX’s Conjoint Features
iii. Pricing Plans Breakdown
⬆️ Interactive conjoint analysis demo on OpinionX ⬆️
^ Building a conjoint analysis survey on OpinionX
i. How OpinionX Works
All question types are included in the free tier of OpinionX. That means you can run Conjoint Analysis and MaxDiff Analysis alongside standard survey formats like Multiple Choice, Rating Scale, and Open Text Response.
Flexibility
With OpinionX’s flexible survey builder, you can mix and match these formats to fit your research needs. Add demographic questions at the beginning and/or end, ask for people’s open-ended opinions, and use branching logic to direct participants to different conjoint analysis questions entirely based on their previous answers.
While this flexibility might seem like a basic feature, more than half of the tools I reviewed don’t let you put conjoint analysis inside a larger survey. That limitation is a dealbreaker for most researchers running conjoint surveys, which is why many teams are choosing OpinionX as their primary research platform.
Filtering
As OpinionX was built specifically for running ranking surveys, it includes some power features tailored specifically for conjoint analysis. For example, you can filter your survey results in one click to compare how different groups of participants voted:

Segmentation
Or, you can compare results across up to 30 segments all at once in a single table -- an easy way to spot groups with significantly different preferences to everyone else:
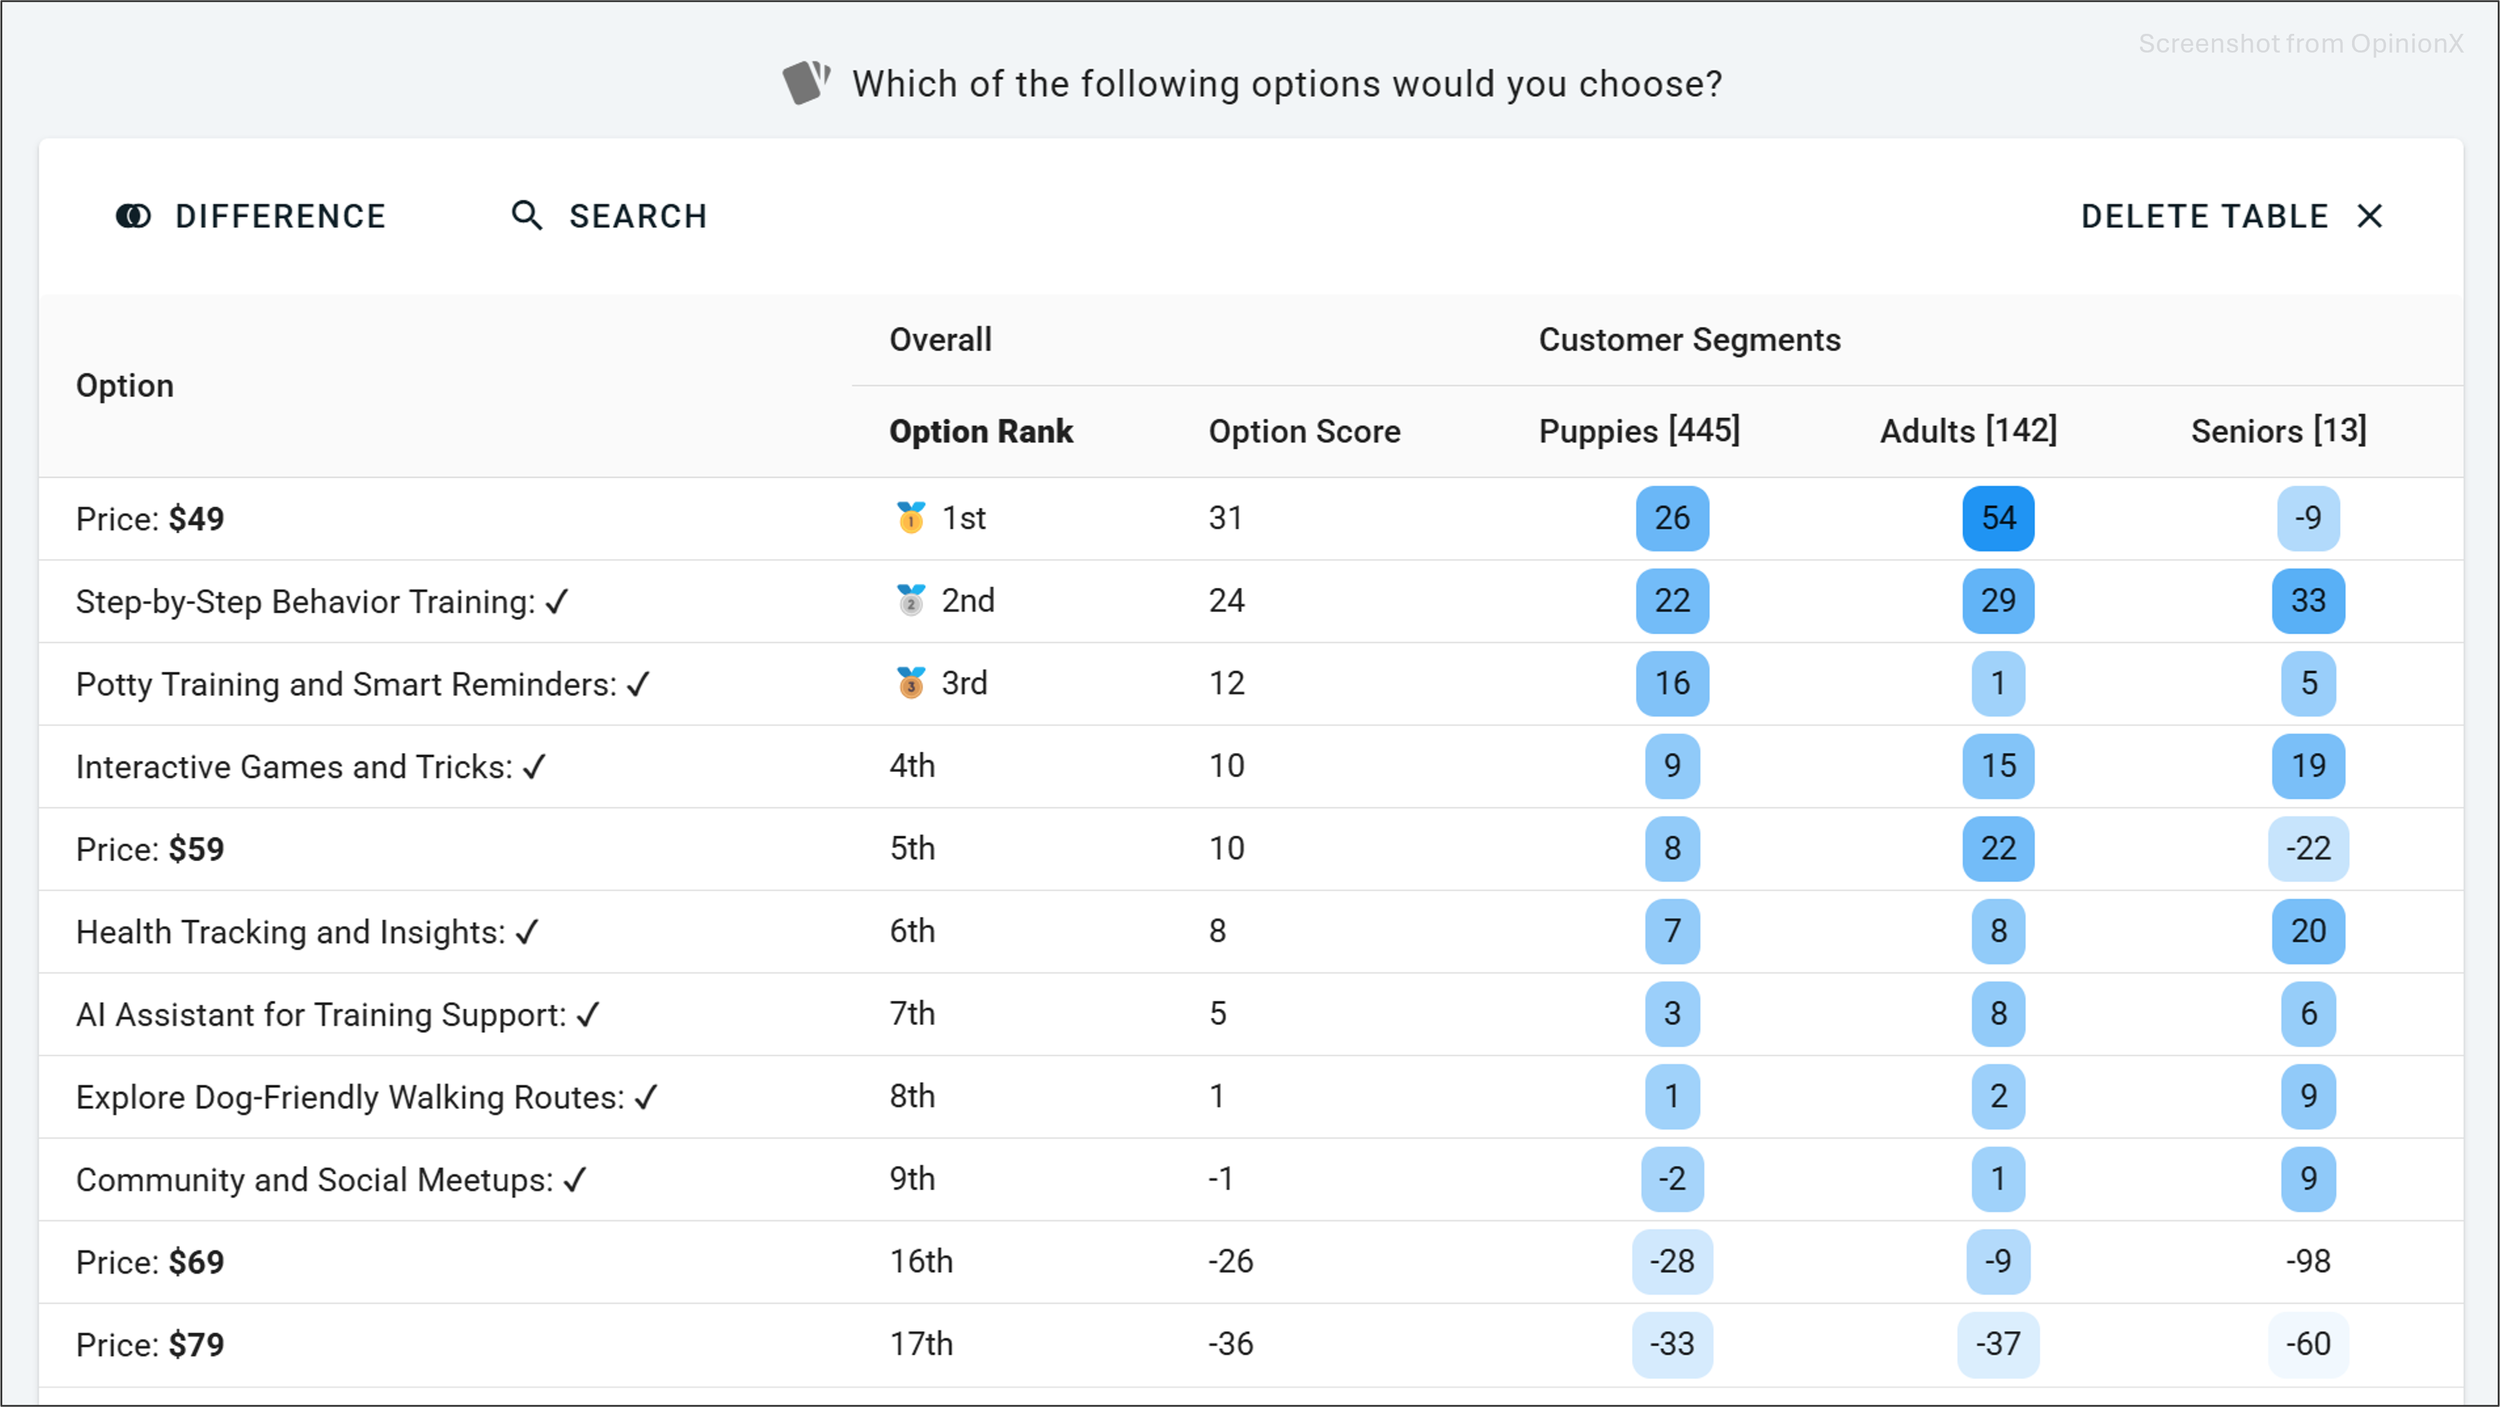
^ Example from Dogo’s pricing optimization conjoint → read the full case study
Enrichment
These segments are created automatically when you include Multiple Choice questions in your survey. If you already have this data from elsewhere (like your CRM or a product analytics tool), you can use OpinionX’s enrichment feature to match that information to your participants’ conjoint votes without needing to ask unnecessary extra questions in your survey.
For product research, segmentation is critical. It’s not enough to know which features or pricing models matter most overall -- you need to understand which types of customers care about them. That’s how you make smarter decisions about pricing, product positioning, and user experience.
ii. Conjoint Analysis Features on OpinionX
OpinionX doesn’t impose arbitrary design limits on your conjoint analysis surveys. You can include as many attributes and levels per attribute as your research requires.
This might seem like a small detail, but many conjoint analysis tools restrict your setup -- for example, on Sawtooth you are capped on each attribute at 15 levels max.
While it’s always smart to follow best practices when designing conjoint surveys, OpinionX gives you the flexibility to build exactly what your project requires, without running into the constraints that often slow down or limit researchers on other platforms.

Conjoint Results
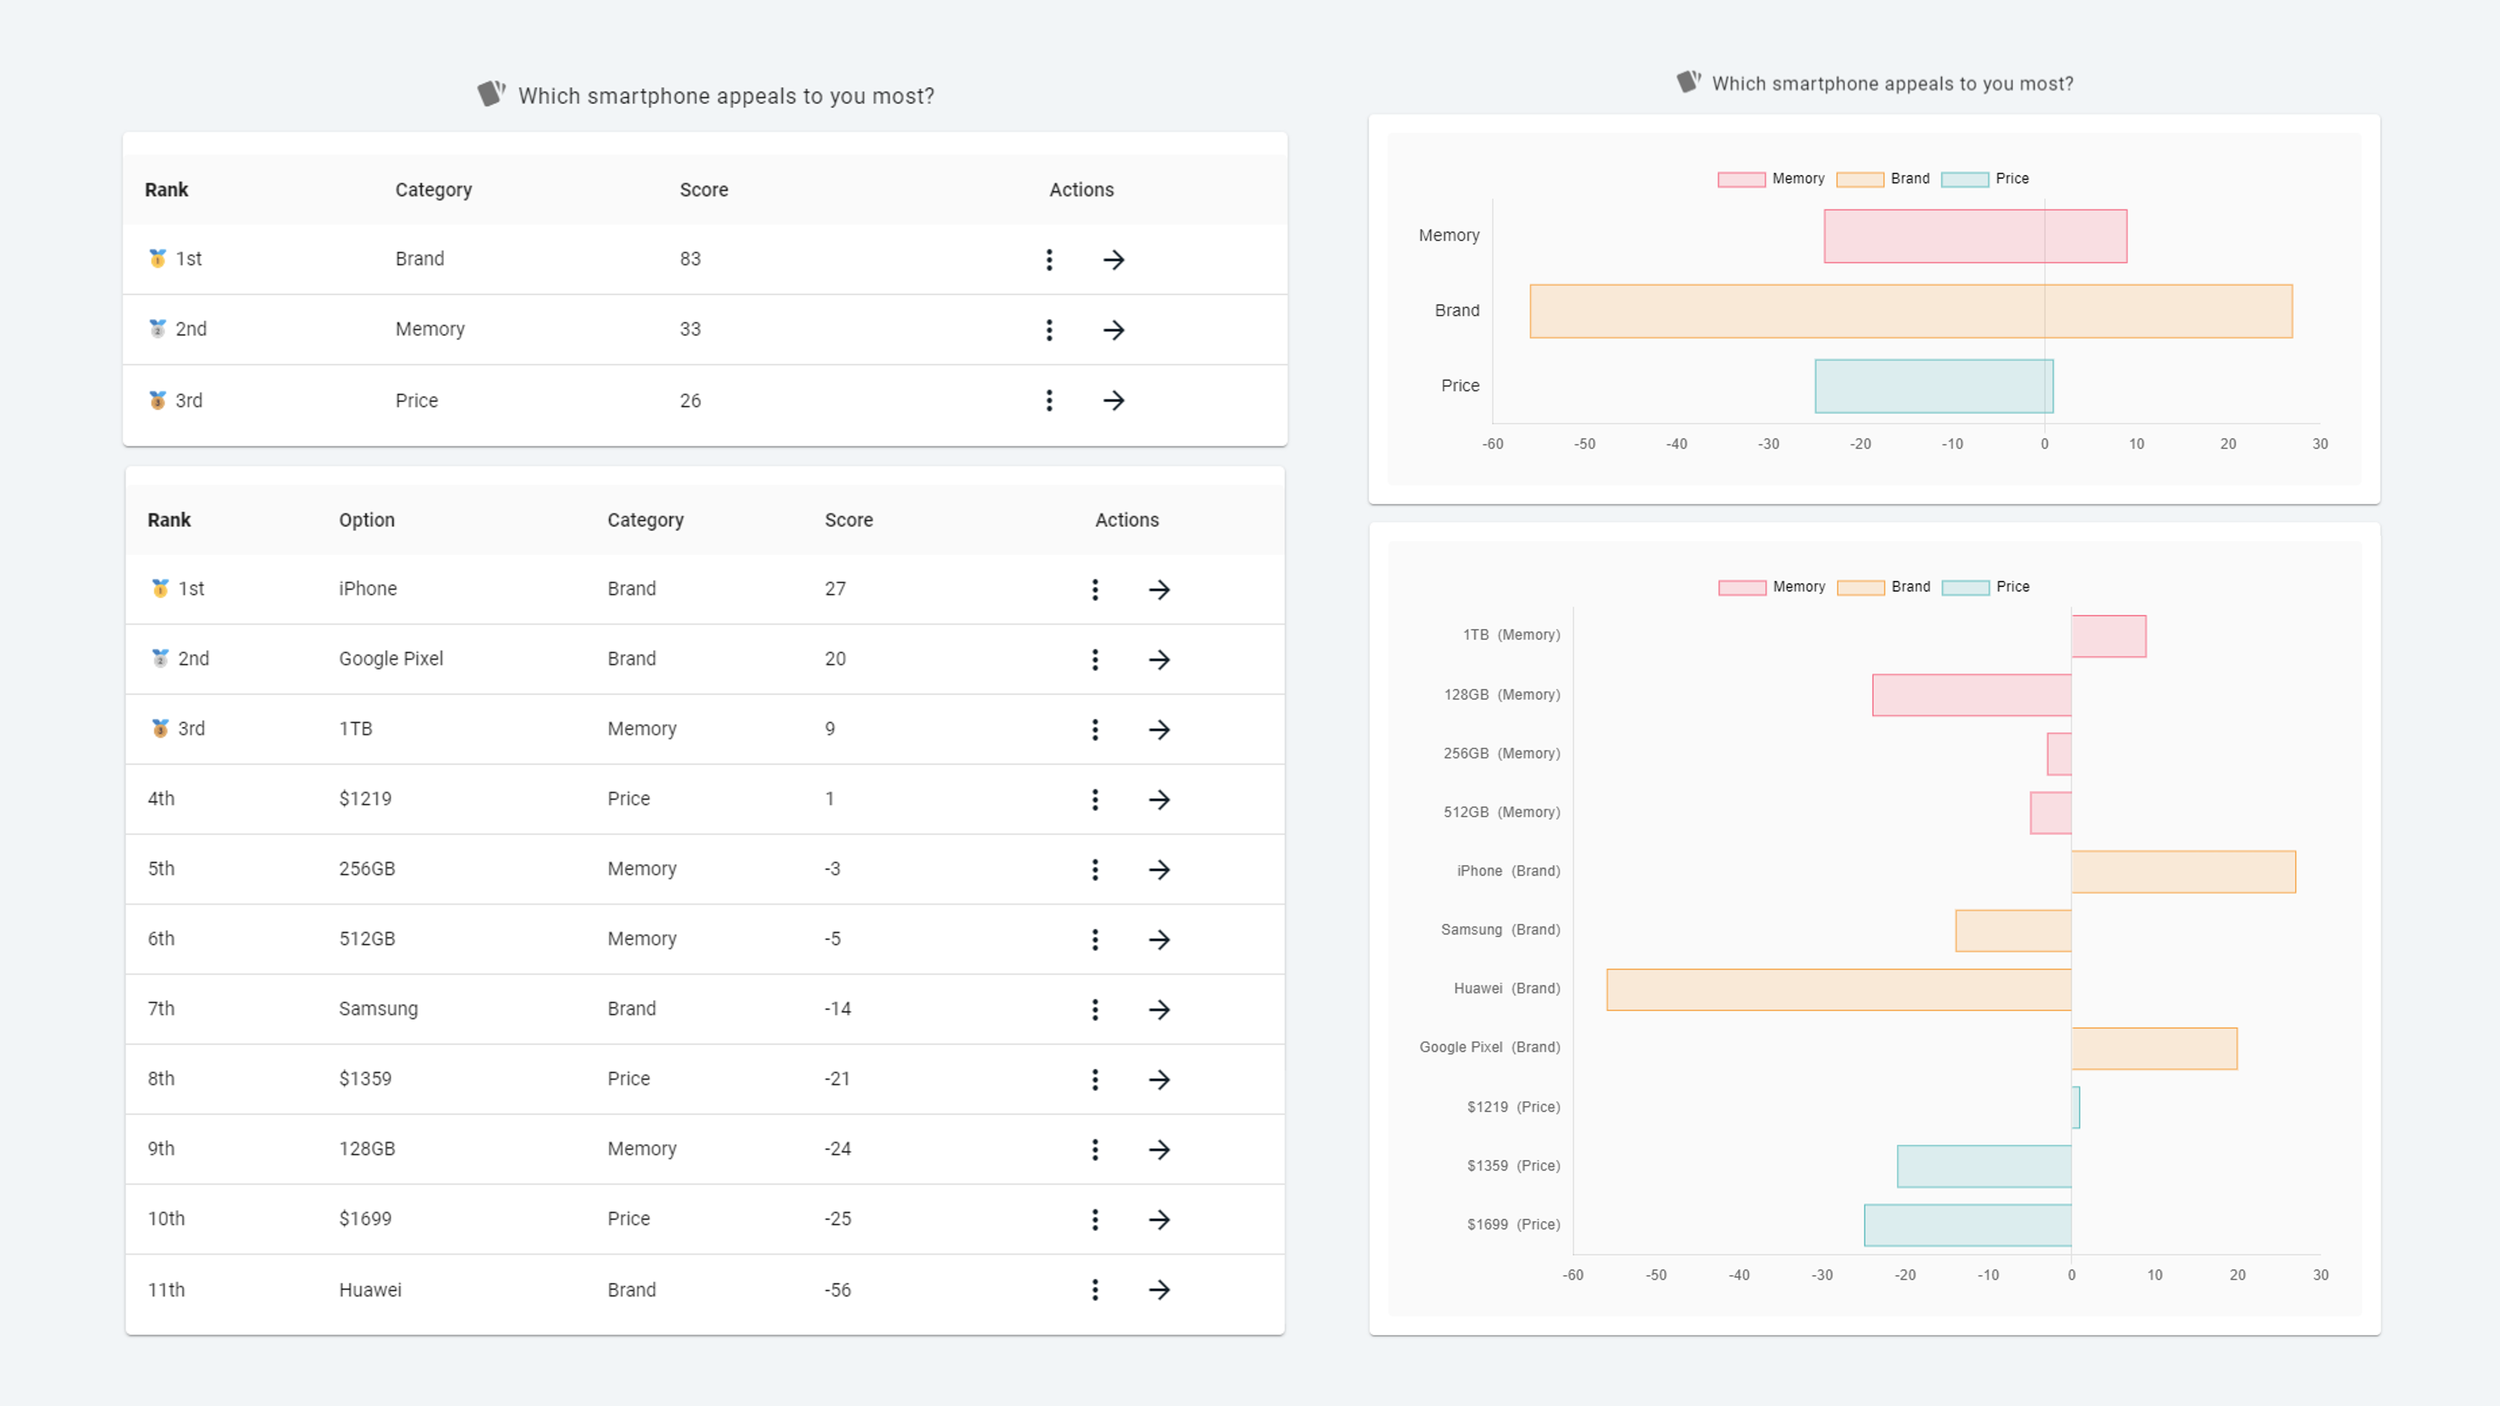
OpinionX automatically calculates your conjoint analysis results and presents them in multiple formats. You can view the utility scores in a simple data table or as a visual bar chart, like this:

You can use the Scenario Simulator to simulate how the market would react to different competing products. For example, you can create three products and see how much market share each would get, along with how much revenue each would generate. This is all done automatically on OpinionX based on your conjoint results:
Another advanced report format on OpinionX is the Marginal Willingness To Pay chart. This lets you quantify how much more a customer is willing to pay to unlock a specific feature upgrade. This is all calculated automatically for you by OpinionX based on your survey results. For instance, you can see how much someone is willing to pay to upgrade from a 128GB iPhone to a 256GB model:


^ Representation of how Prohibited Pairs works on OpinionX
Exclusions Engine
Conjoint analysis works by showing participants random combinations of product features and asking them to choose the most appealing one. But not every combination makes sense…
If you know for sure that some options should not appear on the same profile -- like a $0/month pricing plan paired with a dedicated account manager for customer support -- use OpinionX’s Profile Logic to create rules that prevent these illogical options from being shown together.
iii. OpinionX’s Pricing Plans for Conjoint Analysis
OpinionX is the most affordable conjoint analysis software on the market. Unlike most other tools that charge thousands just to unlock conjoint analysis, OpinionX lets you create conjoint surveys for free with needing to take out your credit card.
Ask Tier 🆓
Price: $0. Completely Free.
Functionality:
• Create an unlimited number of conjoint analysis surveys.
• View full survey results for up to 10 participants.
• All question types unlocked, including Conjoint and MaxDiff, which you can add as a flexible component anywhere in your survey.
Enrich your results with data from your CRM or external spreadsheet.
Automatic calculation of conjoint analysis utility scores and advanced automated chart types like Market Share Simulator, Marginal Willingness To Pay, Ranked Concepts, and Rejection Rate.
Summary: OpinionX’s Ask tier stands out by unlocking full conjoint design and analysis for free, letting you run real conjoint surveys and validate your approach before paying to scale.
Analyze Tier 🪙
Price: $900/year for unlimited conjoint surveys with up to 1,000 participants per survey.
Functionality:
Everything in the Ask tier.
Unlimited conjoint studies and analysis with up to 1,000 participants.
Summary: The Analyze plan unlocks OpinionX’s deeper analytics features for more complex research. You can preview these features with your first 10 responses, even on the free plan.
Accelerate Tier 💰
Price: Custom pricing based on requirements
Functionality:
• Unlimited conjoint participants.
• Dedicated consulting hours to help with survey design and analysis.
• Enterprise-grade security like 2FA and SAML SSO.
Summary: Ideal for larger teams with strict requirements around styling, support, and security.
You can view a full comparison of OpinionX plans here.

OpinionX Summary
🟢 Price: Run unlimited conjoint surveys for free with up to 10 participants, with all analysis features included. Increase your limit to 1000 participants per survey on the Analyze plan for $900/year, or upgrade to Accelerate for full enterprise scale, security, and support.
🟢 Trial: Yes! Conjoint is on OpinionX’s free tier and you can test premium analysis features before upgrading.
🟢 Conclusion: Unlike other conjoint analysis software tools, OpinionX doesn’t treat conjoint as a gated enterprise feature -- it treats it like a normal survey method that anyone should be able to understand and use in their own research.
If you’re looking for a conjoint analysis tool that’s simple, affordable, and flexible, then OpinionX is a great place to start. Read more about how to create conjoint analysis surveys on OpinionX or join 36,000+ other researchers and create a conjoint survey today:
— — —

2. SurveyMonkey
You’ll see conjoint analysis listed on SurveyMonkey’s website, but don’t be fooled -- SurveyMonkey does not have a conjoint analysis survey tool.
Instead, conjoint is offered only as a custom market research service. That means you can’t create a conjoint survey yourself, even on their most expensive plan. You have to submit a request and a SurveyMonkey researcher will build it for you manually.
Worse still, their conjoint studies can’t be combined with other question types. The researcher-built conjoint is a standalone project, not an actual survey you can modify, customize, or integrate with your other research questions — making it extremely limited for research purposes.
🔴 Price: $25,000 Enterprise Tier + additional fee per conjoint project (no pricing transparency).
🔴 Trial: No, conjoint analysis is not available on SurveyMonkey’s free tier.
🔴 Conclusion: Avoid! The only reason researchers use SurveyMonkey for conjoint analysis is because their company already has an enterprise agreement in place. Nobody chooses SurveyMonkey because of its conjoint capabilities because it doesn’t really have any.
— — —
3. Qualtrics DesignXM
Qualtrics advertises DesignXM as a premium market research platform, but when it comes to conjoint analysis, it’s both shockingly expensive and functionally underwhelming.
You’ll pay a minimum of $13,040 just to get started -- that’s $5,040/year for one seat on Qualtrics’ lowest-priced plan ‘Strategic Research,’ plus an extra $8,000 to unlock their conjoint analysis add-on. Even then, that price only covers 1,000 participants total, after which it’s an additional $1 per response.
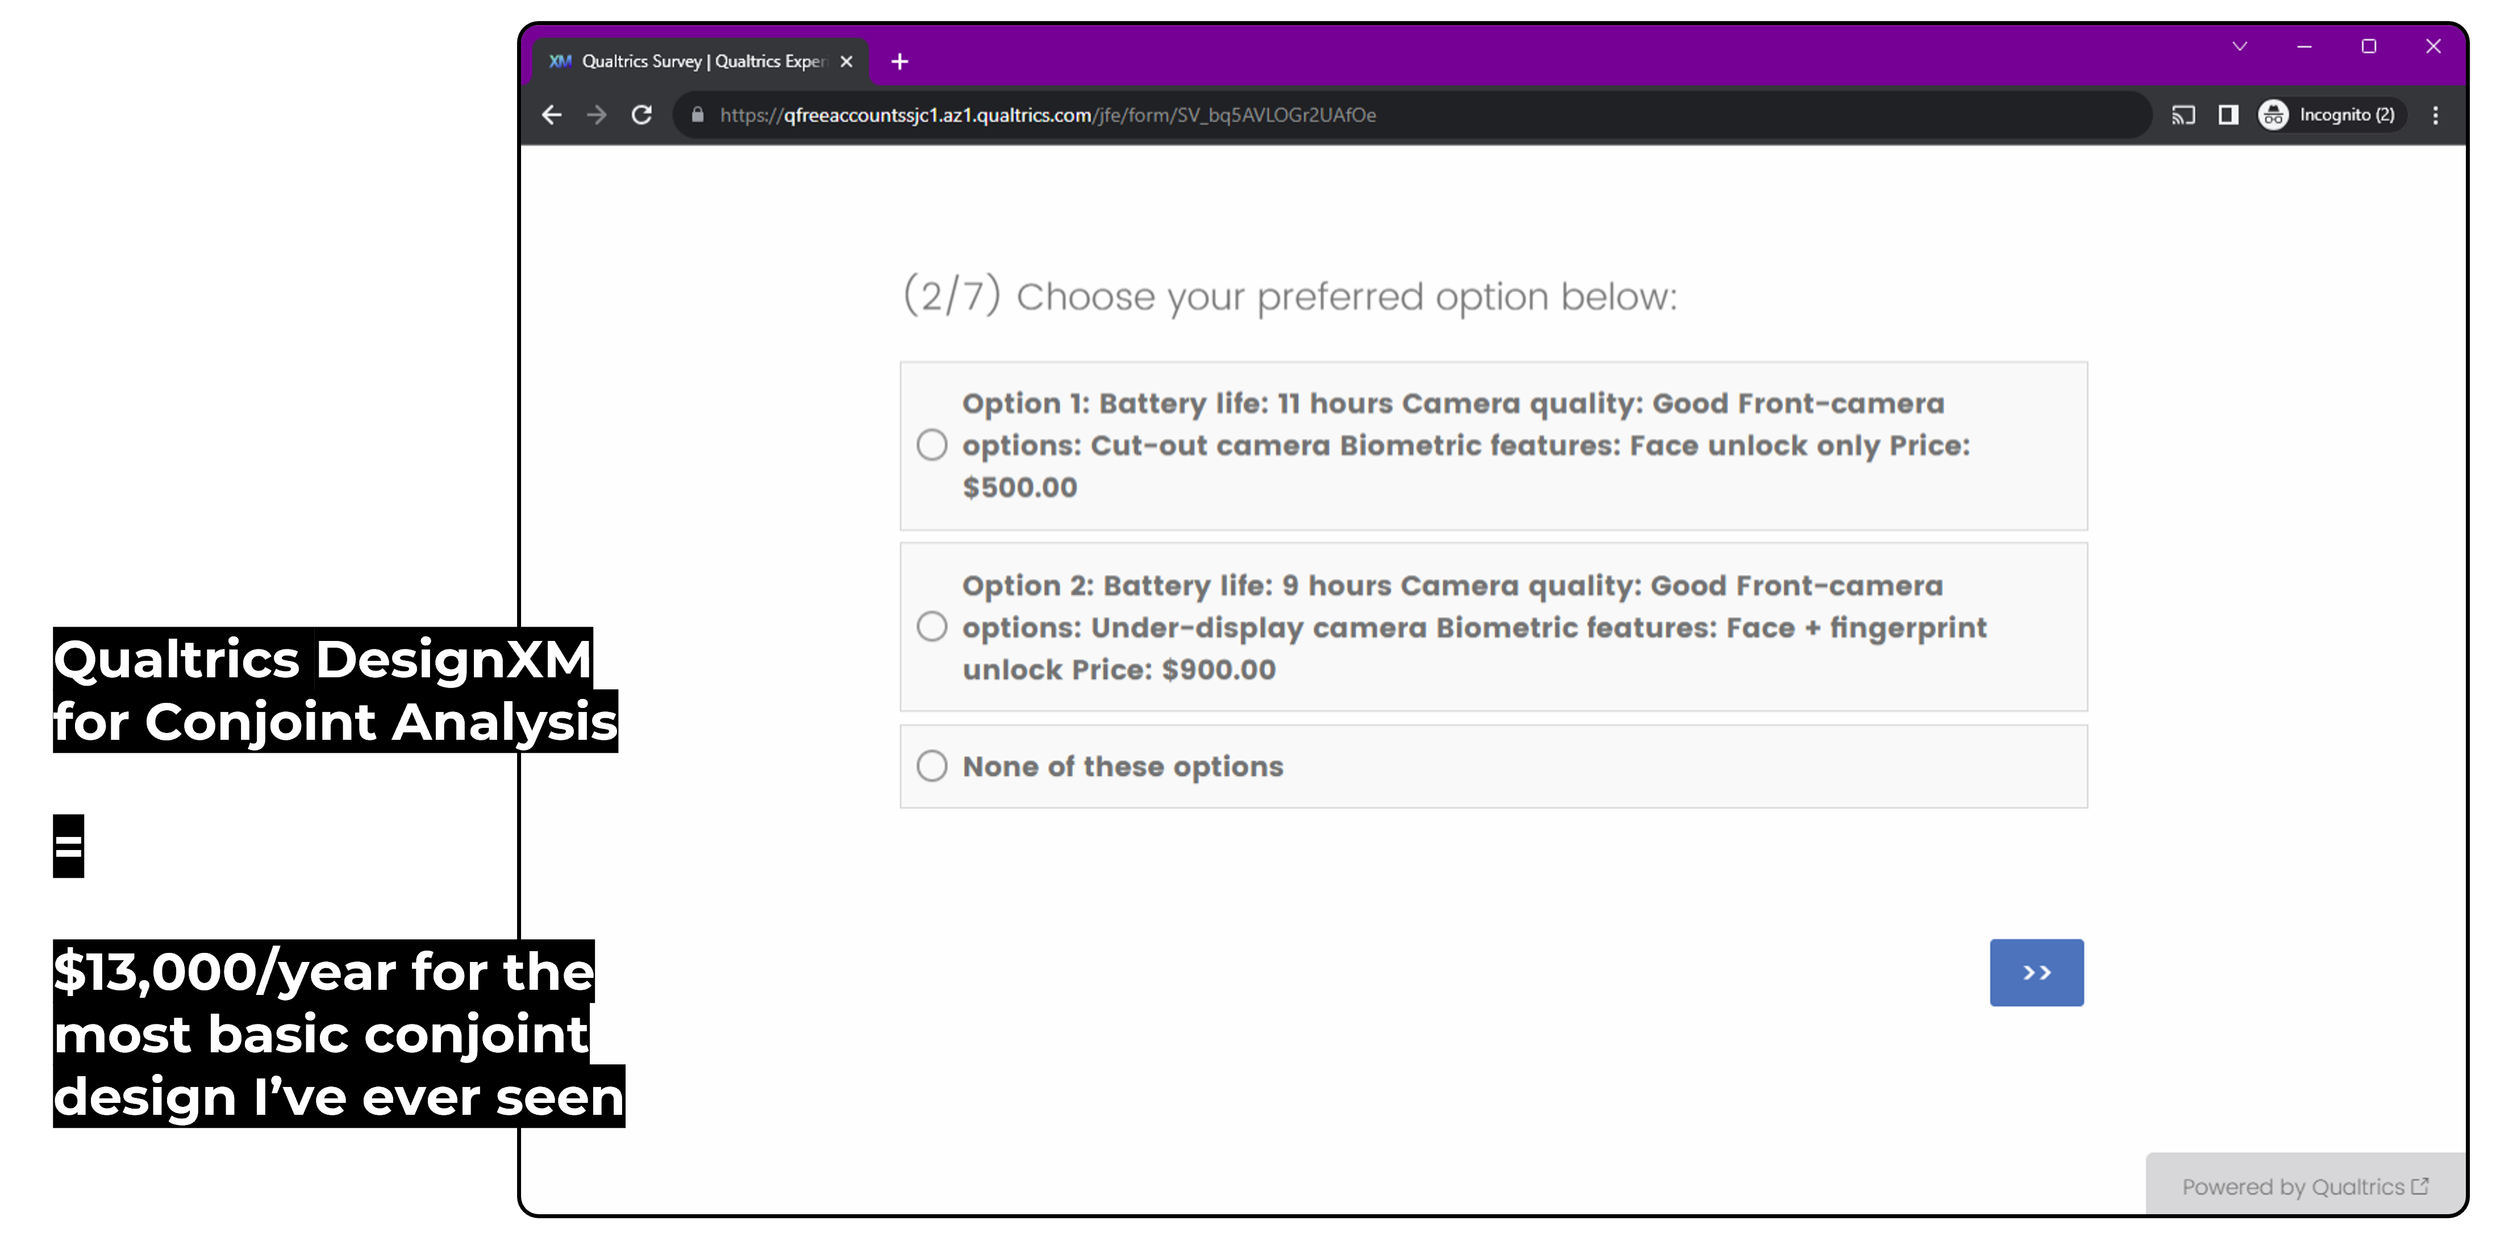
After months of salesperson demos, pricing discussions, and contract negotiations, what you finally get is a barebones conjoint tool that feels like it was built in 2009 and hasn’t been updated since. See for yourself, the screenshot below shows what a conjoint analysis survey on Qualtrics looks like:
🔴 Price: $13,040 total + $1/respondent.
🔴 Trial: No, conjoint analysis is not available on the Qualtrics free plan and can only be tested by going through 3-5 fun rounds of negotiation with a salesperson.
🔴 Conclusion: Avoid! Imagine paying over $13,000 to buy Qualtrics’ conjoint analysis software only to receive the screenshot above, which barely even qualifies as a conjoint survey? Hard pass.
— — —

4. 1000minds
1000minds is a decision-making platform tailored for health economics, public policy, and academic research. It was launched in 2002 and is best known for its patented PAPRIKA algorithm, which offers an alternative to the standard models like Hierarchical Bayes or Linear Regression that are used in most other conjoint analysis platforms.
🔴 Price: $25,000/year tied to a specific project or use case (not for organization-wide access).
🟢 Trial: 1000minds offers a 15-day free trial with access to its core features.
🟠 Conclusion: If you're a specialist academic researcher or policymaker needing rigorous, algorithm-driven analysis for a narrow use case, 1000minds is a highly specialized and well-respected tool. For everyday commercial conjoint research, its pricing and structure can be overkill.
— — —
5. Quantilope
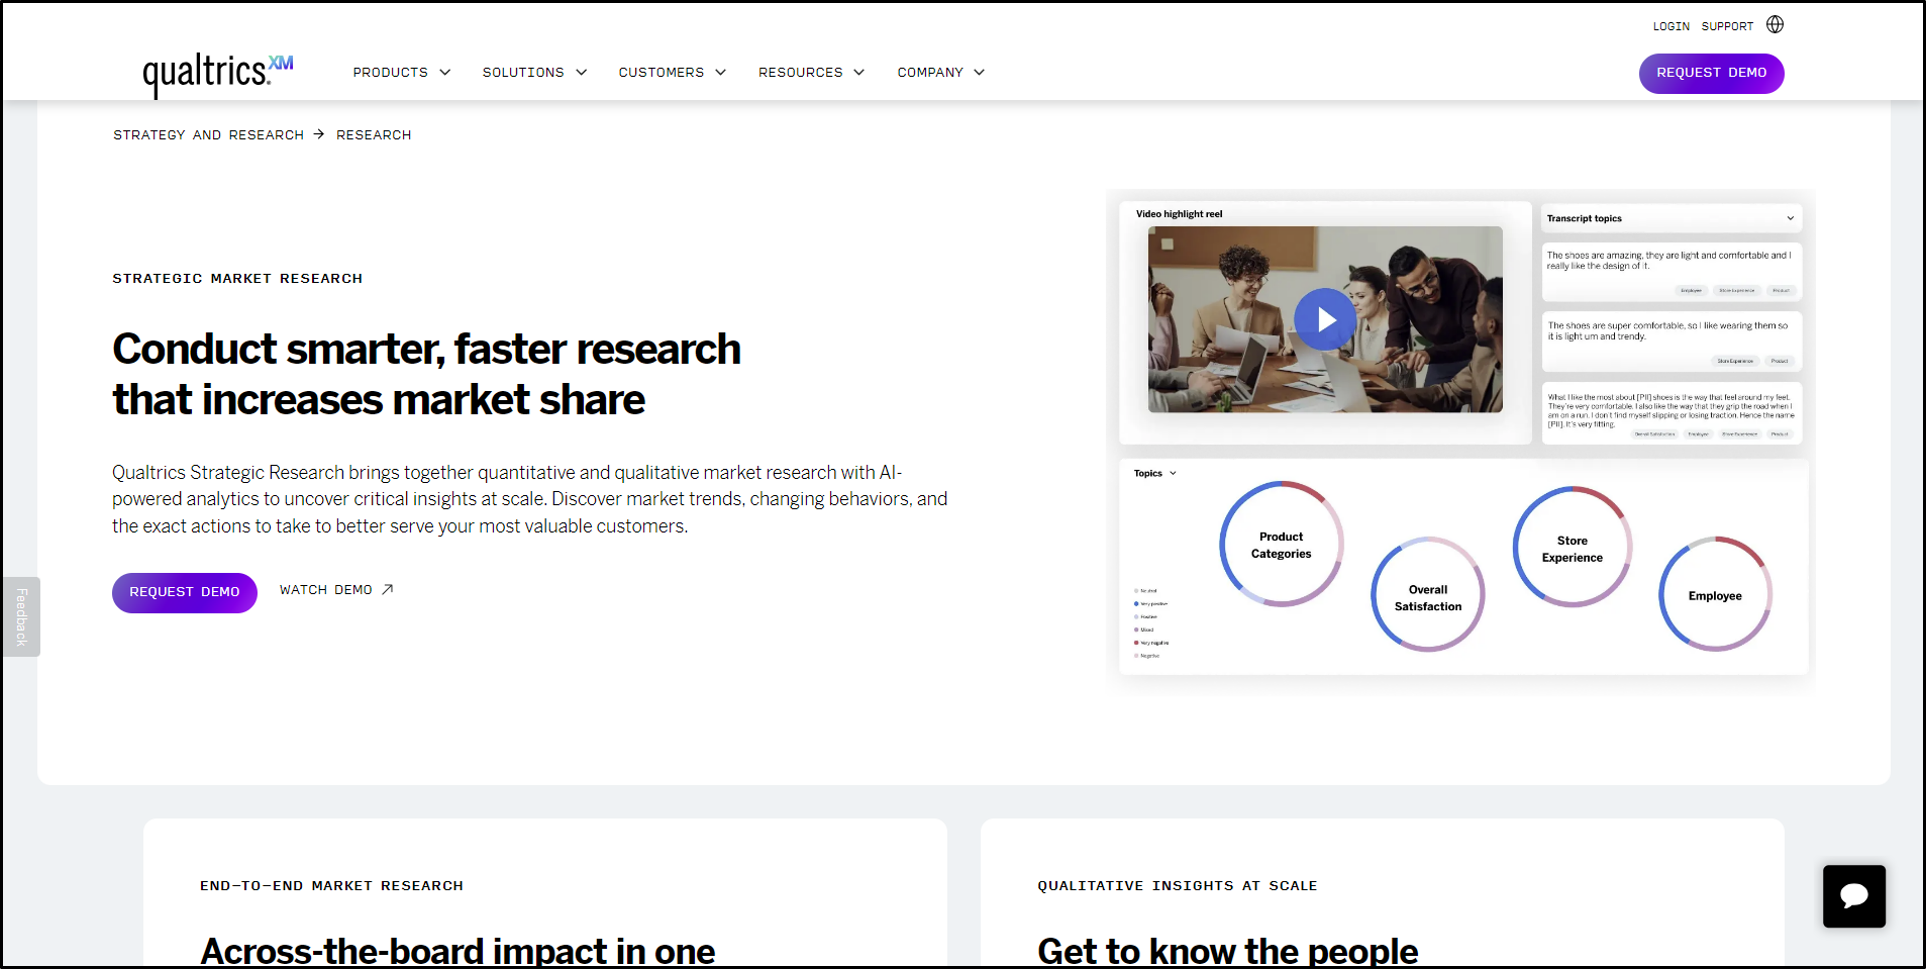
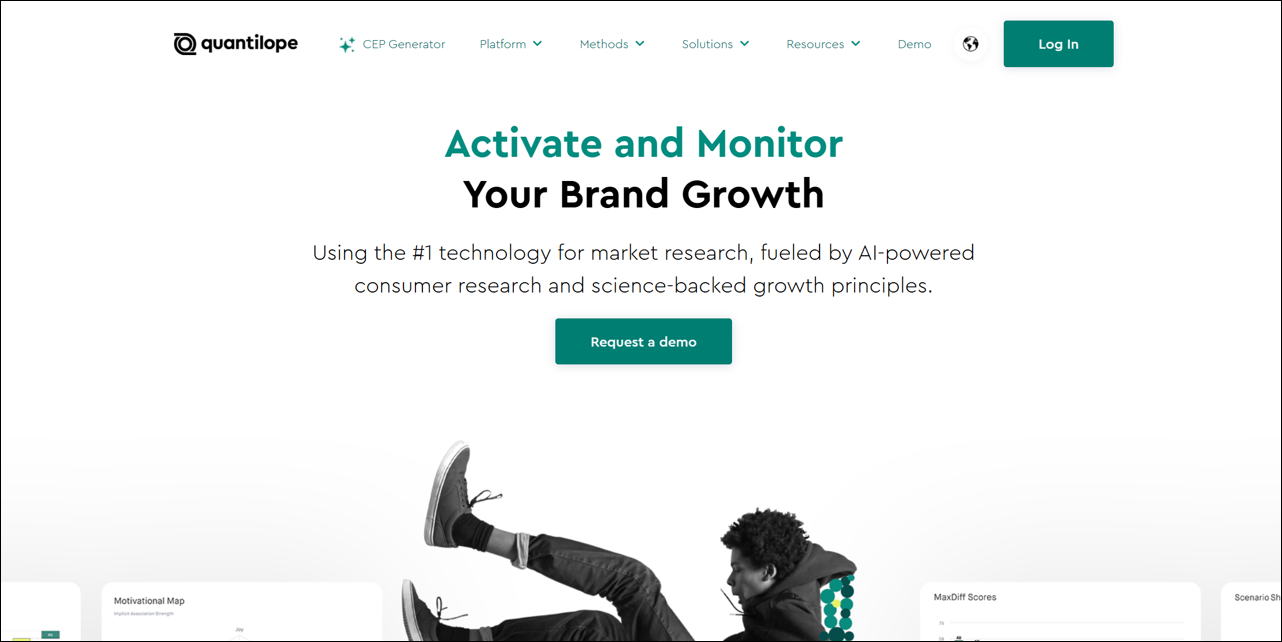
Quantilope is a consumer intelligence platform for large enterprises. It offers a broad suite of advanced research methods, including choice-based conjoint surveys, with real-time automated analysis and an AI co-pilot called Quinn that helps with study design, charting, and reporting. The tradeoff is price and positioning. Quantilope is firmly aimed at enterprise-level insights teams and mid-to-large consumer brands, not individual researchers or small product teams.
🔴 Price: Cheapest Quantilope entry plan is around $22,000/year for just 3 users.
🔴 Trial: No free tier or self-serve trial, and access requires a sales demo and contract.
🟠 Conclusion: Quantilope is a strong choice for large enterprise insights teams replacing expensive agency-led research with a “done for you” software partner, but for smaller teams, independent researchers, or anyone running occasional conjoint studies, the entry price makes it hard to justify. OpinionX remains the more accessible alternative at a fraction of the cost and with a free tier for testing it out first.
— — —

6. Pollfish
Pollfish stands out from other survey platforms by offering access to a massive integrated panel of over 250 million respondents across 160 countries. This makes it a powerful option for researchers looking to recruit survey participants quickly, particularly for international studies.
However, if you're specifically looking for conjoint analysis with panel recruitment, Pollfish will disappoint. Their conjoint functionality is locked behind the $30,000/year Elite Plan, designed primarily for large-scale research agencies.
🔴 Price: $30,000/year makes Pollfish the most expensive entry price on this list.
🔴 Trial: No free tier or premium trial for conjoint analysis
🔴 Conclusion: Unless you’re a large agency with enterprise-level needs, there’s no reason to pick Pollfish for conjoint analysis. Its main draw is the panel access, but even that can be sourced more affordably elsewhere, like through third-party panels on OpinionX.
— — —

7. QuestionPro
QuestionPro is an all-in-one survey platform that competes with tools like Qualtrics and SurveyMonkey, offering a broad feature set at a more affordable price point. However, its interface and structure can feel overwhelming due to the volume of functionality crammed into one platform with little consideration given to design or usability.
Conjoint analysis is only available on the top-tier “Research Suite” plan, which starts at $5000/year plus $1/respondent after the initial 5000 responses allocation has been used. There is no way to trial this premium plan or see QuestionPro’s conjoint analysis software in action without engaging their sales team.
🟠 Price: $5000/year plus $1/respondent
🔴 Trial: No premium trial or free plan; conjoint is only available on the highest paid plan.
🟠 Conclusion: Cheaper full-suite survey platform than SurveyMonkey or Qualtrics but still considerably higher than OpinionX.
— — —

8. SPSS
SPSS, first released in 1968 and acquired by IBM in 2009, is a legacy statistical analysis tool still widely used in academia and government. SPSS technically has more customers than SurveyMonkey or Qualtrics but its role is typically statistical analysis, not survey delivery. Conjoint analysis is available only on the top-tier “Premium” plan, which costs a staggering $23,800 per user for a perpetual license.
🔴 Price: $23,800/user (perpetual license only).
🔴 Trial: No premium trial or free tier includes conjoint analysis.
🔴 Conclusion: Aimed at legacy enterprises and academic institutions, SPSS has become increasingly irrelevant for modern survey research. Its outdated interface, steep learning curve, and lack of cloud functionality make it a poor fit for teams looking for flexible, scalable conjoint tools.
— — —

9. Sawtooth Software
Sawtooth Software pioneered digital conjoint analysis surveys in the 1990s and has been a major player in the market research space for over 30 years. They offer deep expertise in both traditional and digital conjoint research, along with webinars and training programs for market researchers looking to upskill.
Sawtooth Software provides two products for conjoint analysis: Lighthouse Studio and Sawtooth Discover. Lighthouse Studio is a powerful Windows desktop application, starting at $10,900/year. It’s considered the most advanced discrete choice modeling software available, supporting complex designs such as Menu-Based Choice (MBC), Adaptive Choice-Based Conjoint (ACBC), and more. Sawtooth Discover is their cloud-based, easier-to-use platform designed for most standard choice-based conjoint and MaxDiff studies. It costs $4,500 per user per year and includes a free trial that lets you run a survey with up to 50 participants before upgrading to the premium plan.
🟠 Price: $4500/user/year for Sawtooth Discover.
🟢 Trial: Free for your first 50 participants, upgrade to unlock full results.
🟢 Conclusion: Sawtooth Discover is an ideal platform for market researchers conducting consumer research via choice-based conjoint, adaptive conjoint, and other discrete choice models. While it's priced significantly higher than OpinionX, it offers robust functionality without the complexity of Sawtooth’s more advanced Lighthouse Studio product.
— — —

10. Alchemer
Alchemer (formerly SurveyGizmo) positions itself as a cost-effective, general-purpose alternative to tools like SurveyMonkey and Qualtrics, designed mainly for small teams who want a simpler full-suite survey tool.
🟠 Price: $9,900/year with a maximum of 3 researcher seats
🟠 Trial: 7-day free trial, no free plan available.
🔴 Conclusion: While competitively priced for a full-featured survey tool, Alchemer falls short for serious conjoint research as it lacks essential features like prohibited pairing logic, a market simulator, segmentation analysis, and a marginal willingness to pay report.
— — —
Final Summary
You should not be paying thousands of dollars for conjoint analysis software.
There is nothing in conjoint analysis that justifies 5-figure entry prices, especially without any free version to test out beforehand. Conjoint analysis is a simple survey format you can easily set up yourself. Save your team time and money by building your conjoint surveys for free on OpinionX.
| Platform | Free Tier / Trial | Premium Price | Summary | |
|---|---|---|---|---|
| OpinionX | OpinionX | ✅ Unlimited Conjoints with 10 free participants | $300/year for unlimited surveys and researcher seats | ⭐ Best free tier and lowest priced platform. Easy to use, fully featured for both conjoint research and general surveys. |
| SurveyMonkey | ||||
| SurveyMonkey | ❌ None | $25,000 + service fee per conjoint | No native conjoint support. Requires hiring a SurveyMonkey researcher to manually build your survey for an additional fee each time. | |
| Qualtrics | Qualtrics | ❌ None | $13,040/year | Conjoint survey UI is clunky and rigid. Unjustifiably high price for limited flexibility. |
| 1000minds | ||||
| 1000minds | 🟠 15-Day Trial | $25,000/year | Strong academic and public policy focus. Not ideal for general business use. | |
| Quantilope | Quantilope | ❌ None | $22,000/year | Focused on consumer intelligence research for large enterprise companies. |
| Pollfish | ||||
| Pollfish | ❌ None | $30,000/year | Largest integrated panel but prohibitively expensive. For large market research agencies. | |
| QuestionPro | QuestionPro | ❌ None | $5000/year + $1/participant | More affordable alternative to SurveyMonkey and Qualtrics, but with similar limitations. |
| SPSS | ||||
| SPSS | ❌ None | $23,800/user for perpetual license | Outdated interface. High learning curve. Requires heavy manual setup and lacks modern survey features. | |
| Sawtooth | Sawtooth | 🟠 Max 50 Participants | $4500/year per seat | Industry standard for alternative conjoints like ACBC and MBC. Unlikely to cover enough functionality to replace your main survey tool. |
| Alchemer | ||||
| Alchemer | 🟠 7-Day Trial | $9900/year for up to three seats | Budget-friendly but lacks key features like a simulator, segmentation tools, or MWTP reports. | |
OpinionX is the number one tool for conjoint analysis software. It has the best price, a flexible full-featured survey builder, and a comprehensive range of advanced conjoint analysis functionality:
✅ Market share simulator
✅ Prohibited pairing logic
✅ Marginal willingness to pay report
✅ Segmentation and clustering analysis
Learn more about how conjoint analysis survey setup works on OpinionX, or jump right in and create a free conjoint analysis survey in minutes.
— — —
Further Reading About Conjoint Analysis:
• Ultimate Guide to Conjoint Analysis (Explanation, Types, Tools, Examples)
• 8 alternatives to conjoint analysis for choice-based comparison research
• 5 criteria for assessing whether conjoint analysis suits your research scenario
• 10 examples of research scenarios that should NOT use conjoint analysis
• 13 types of conjoint analysis explained (with picture examples)
• How to calculate conjoint analysis results in 8 Steps [Advanced]
About The Author:
Daniel Kyne is the Co-Founder of OpinionX, a free research tool for stack ranking people’s priorities — used by thousands of product teams to better understand what matters most to their customers. OpinionX has a bunch of free research methods for ranking people’s preferences — including Conjoint Analysis and other ranking methods like Pairwise Comparison and Points-Based Voting.
→ Create a FREE Conjoint Analysis Survey now
Subscribe to The Full-Stack Researcher newsletter where we share research strategies for founders and product teams: