
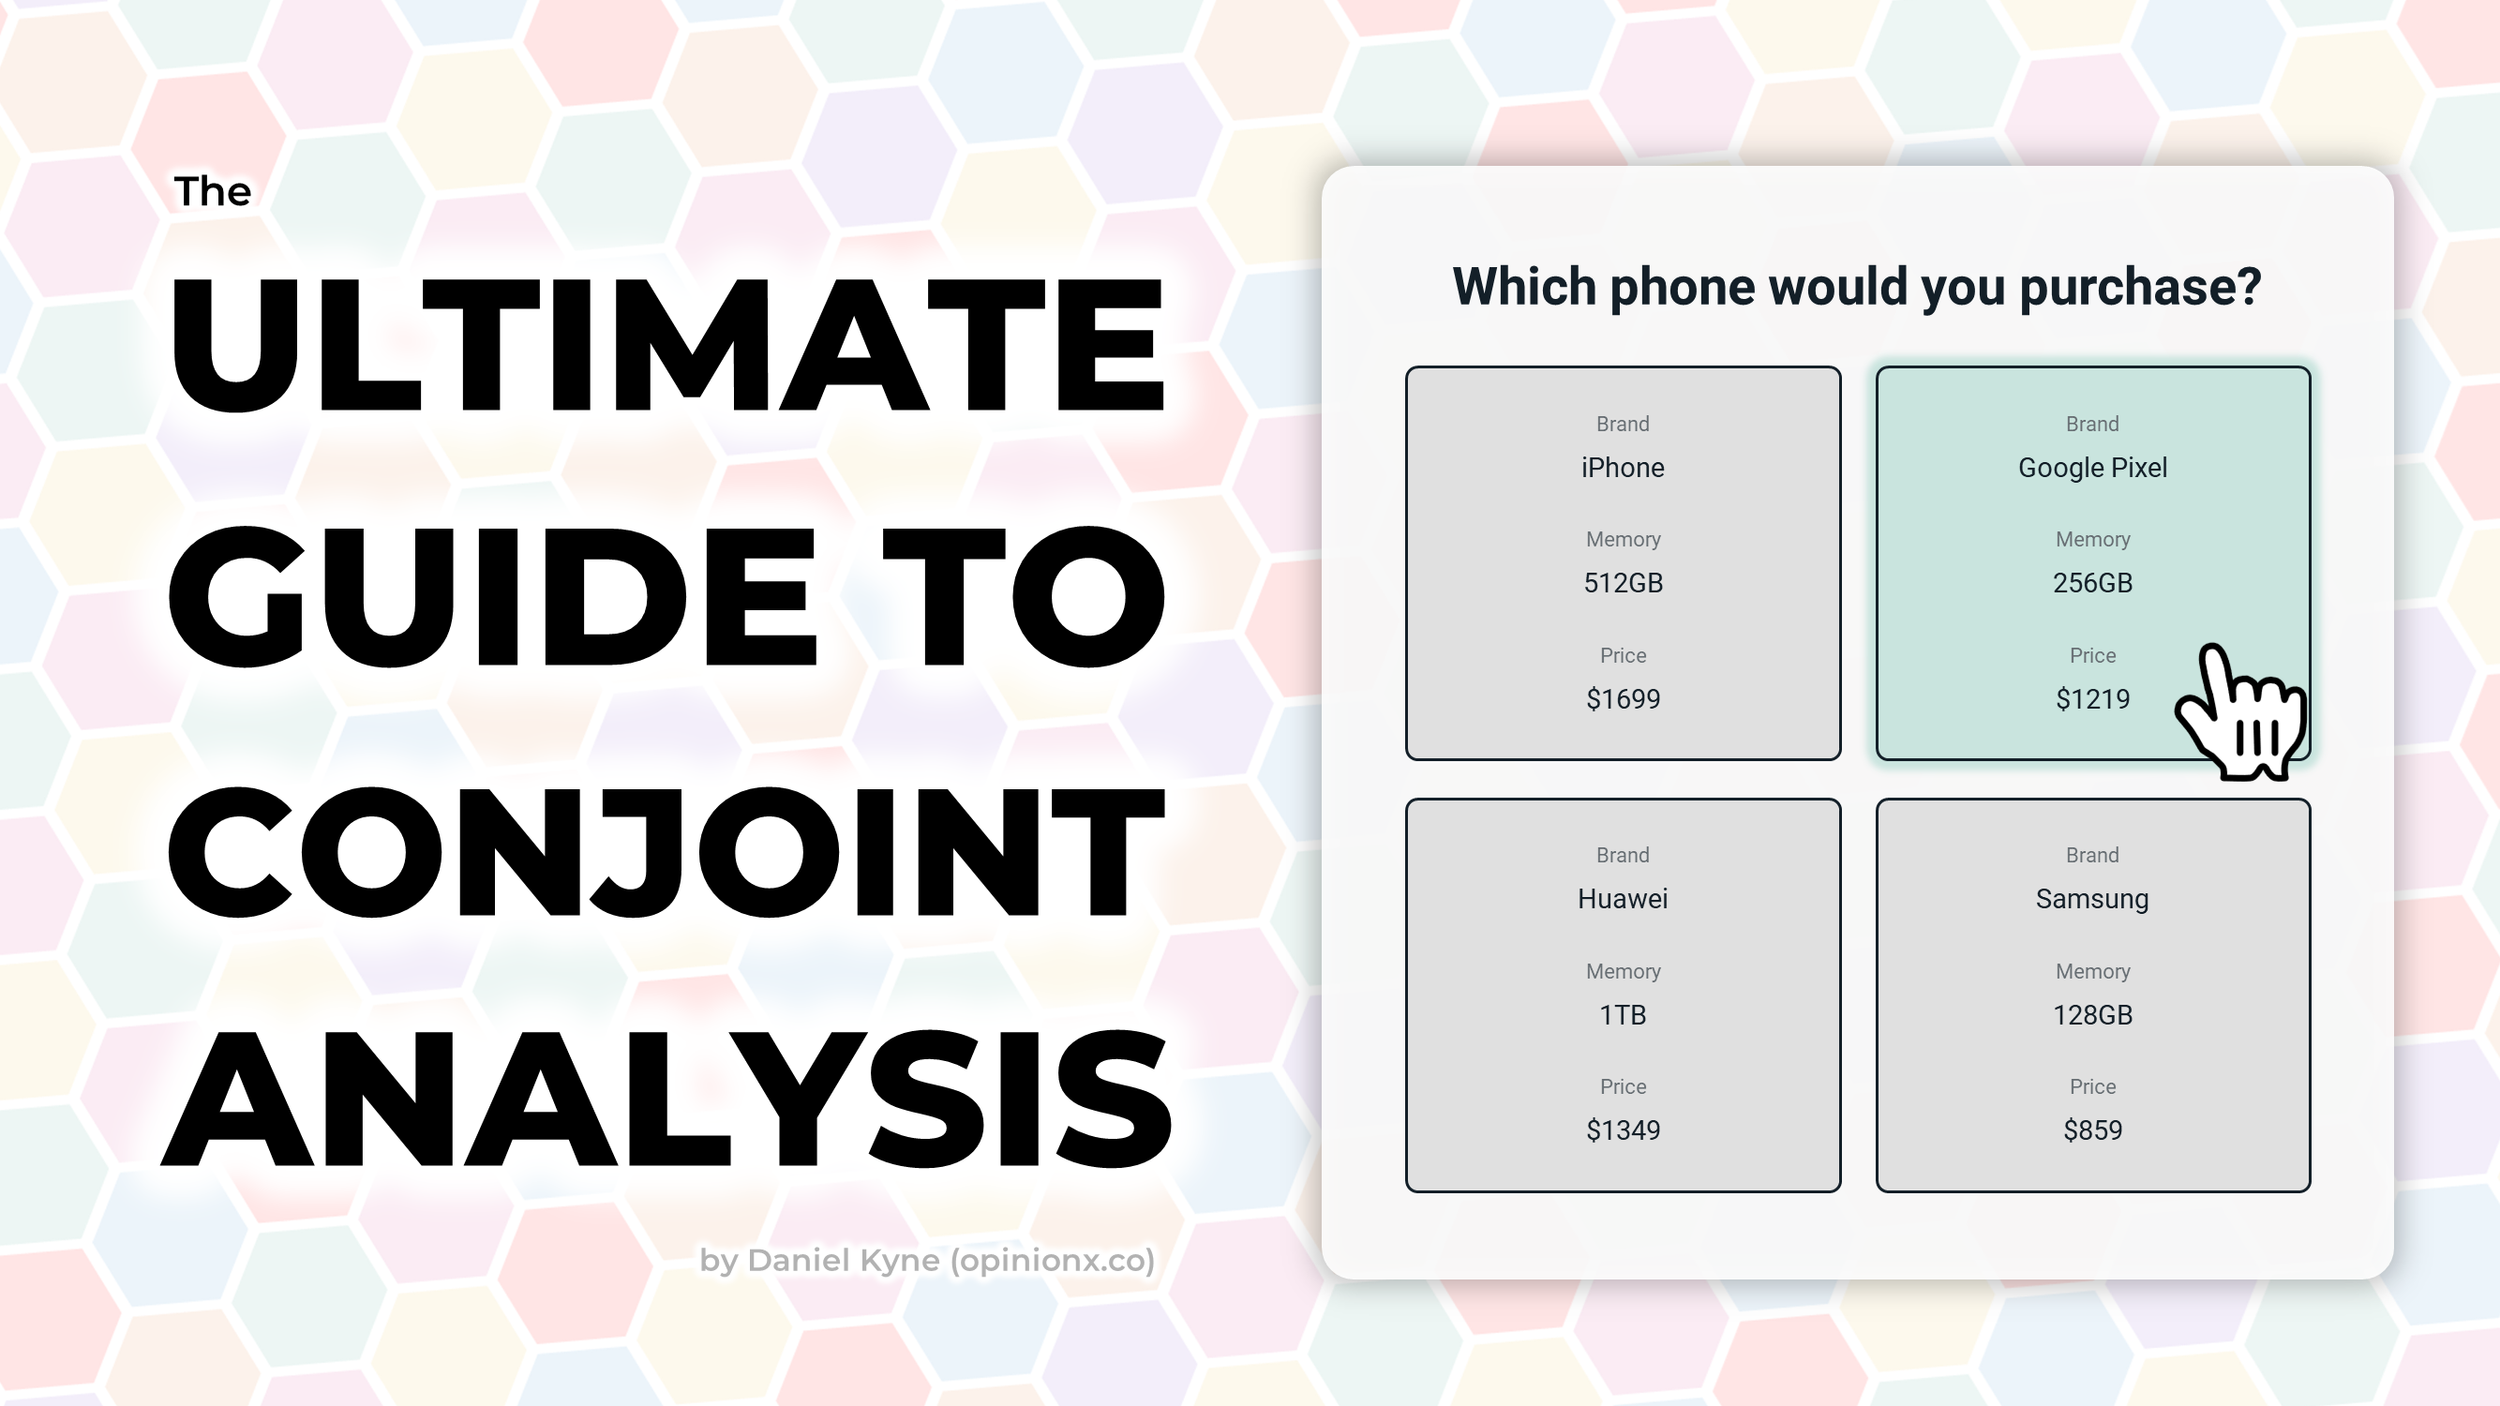
The Ultimate Guide to Conjoint Analysis: Explanation, Examples, Types, Tools, & Use Cases
Conjoint analysis is a popular research method for understanding what’s most important to customers when they’re picking between products during a purchase decision.
People tend to call conjoint analysis an “advanced” research method — this blog post aims to prove that this claim is not true. Anyone able to use Google Forms can successfully run a conjoint survey. After reading this blog post, you’ll be ready to independently design and launch your own conjoint analysis study!
Here’s what I cover in this blog post:
Ok, let’s jump in!
What is Conjoint Analysis?
Conjoint analysis is a type of survey that measures how important customers think different attributes (like price, brand, or features) are when comparing products in a purchase decision.
A conjoint survey shows two or more “profiles” that represent variations of the same product. Each profile contains the same list of attribute categories, but the options shown for those categories vary on each profile. When a respondent picks the profile they like most, their vote is recorded and a new set of profiles are shown.
⬆️ interactive demo (via OpinionX) ⬆️
These votes are used to calculate the importance of each attribute category (like whether price or brand are more important when choosing a soda) as well as for ranking the list of options within each category (like whether people are more likely to pick Coca-Cola or Pepsi).
Every conjoint survey is made up of four components:
Question → Gives the respondent context about the product decision they are simulating.
Profile → A complete set of attribute values that make up a potential product offering.
Attributes → The characteristics relevant to a customer’s purchase decision (aka “categories”).
Levels → The range of values or possibilities you include within each attribute (aka “options”).

In this blog post, I tend to refer to “attributes” as categories and “levels” as options, as these terms are easier to understand and make conjoint analysis a little more accessible to learn :)
— — —
Conjoint Analysis Survey Example
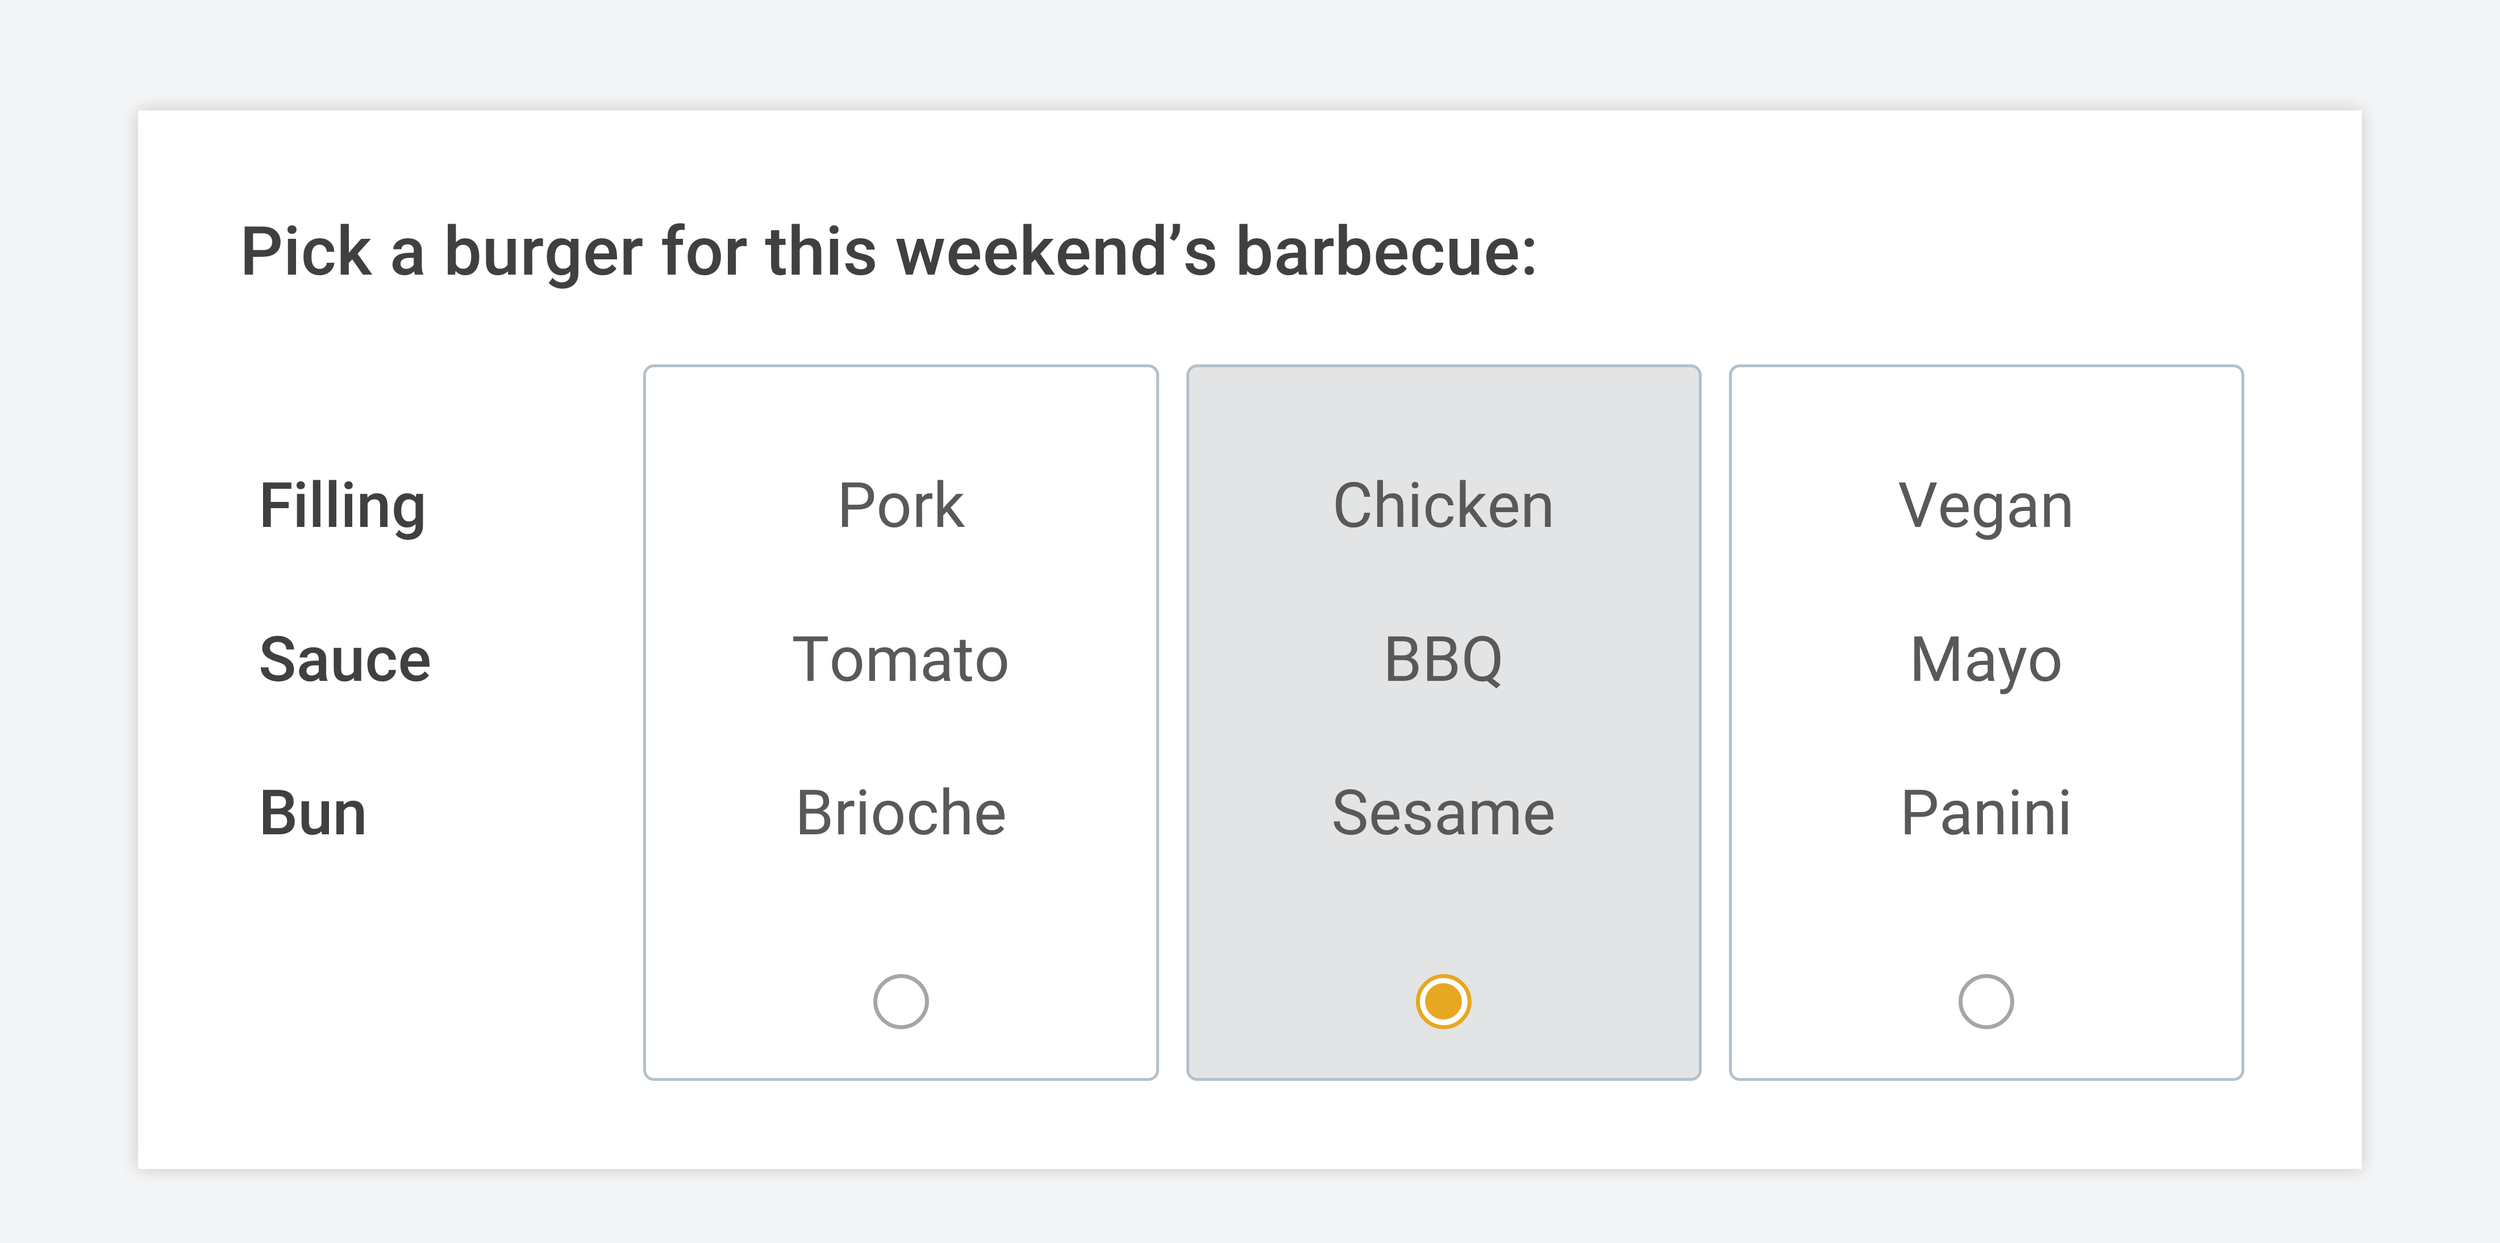
You’re running a conjoint survey to decide what burger to prepare for your weekend barbecue. You have three categories — filling, sauce, and bun type. Each category has four potential options — for example, the burger filling could be pork, chicken, vegan, or beef.
Running a conjoint analysis for our barbecue can help us figure out (1) within the overall burger, which categories are most important to people, like is the choice of filling more important than the sauce or the sauce more important than the bun type? and (2) within each category, which options have the highest relative importance to people, like for the filling, will people be more interested in eating our burgers if we switch the pork filling to a chicken, beef or vegan patty instead?

Example conjoint analysis results, showing relative Importance of categories/attributes (left) and options/levels (right)
Our example results show that (1) when people make decisions about which burger they want, 50% of their decision is based on the filling, whereas the bun type only accounted for 10% of people’s preferences, and (2) beef and chicken were the two most popular fillings.
— — —
How to Design Your Own Conjoint Analysis Survey
The best way to explain how to design a conjoint analysis survey is to use real screenshots and examples. In this blog post, I’ll be using OpinionX as my survey tool because it offers unlimited conjoint analysis surveys with no participant limits for free.
Setting up a Conjoint Analysis survey on OpinionX is very easy and has been designed so that anyone, regardless of research experience, will be able to successfully get their project started. When you create your OpinionX survey, you’ll be asked to pick your first survey “block” (aka question or survey step). Conjoint analysis on OpinionX is known as the “Profile Rank” block:

Once your Profile Rank block has loaded, you’ll see three different text input options: (i) question, (ii) category, and (iii) option. Here’s what each of these text fields look like on the final survey:

Note that on OpinionX, we use some slightly different terminology to how academics describe conjoint analysis to try make it easier for people to understand how conjoint analysis works. We call conjoint attributes “categories”, attribute levels are called “options”, and part-worth utilities are simply called “scores”. We believe that the terms we chose are more accessible and therefore will help to open conjoint analysis as a more usable research method for a greater number of people. Feel free to use whichever terminology you’re more comfortable with, if you contact us for help with your survey, we will understand what you mean either way :)
After adding your list of categories and options, you’ll want to customize your Profile Rank block’s configuration. There are three important ways you can do this:

A. Profiles per Set → How many profiles do you want to show at the same time when participants are voting? In the airline example from the screenshot, you can see that there are three profiles on screen. You can set this number to whatever you’d like, however it is recommended to pick a number between 2 and 6 (the more complex your categories/options, the lower this number should be). Note that this is set to a default of 2 for all users and can only be customized by customers on OpinionX’s Analyze pricing plan or higher.
B. Sets per Participant → How many times do you want each participant to vote? In the airline example, I’ve put the Sets per Participant to 8, meaning that participants will need to select their preferred “ticket” eight times before they can proceed to the next part of the survey. You can set any number you want here, regardless of whether you’re on the free version or a paid plan.
C. Skip Button → I personally like using forced voting for my conjoint surveys by removing the ‘Skip’ button, however you can leave the skip button there if you want to avoid forcing participants to select profiles that they don’t actually like.
Once you’ve got your Profile Rank block ready to go, it’s time to add any other questions to your survey that you want participants to answer. You can add as many other questions to your survey as you’d like by clicking the “+ Add Block” button that floats alongside the top-right corner of the block you’re currently editing. All question types are available for free on OpinionX.

The three most common question types that get added to conjoint analysis surveys are:
i. Email Identify → Using OpinionX’s Identify block type, they collect participants’ emails (or name, username, ID number, etc.) so that they know who has participated so far and to prevent duplicate respondents.
ii. Multiple Choice → If you want to filter and compare segments of participants later on (eg. to see the differences between high schoolers vs university students or Americans vs Europeans), the easiest way to do this is to include Multiple Choice questions in your survey that allow participants to self select which segments they belong to. Then when it comes to analysis, you’ll be able to filter and compare these groups in literally one click.
iii. Text Response → Want to understand why people voted the way they did or whether your conjoint was missing any important categories/options that are important to people’s purchase decisions? Including a Text Response block to allow people to add new questions is the best way to identify gaps in your current knowledge about the topic you’re researching.
If in doubt about how to set up your other survey questions OpinionX, I recommend checking out this 90-second Getting Started video that shows exactly how to create and launch your survey. Once you’re ready to share your survey with participants, you can pick between these four distribution methods:

A. Shareable Link → Grab the generic survey link by clicking the big “Share” button in the top-right corner of your survey dashboard. You can use this link however you’d like — share it on Twitter, Reddit, or LinkedIn, put it in an email newsletter going out to all your users, or link it in a popup or banner inside your product.
B. Embedded iFrame → Add your OpinionX survey as an embedded widget on any web page by using our pre-built iframe. This is how I embedded the interactive conjoint analysis survey that you saw earlier in this blog post with the lilac-colored frame!
C. Email Invites → Import a list of email addresses and send each person a unique link that can only be used once. If you’re conducting a conjoint analysis study of a sensitive nature, this is the best way to make sure that people cannot complete your survey multiple times. OpinionX charges $0.10 per email sent.
D. Buy Participants → If you don’t have access to a pool of potential participants, you can always use a third-party service to recruit people to complete your survey. On these recruitment services, you pay a fixed fee per participant as an incentive for them to complete your survey. I personally recommend using Prolific, as it has a high-quality audience and is very easy to set up alongside your OpinionX survey.
— — —
How to Interpret Your Conjoint Survey Results
Once participants start to complete your survey, you’ll see their responses appear automatically on your Results page. Conjoint results on OpinionX are displayed in two formats that you can switch between — Table and Chart.

A. What do the scores mean?
The score for each option indicates the likelihood that a profile will be picked if that specific option is displayed on it (-100 means it is certain it won’t be picked, +100 means it is certain that it will be picked).
The score for a category is the difference between the highest and lowest option scores within that category. For example, in the screenshot above, the highest score for an option in the “Brand” category is iPhone (27) and the lowest is Huawei (-56). The difference between these two scores is 83 points, which is the score for the “Brand” category.
This is an important nuance. While the scores for options show the relative importance each option has for participants trying to decide between profiles, the score for categories shows the degree of influence that a category has over the decision. A bigger category score isn’t always a good thing, so it’s important to look at the option scores within that category to understand how the category score is being calculated. Looking at the visual chart for category scores is a good way to quickly interpret this nuance!
How can I use these scores?
You can use the option scores to create hypothetical profiles and estimate which has a higher chance of being picked as the more preferred by a potential customer. For example, let’s use some scores from the smartphone conjoint results in the screenshot above:

In the above example, I put the top-ranked brand (iPhone) together with the lowest-ranked options for Memory and Price. Then I created a competing profile with the lowest-ranked brand (Huawei) but the highest-ranked Memory and Price. Huawei was so disliked by voters that this still did not even nearly give it a strong enough combined score to come close to beating the iPhone profile — the results predict that two-thirds of participants will still pick the low-spec expensive iPhone over the high-spec affordable Huawei (22-(-46) = 68% chance of selection).
How do I segment conjoint analysis results to compare different groups?
There are three ways you can segment your results on OpinionX which are all unlocked on the Analyze tier.
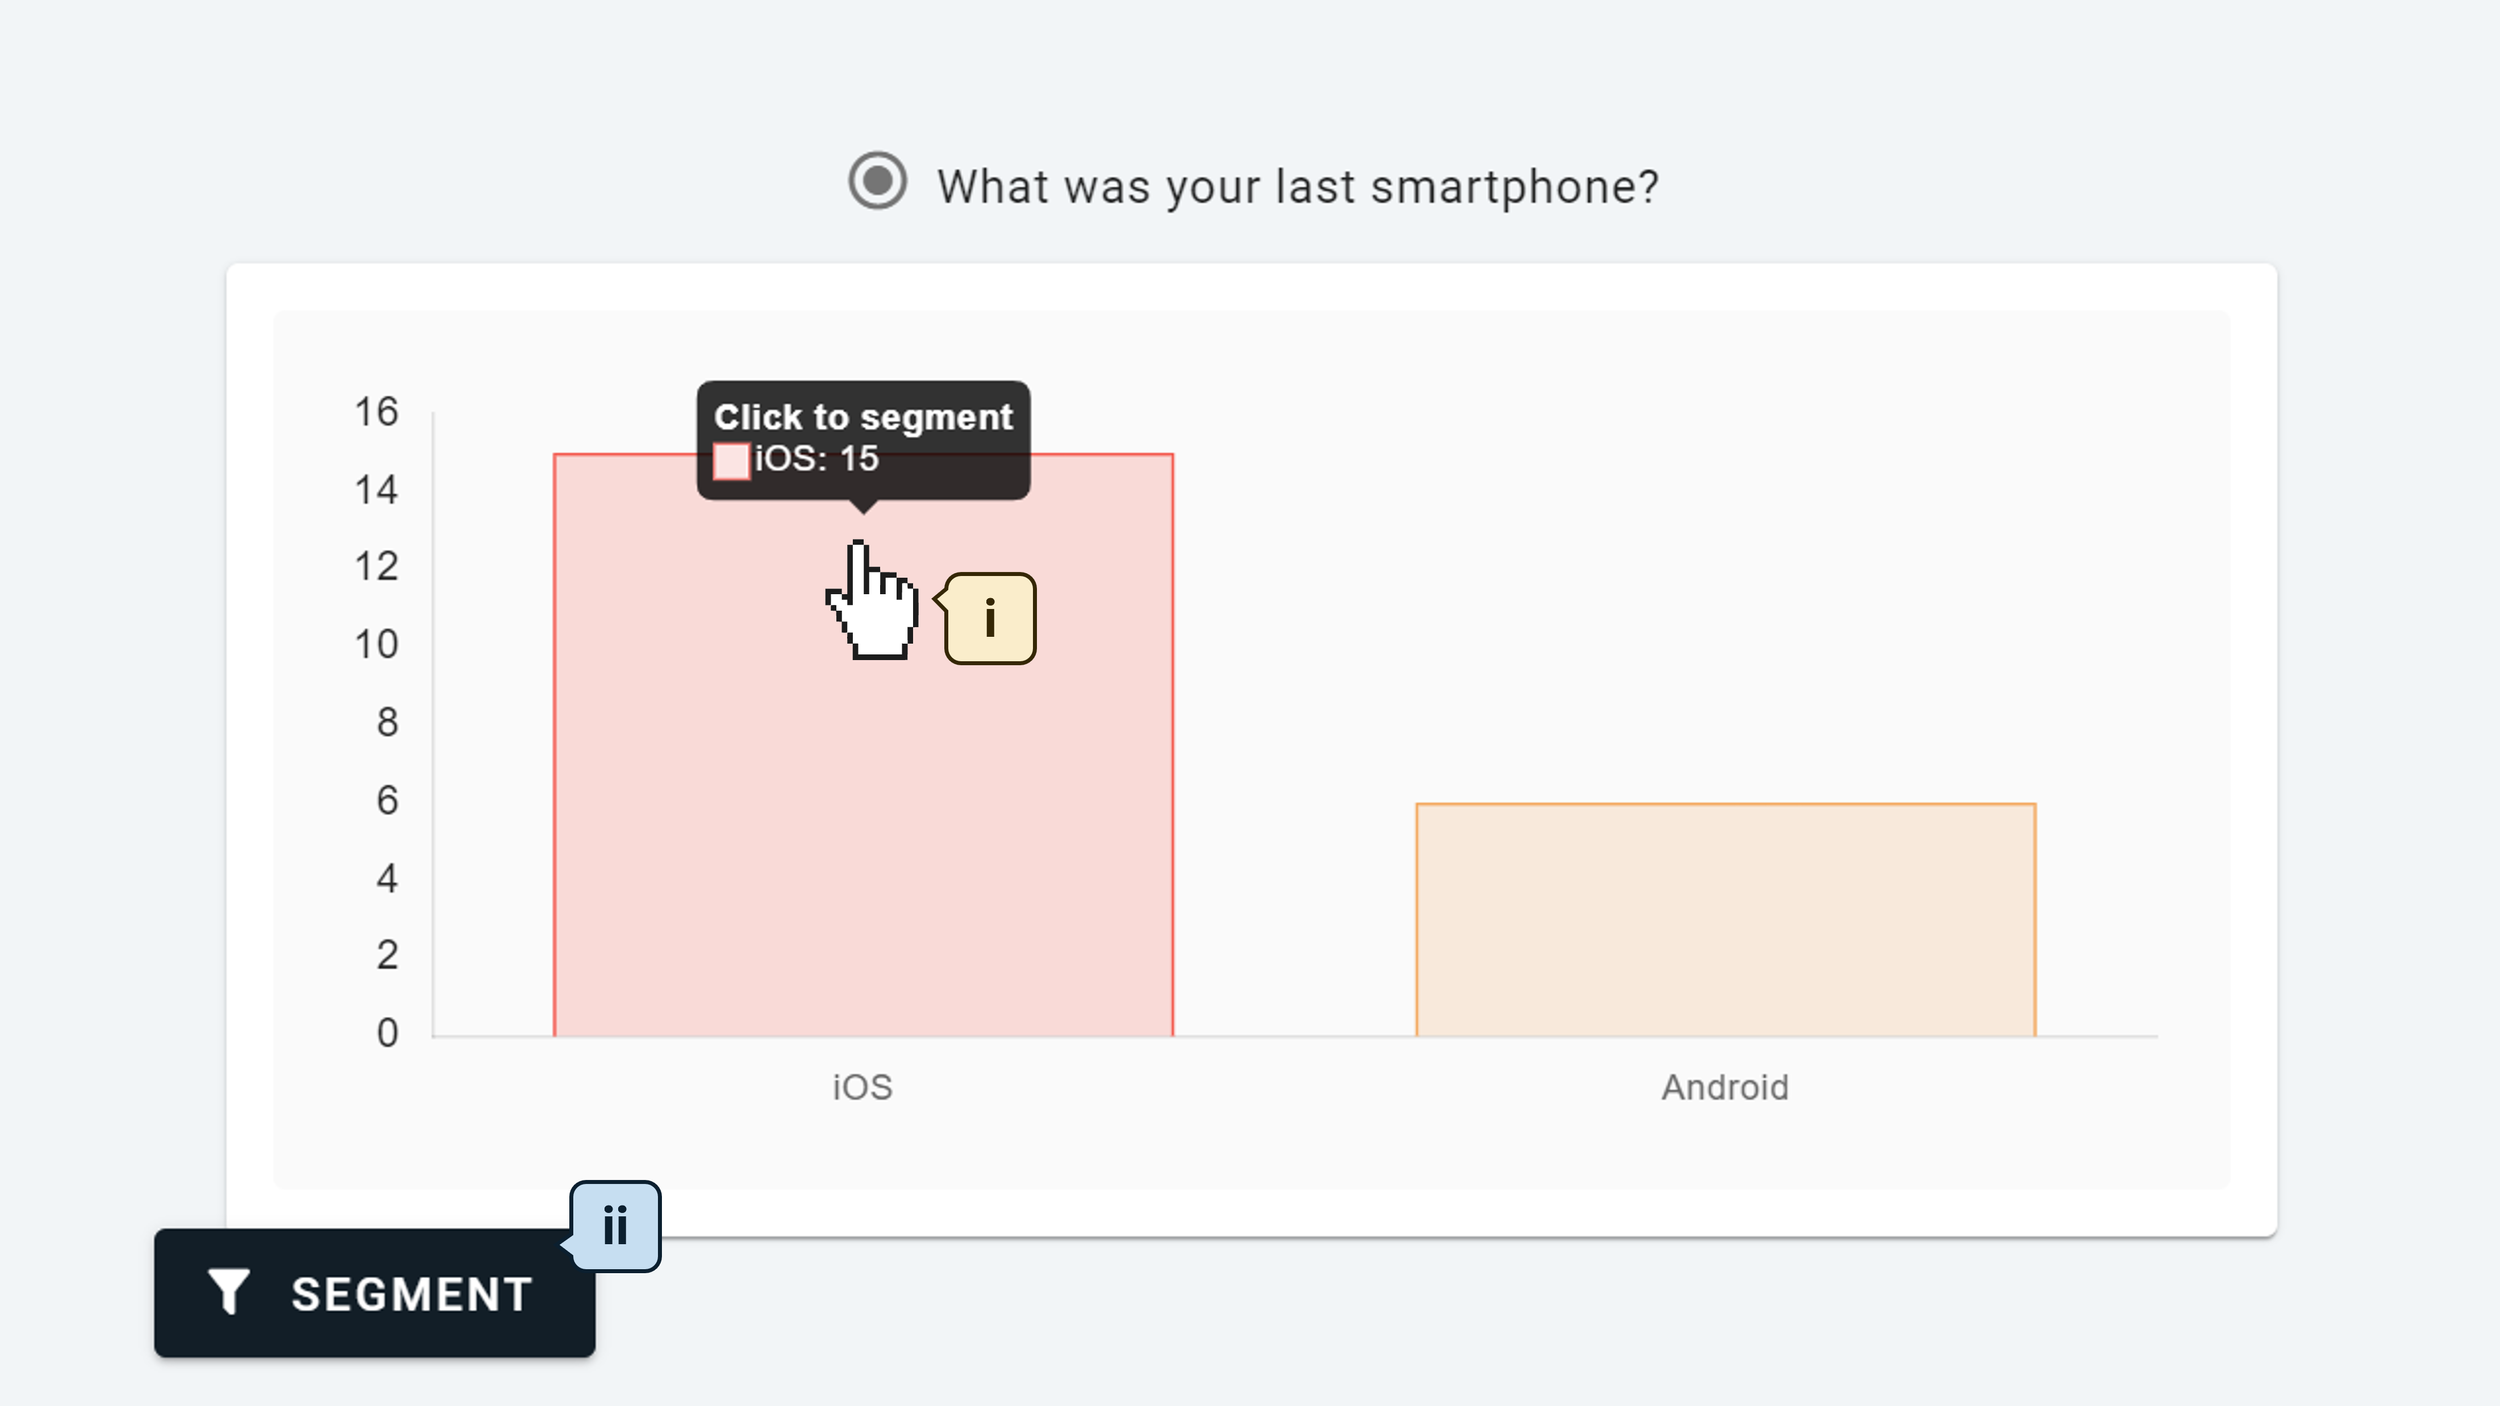
1. Simple One-Click Filter
Go to the results bar chart for any multiple choice or rating scale question and click the bar of the group you wish to filter and isolate. This will recalculate the entire results page to only include the participants who are part of this group. Alternatively, you can click any “Segment” button that you’ll find throughout the results pages to open the segment configuration panel where you can set more advanced filters (like using AND/OR logic).
2. Head-To-Head Comparison
At the top of the survey dashboard, switch to the Compare Tab and define your two segments. This will allow you to see the results for your two segments side by side, making it easier to see specific differences (eg. in the screenshot below, the iPhone is unsurprisingly the top option for current iOS users, whereas it is 10th out of 15 options for current Android users — this is the biggest gap in score between the two segments for any option).

3. Segments Tab
The Segments Tab shows a breakdown of scores for each segment in one color-coded table (ie. a crosstab heatmap visualization). The example below is quite a simple version with just two segments shown, but you can load up to 20 different groups into this table at the same time. The color coding helps to make patterns visible or anomalies stand out. One interesting takeaway from the screenshot below is that iOS users are more likely to be open to picking a Google Pixel (+10) whereas Android users are very resistant to the idea of picking an iPhone (-18).

That’s a whistle-stop tour of conjoint analysis on OpinionX! Here’s a quick reminder of the most important points:
🟢 Price: Run full conjoint surveys for free with up to 10 participants, with all analysis features included. Scale to 1000 participants per survey with unlimited surveys on the Analyze plan for $900/year.
🟢 Trial: Conjoint is on OpinionX’s free tier and you can test premium analysis features before upgrading.
🟢 Conclusion: Unlike other conjoint analysis software tools, OpinionX doesn’t treat conjoint as a gated enterprise feature -- it treats it like a normal survey method that anyone should be able to understand and use in their own research.
Join the tens of thousands of teams already using OpinionX to measure what their customers care about most. Sign up to OpinionX for free and create your first conjoint analysis survey in less than five minutes.
— — —
What are the best tools for Conjoint Analysis
A range of research platforms offer conjoint analysis surveys, from free self-service survey tools to $30,000/year advanced analysis platforms that require expert consultants to manage your studies for you.
This section offers an in-depth review of the 10 most popular tools for conjoint analysis. It includes pricing details, product limitations, survey screenshots, and specific suggestions to help you pick the platform that best suits your research needs. While uncommon, there are free tools for conjoint analysis, so if you’re keen to find platforms that you can personally test before buying, then this is the right review guide for you.
10 Most Popular Tools For Conjoint Analysis
1. OpinionX
2. Pollfish
3. Qualtrics DesignXM
4. SurveyMonkey
5. SPSS
6. Sawtooth Software
7. QuestionPro
8. 1000minds
9. Quantilope
10. Alchemer
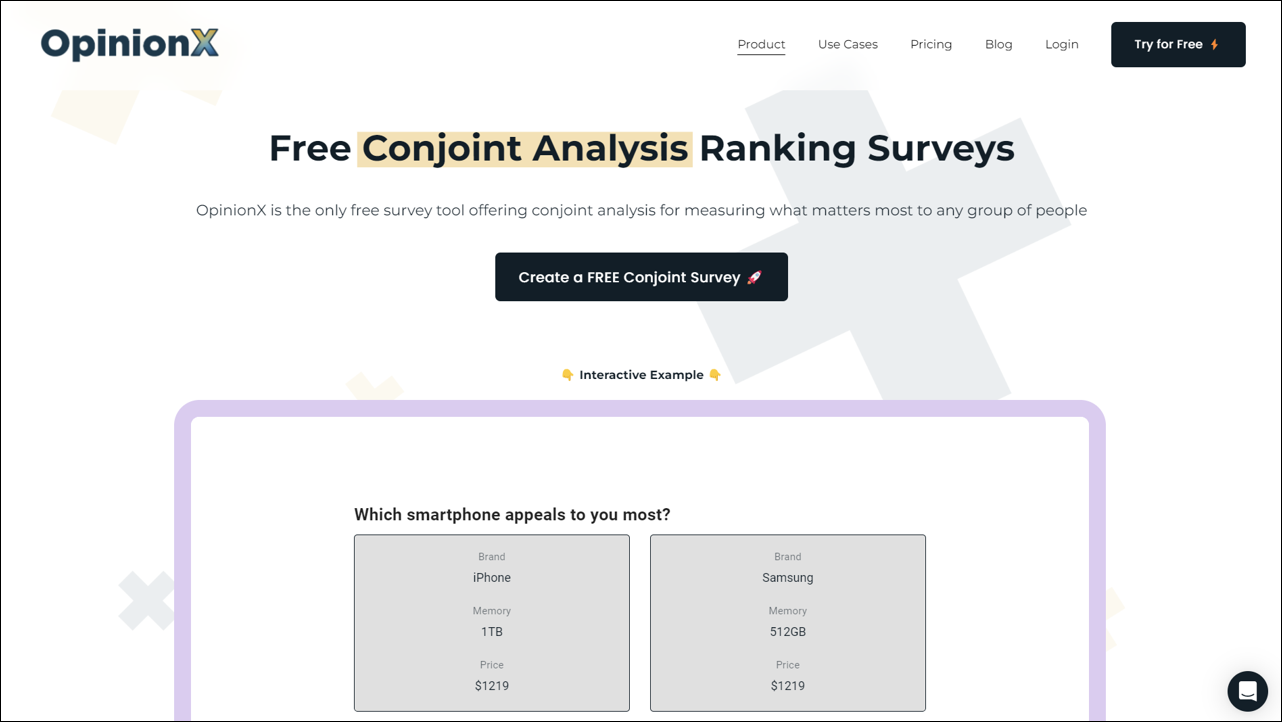
1. OpinionX
OpinionX is a free survey tool for ranking people’s preferences and priorities that’s used by thousands of teams from companies like Google, Amazon, and Shopify. It is the only survey tool that offers unlimited conjoint analysis surveys with unlimited participants for free.
Unlike other survey tools, OpinionX’s conjoint analysis question has been designed specifically to be easy to use on small touchscreen phones. The profiles are responsive in shape and can be stacked horizontally or vertically to suit the participant’s screen size. Attribute titles are shown as small headers above each level/option so that respondents on mobile phones do not have to scroll over and back repeatedly to recontextualize the meaning of the text displayed on each profile.
Try an OpinionX conjoint survey for yourself by using the interactive demo below:
⬆️ interactive demo ⬆️
Let’s look closer at how OpinionX works, a breakdown of its pricing plans, and specifically the functionality it offers for conjoint analysis.
How does OpinionX work?
OpinionX has two main areas of value: (1) ranking surveys and (2) segmentation analysis. It comes with a range of ranking methods, including Pairwise Comparison, Ranked Choice Voting, Points Allocation, Image Ranking, MaxDiff Analysis, Consensus Voting, and Conjoint Analysis. All of these ranking methods, along with normal survey formats like multiple-choice questions and open text-response boxes, are completely free to use with no limit on the number that can be included per survey.
Segmentation analysis on OpinionX, available via the Analyze plan, offers multiple ways to filter, compare, and analyze your ranked results to see how groups of similar people voted differently from everyone else. This kind of analysis is the most important part of any conjoint research — you’re not just looking to see which attributes are most important to customers, you’re trying to see which attributes are most important to your most important customers.
OpinionX’s segmentation features are designed to populate automatically — you don’t need to be a data scientist to configure them or figure out what they mean. They are intuitive to use, with built-in diagrams, helpful popups to explain what things mean, and simple buttons to help you pick the segments you want to analyze. OpinionX helps you independently conduct the kind of research that your teammates will think you hired a specialist researcher to do for you!

What are OpinionX’s pricing plans?
OpinionX has three product tiers — Ask (Free), Analyze, and Accelerate.
The Ask (Free) tier is designed to let teams run real research before paying. You can launch full Conjoint and MaxDiff studies with all advanced question types and analysis unlocked, limited to 10 participants. This allows teams to validate their research design, methodology, and outputs before committing. Compared to most survey tools, OpinionX’s free tier is unusually generous. Even allowing you to add your whole team to the workspace.
The Analyze tier includes everything in Ask (Free), along with unlimited surveys with up to 1,000 participants and is available as a yearly subscription priced at $900 per year.
The Accelerate tier is intended for enterprises. It includes unlimited participants, priority support, research guidance, and enterprise-grade security (2FA, SSO, Custom requests). Pricing for Accelerate is based on team needs and scope, making it best suited for organizations that want hands-on support and maximum flexibility.

2. Pollfish
Pollfish stands out from other survey platforms by offering access to a massive integrated panel of over 250 million respondents across 160 countries. This makes it a powerful option for researchers looking to recruit survey participants quickly, particularly for international studies.
However, if you're specifically looking for conjoint analysis with panel recruitment, Pollfish will disappoint. Their conjoint functionality is locked behind the $30,000/year Elite Plan, designed primarily for large-scale research agencies.
🔴 Price: $30,000/year for conjoint analysis makes Pollfish the most expensive tool on this list.
🔴 Trial: No free tier or premium trial for conjoint analysis
🔴 Conclusion: Unless you’re a large agency with enterprise-level needs, there’s no reason to pick Pollfish for conjoint analysis. Its main draw is the panel access, but even that can be sourced more affordably elsewhere, like through third-party panels on OpinionX.

3. Qualtrics DesignXM
Qualtrics advertises DesignXM as a premium market research platform, but when it comes to conjoint analysis, it’s both shockingly expensive and functionally underwhelming.
You’ll pay a minimum of $13,040 just to get started -- that’s $5,040/year for one seat on Qualtrics’ lowest-priced plan ‘Strategic Research,’ plus an extra $8,000 to unlock their conjoint analysis add-on. Even then, that price only covers 1,000 participants total, after which it’s an additional $1 per response.
After months of salesperson demos, pricing discussions, and contract negotiations, what you finally get is a barebones conjoint tool that feels like it was built in 2009 and hasn’t been updated since. See for yourself, the screenshot below shows what a conjoint analysis survey on Qualtrics looks like:
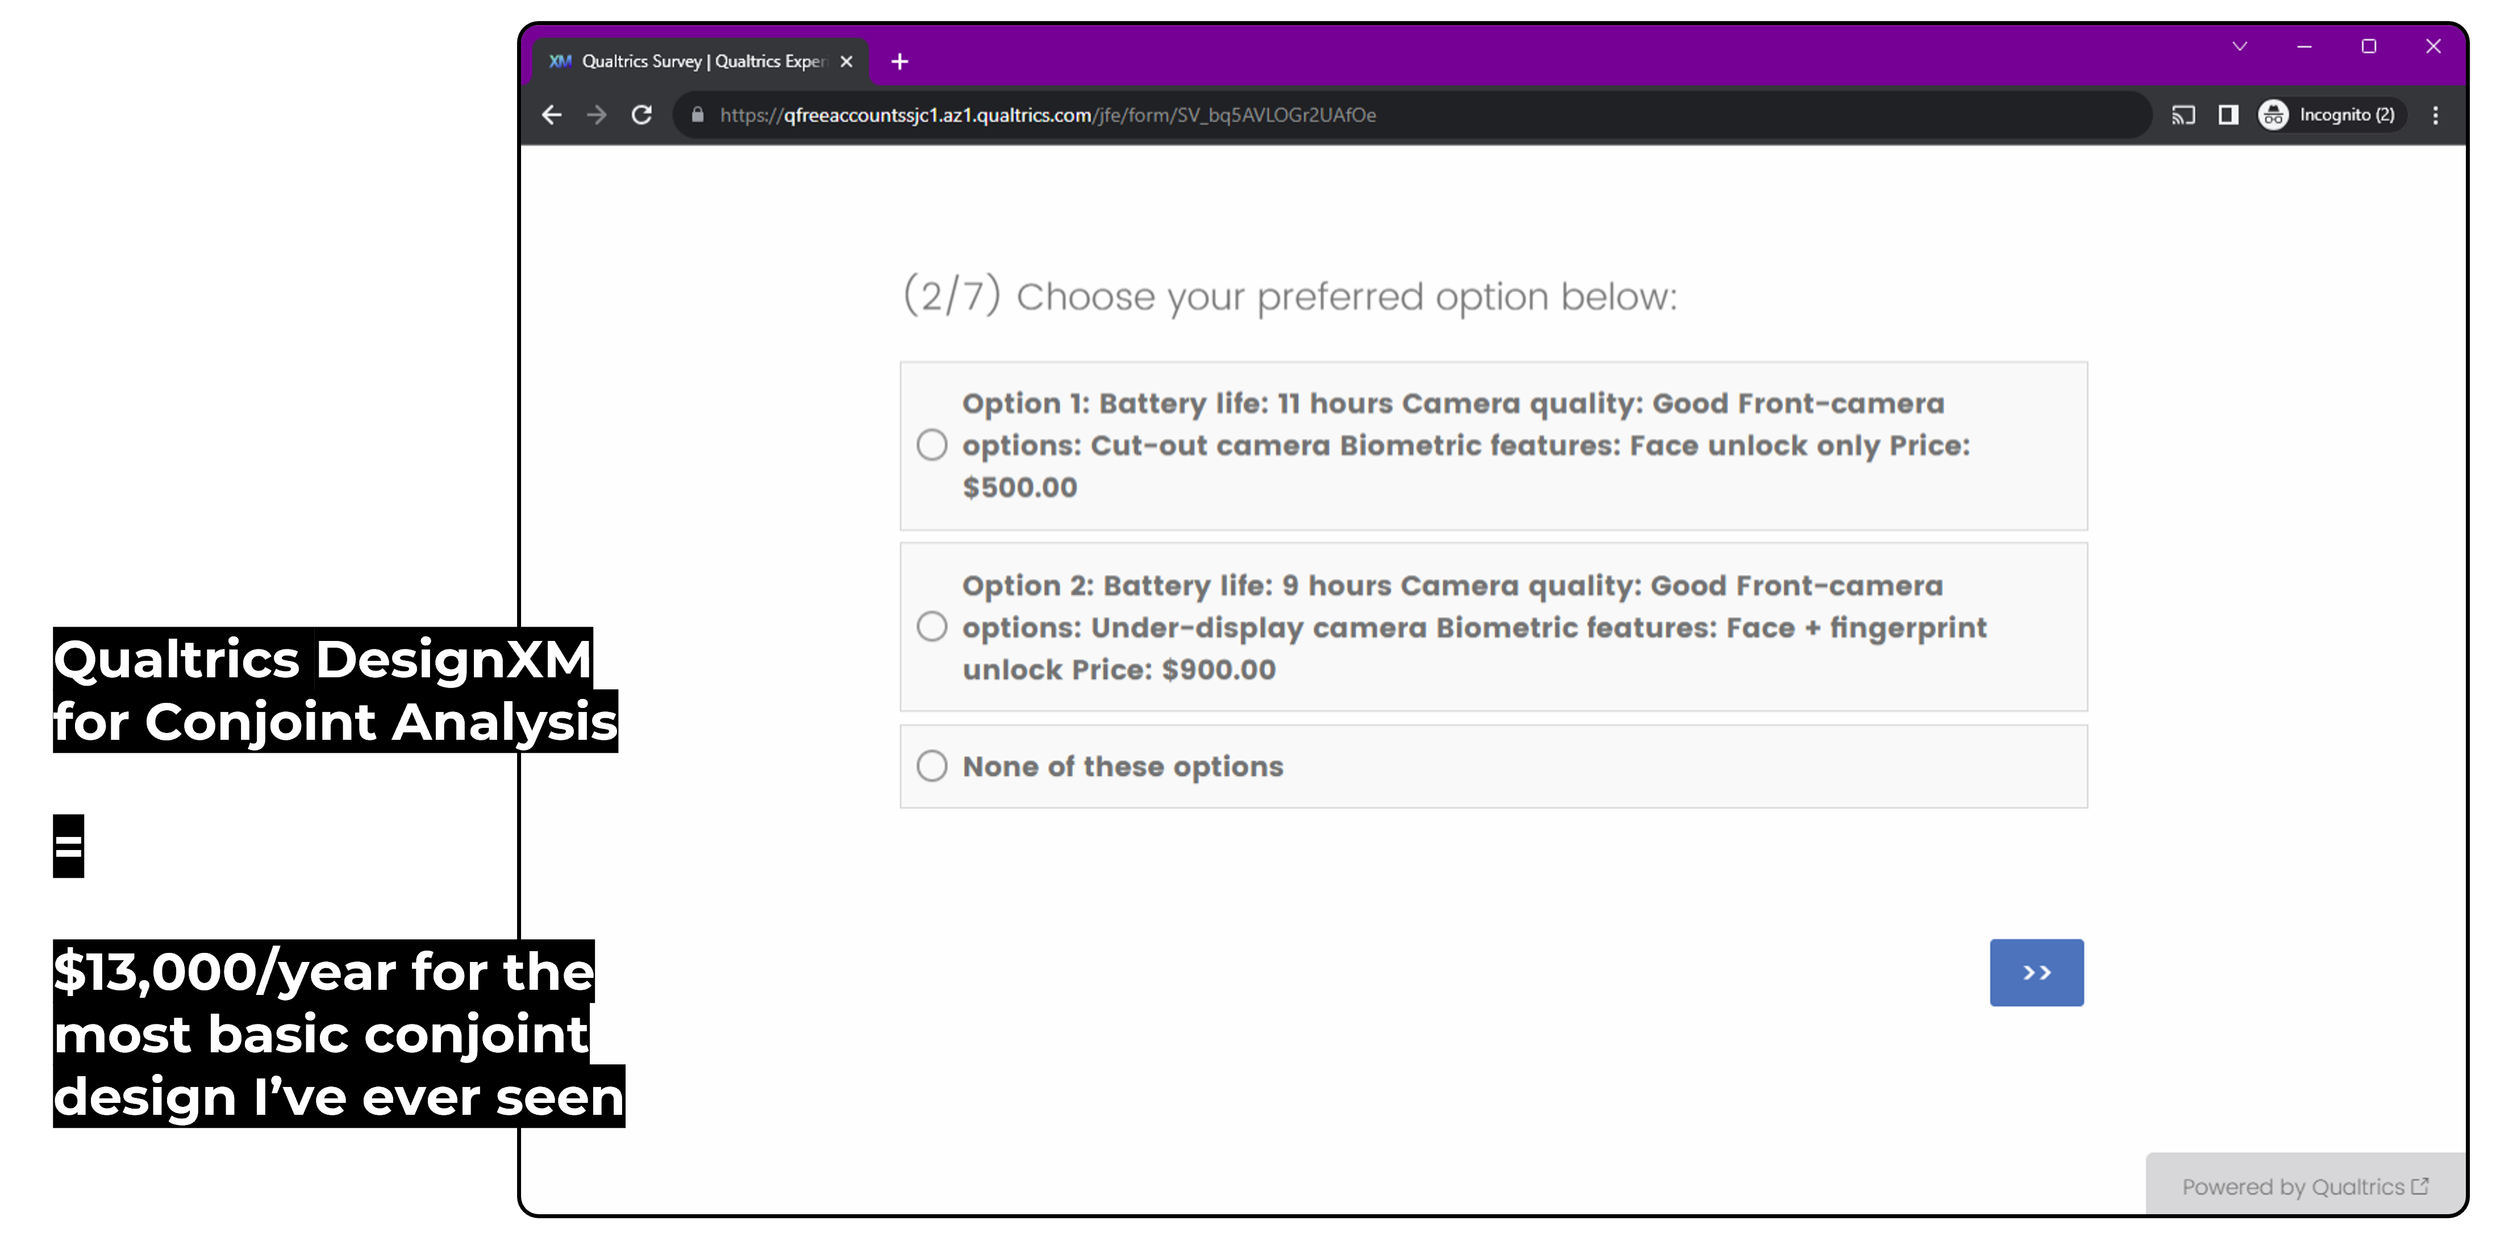
🔴 Price: $13,040 total + $1/respondent.
🔴 Trial: No, conjoint analysis is not available on the Qualtrics free plan and can only be tested by going through 3-5 fun rounds of negotiation with a salesperson.
🔴 Conclusion: Avoid! Imagine paying over $13,000 to buy Qualtrics’ conjoint analysis software only to receive the screenshot above, which barely even qualifies as a conjoint survey? Hard pass.

4. SurveyMonkey
You’ll see conjoint analysis listed on SurveyMonkey’s website, but don’t be fooled -- SurveyMonkey does not have a conjoint analysis survey tool.
Instead, conjoint is offered only as a custom market research service. That means you can’t create a conjoint survey yourself, even on their most expensive plan. You have to submit a request and a SurveyMonkey researcher will build it for you manually.
Worse still, their conjoint studies can’t be combined with other question types. The researcher-built conjoint is a standalone project, not an actual survey you can modify, customize, or integrate with your other research questions — making it extremely limited for research purposes.
🔴 Price: $25,000 Enterprise Tier + additional fee per conjoint project (no pricing transparency).
🔴 Trial: No, conjoint analysis is not available on SurveyMonkey’s free tier.
🔴 Conclusion: Avoid! The only reason researchers use SurveyMonkey for conjoint analysis is because their company already has an enterprise agreement in place. Nobody chooses SurveyMonkey for its conjoint capabilities because it doesn’t really have any.

5. SPSS
SPSS, first released in 1968 and acquired by IBM in 2009, is a legacy statistical analysis tool still widely used in academia and government. SPSS technically has more customers than SurveyMonkey or Qualtrics but its role is typically statistical analysis, not survey delivery. Conjoint analysis is available only on the top-tier “Premium” plan, which costs a staggering $23,800 per user for a perpetual license.
🔴 Price: $23,800/user (perpetual license only).
🔴 Trial: No premium trial or free tier includes conjoint analysis.
🔴 Conclusion: Aimed at legacy enterprises and academic institutions, SPSS has become increasingly irrelevant for modern survey research. Its outdated interface, steep learning curve, and lack of cloud functionality make it a poor fit for teams looking for flexible, scalable conjoint tools.

6. Sawtooth Software
Sawtooth Software pioneered digital conjoint analysis surveys in the 1990s and has been a major player in the market research space for over 30 years. They offer deep expertise in both traditional and digital conjoint research, along with webinars and training programs for market researchers looking to upskill.
Sawtooth Software provides two products for conjoint analysis: Lighthouse Studio and Sawtooth Discover. Lighthouse Studio is a powerful Windows desktop application, starting at $10,900/year. It’s considered the most advanced discrete choice modeling software available, supporting complex designs such as Menu-Based Choice (MBC), Adaptive Choice-Based Conjoint (ACBC), and more. Sawtooth Discover is their cloud-based, easier-to-use platform designed for most standard choice-based conjoint and MaxDiff studies. It costs $4,500 per user per year and includes a free trial that lets you run a survey with up to 50 participants before upgrading to the premium plan.
🟠 Price: $4500/user/year for Sawtooth Discover.
🟢 Trial: Free for your first 50 participants, upgrade to unlock full results.
🟢 Conclusion: Sawtooth Discover is an ideal platform for market researchers conducting consumer research via choice-based conjoint, adaptive conjoint, and other discrete choice models. While it's priced significantly higher than OpinionX, it offers robust functionality without the complexity of Sawtooth’s more advanced Lighthouse Studio product.

7. QuestionPro
QuestionPro is an all-in-one survey platform that competes with tools like Qualtrics and SurveyMonkey, offering a broad feature set at a more affordable price point. However, its interface and structure can feel overwhelming due to the volume of functionality crammed into one platform with little consideration given to design or usability.
Conjoint analysis is only available on the top-tier “Research Suite” plan, which starts at $5000/year plus $1/respondent after the initial 5000 responses allocation has been used. There is no way to trial this premium plan or see QuestionPro’s conjoint analysis software in action without engaging their sales team.
🟠 Price: $5000/year plus $1/respondent
🔴 Trial: No premium trial or free plan; conjoint is only available on the highest paid plan.
🟠 Conclusion: Cheaper full-suite survey platform than SurveyMonkey or Qualtrics but still considerably higher than OpinionX.

8. 1000minds
1000minds is a decision-making platform tailored for health economics, public policy, and academic research. It was launched in 2002 and is best known for its patented PAPRIKA algorithm, which offers an alternative to the standard models like Hierarchical Bayes or Linear Regression that are used in most other conjoint analysis platforms.
🔴 Price: $25,000/year tied to a specific project or use case (not for organization-wide access).
🟢 Trial: 1000minds offers a 15-day free trial with access to its core features.
🟠 Conclusion: If you're a specialist academic researcher or policymaker needing rigorous, algorithm-driven analysis for a narrow use case, 1000minds is a highly specialized and well-respected tool. For everyday commercial conjoint research, its pricing and structure can be overkill.
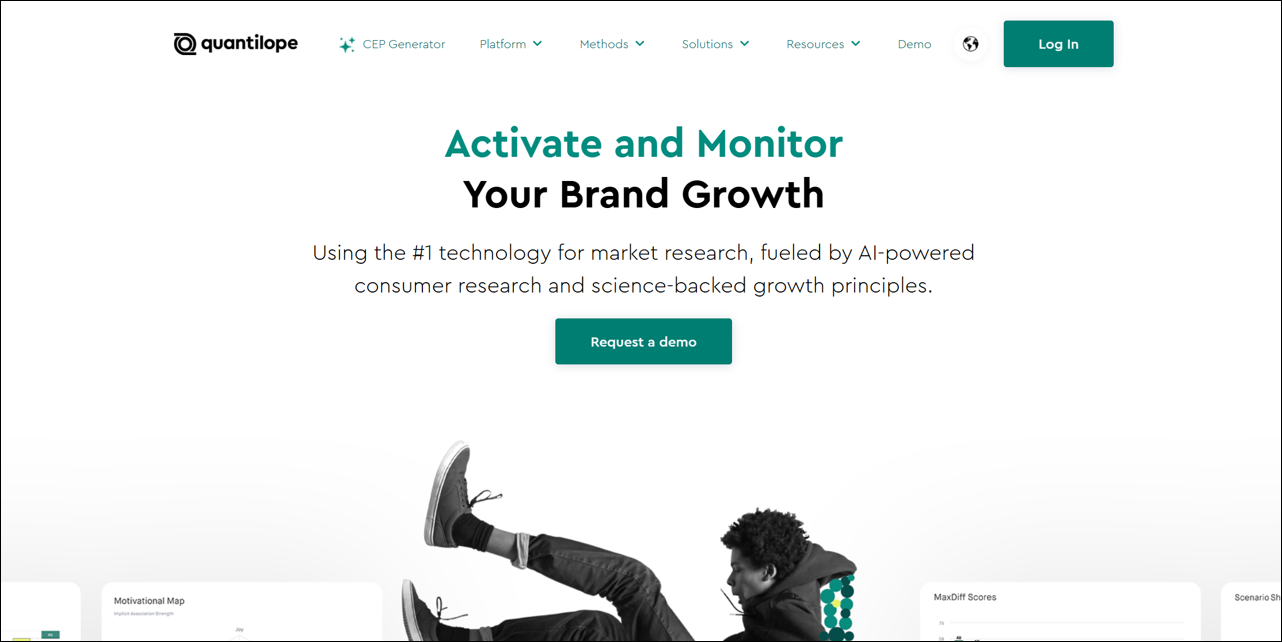
9. Quantilope
Quantilope is a consumer intelligence platform for large enterprises. It offers a broad suite of advanced research methods, including choice-based conjoint surveys, with real-time automated analysis and an AI co-pilot called Quinn that helps with study design, charting, and reporting. The tradeoff is price and positioning. Quantilope is firmly aimed at enterprise-level insights teams and mid-to-large consumer brands, not individual researchers or small product teams.
🔴 Price: Cheapest Quantilope entry plan is around $22,000/year for just 3 users.
🔴 Trial: No free tier or self-serve trial, and access requires a sales demo and contract.
🟠 Conclusion: Quantilope is a strong choice for large enterprise insights teams replacing expensive agency-led research with a “done for you” software partner, but for smaller teams, independent researchers, or anyone running occasional conjoint studies, the entry price makes it hard to justify. OpinionX remains the more accessible alternative at a fraction of the cost and with a free tier for testing it out first.

10. Alchemer
Alchemer (formerly SurveyGizmo) positions itself as a cost-effective, general-purpose alternative to tools like SurveyMonkey and Qualtrics, designed mainly for small teams who want a simpler full-suite survey tool.
🟠 Price: $9,900/year with a maximum of 3 researcher seats
🟠 Trial: 7-day free trial, no free plan available.
🔴 Conclusion: While competitively priced for a full-featured survey tool, Alchemer falls short for serious conjoint research as it lacks essential features like prohibited pairing logic, a market simulator, segmentation analysis, and a marginal willingness to pay report.
— — —
— — —
13 Types of Conjoint Analysis Survey
“Conjoint Analysis” is a catch-all term that actually represents a lot of different survey formats. This section covers the 13 most common types of Conjoint Analysis survey, explaining how each type works along with image examples to help you understand their differences.
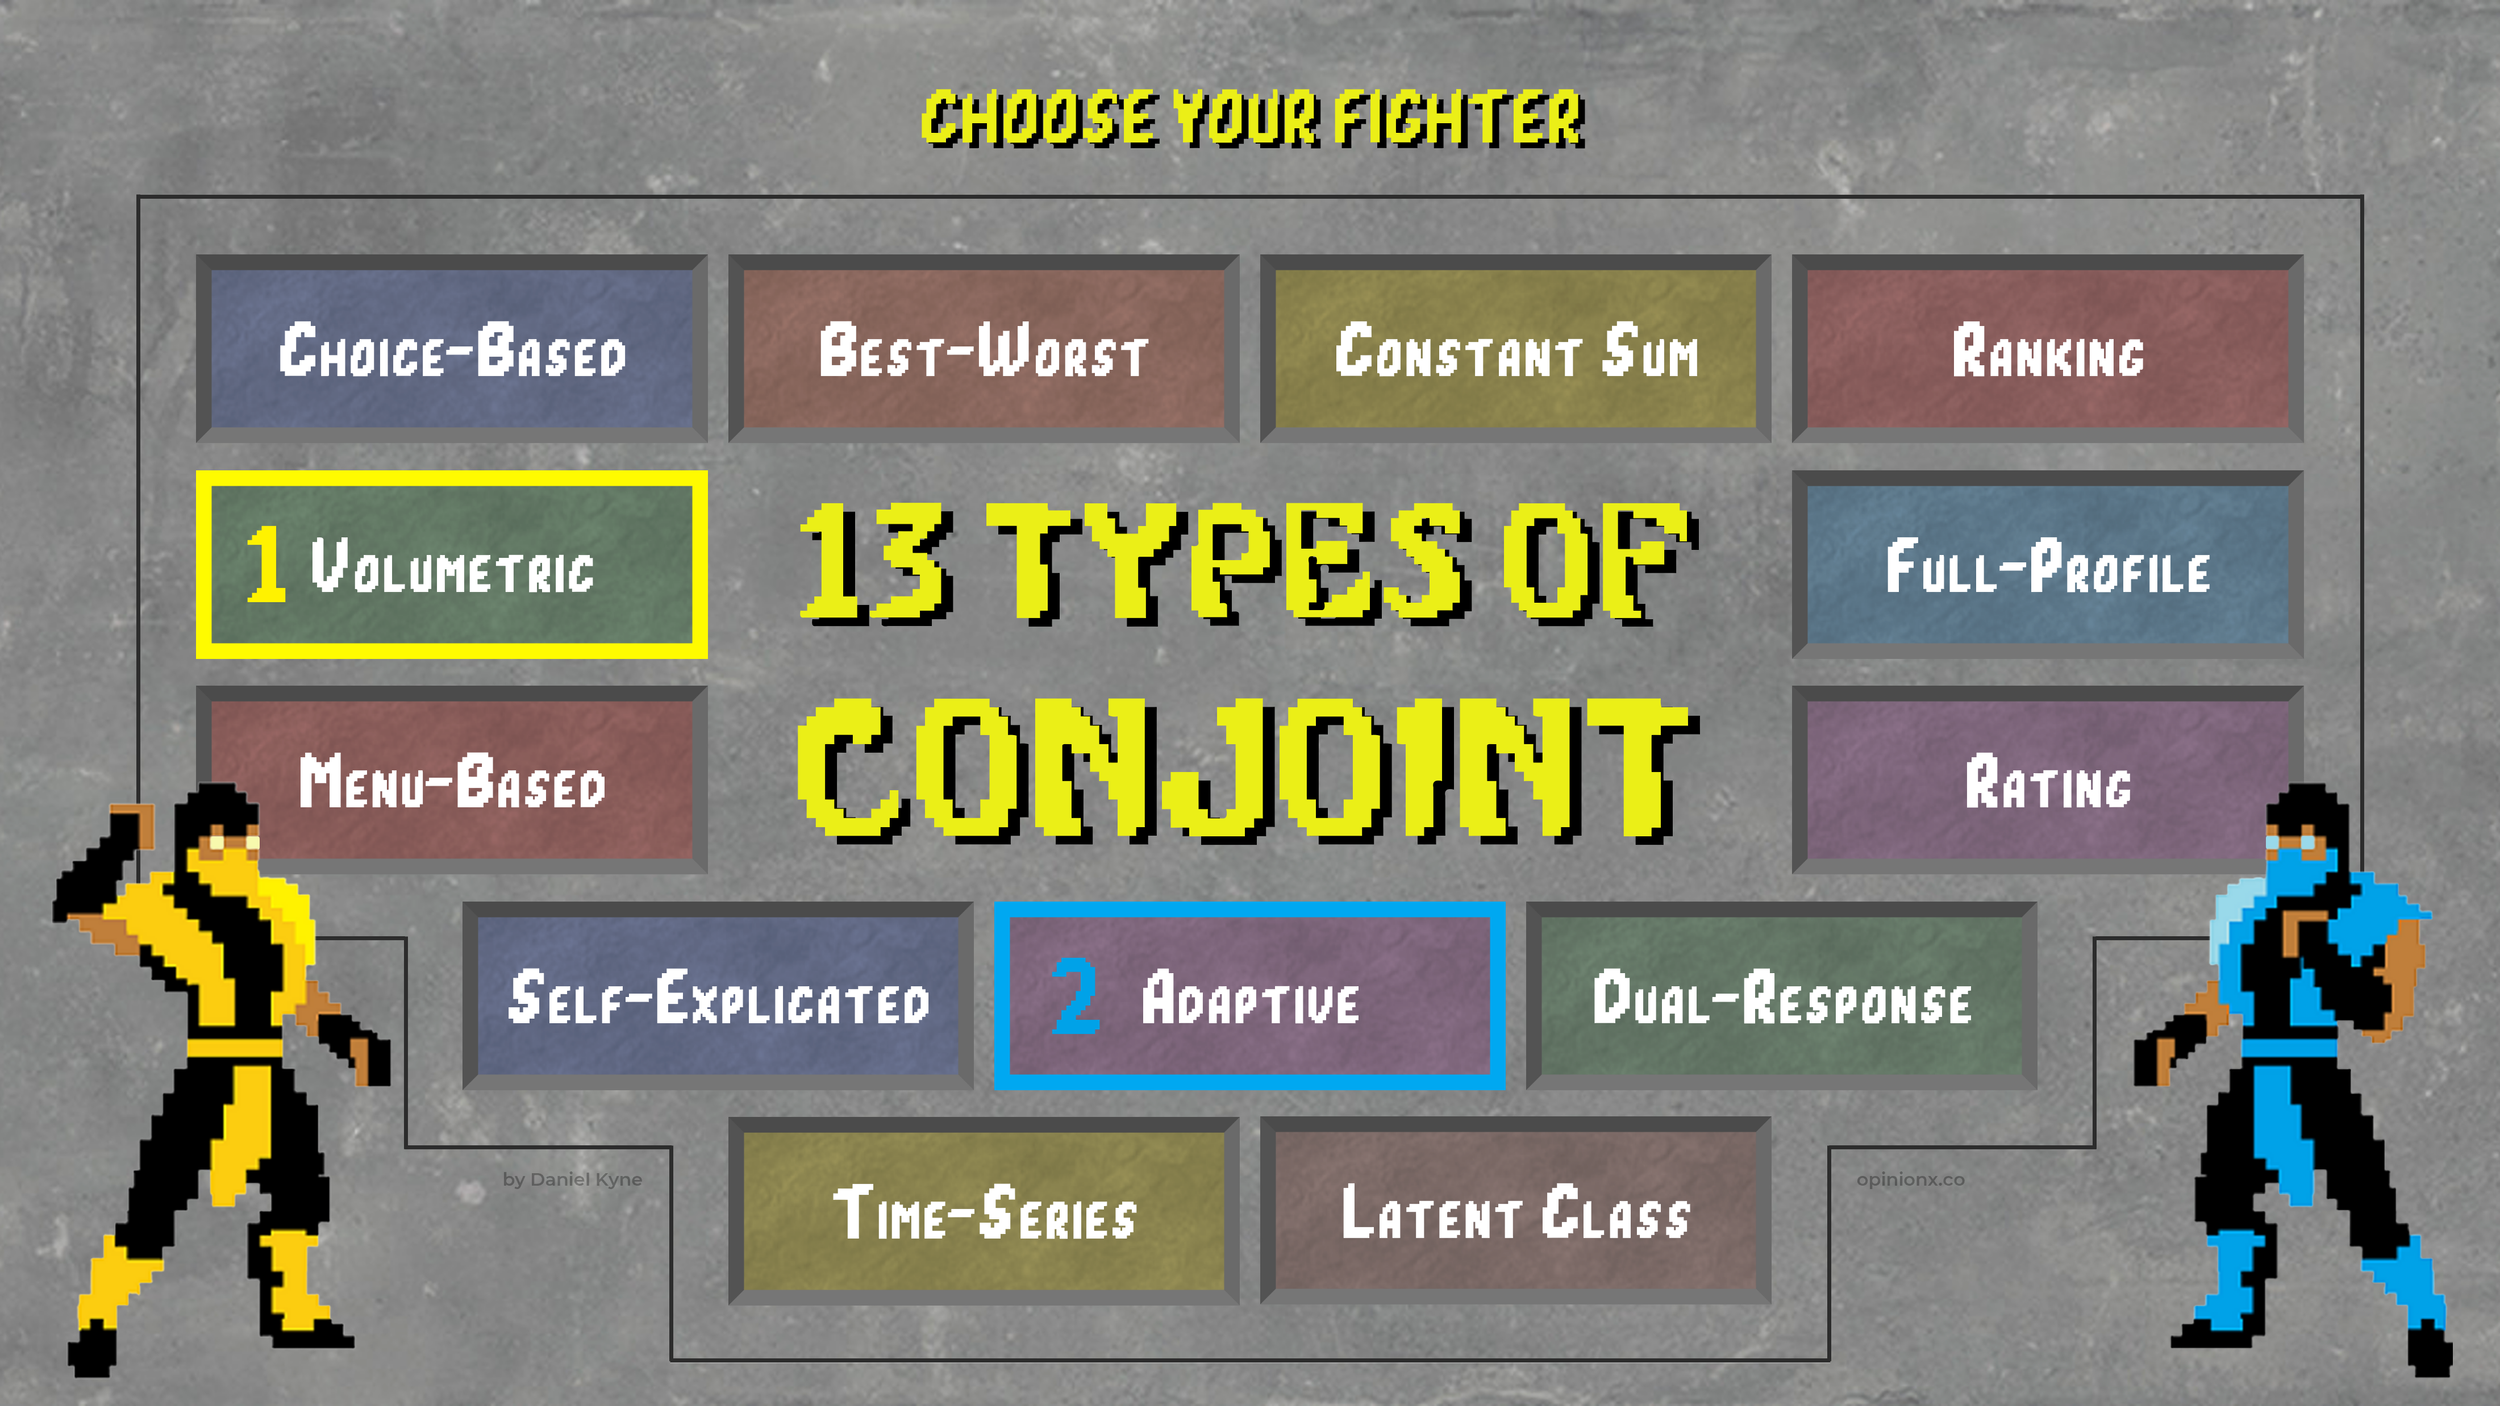
The 13 Most Common Types of Conjoint Analysis:
1. Choice-Based
2. Best-Worst
3. Ranking
4. Constant Sum
5. Rating
6. Volumetric
7. Full-Profile
8. Menu-Based
9. Self-Explicated
10. Dual-Response
11. Adaptive
12. Time-Series
13. Latent Class
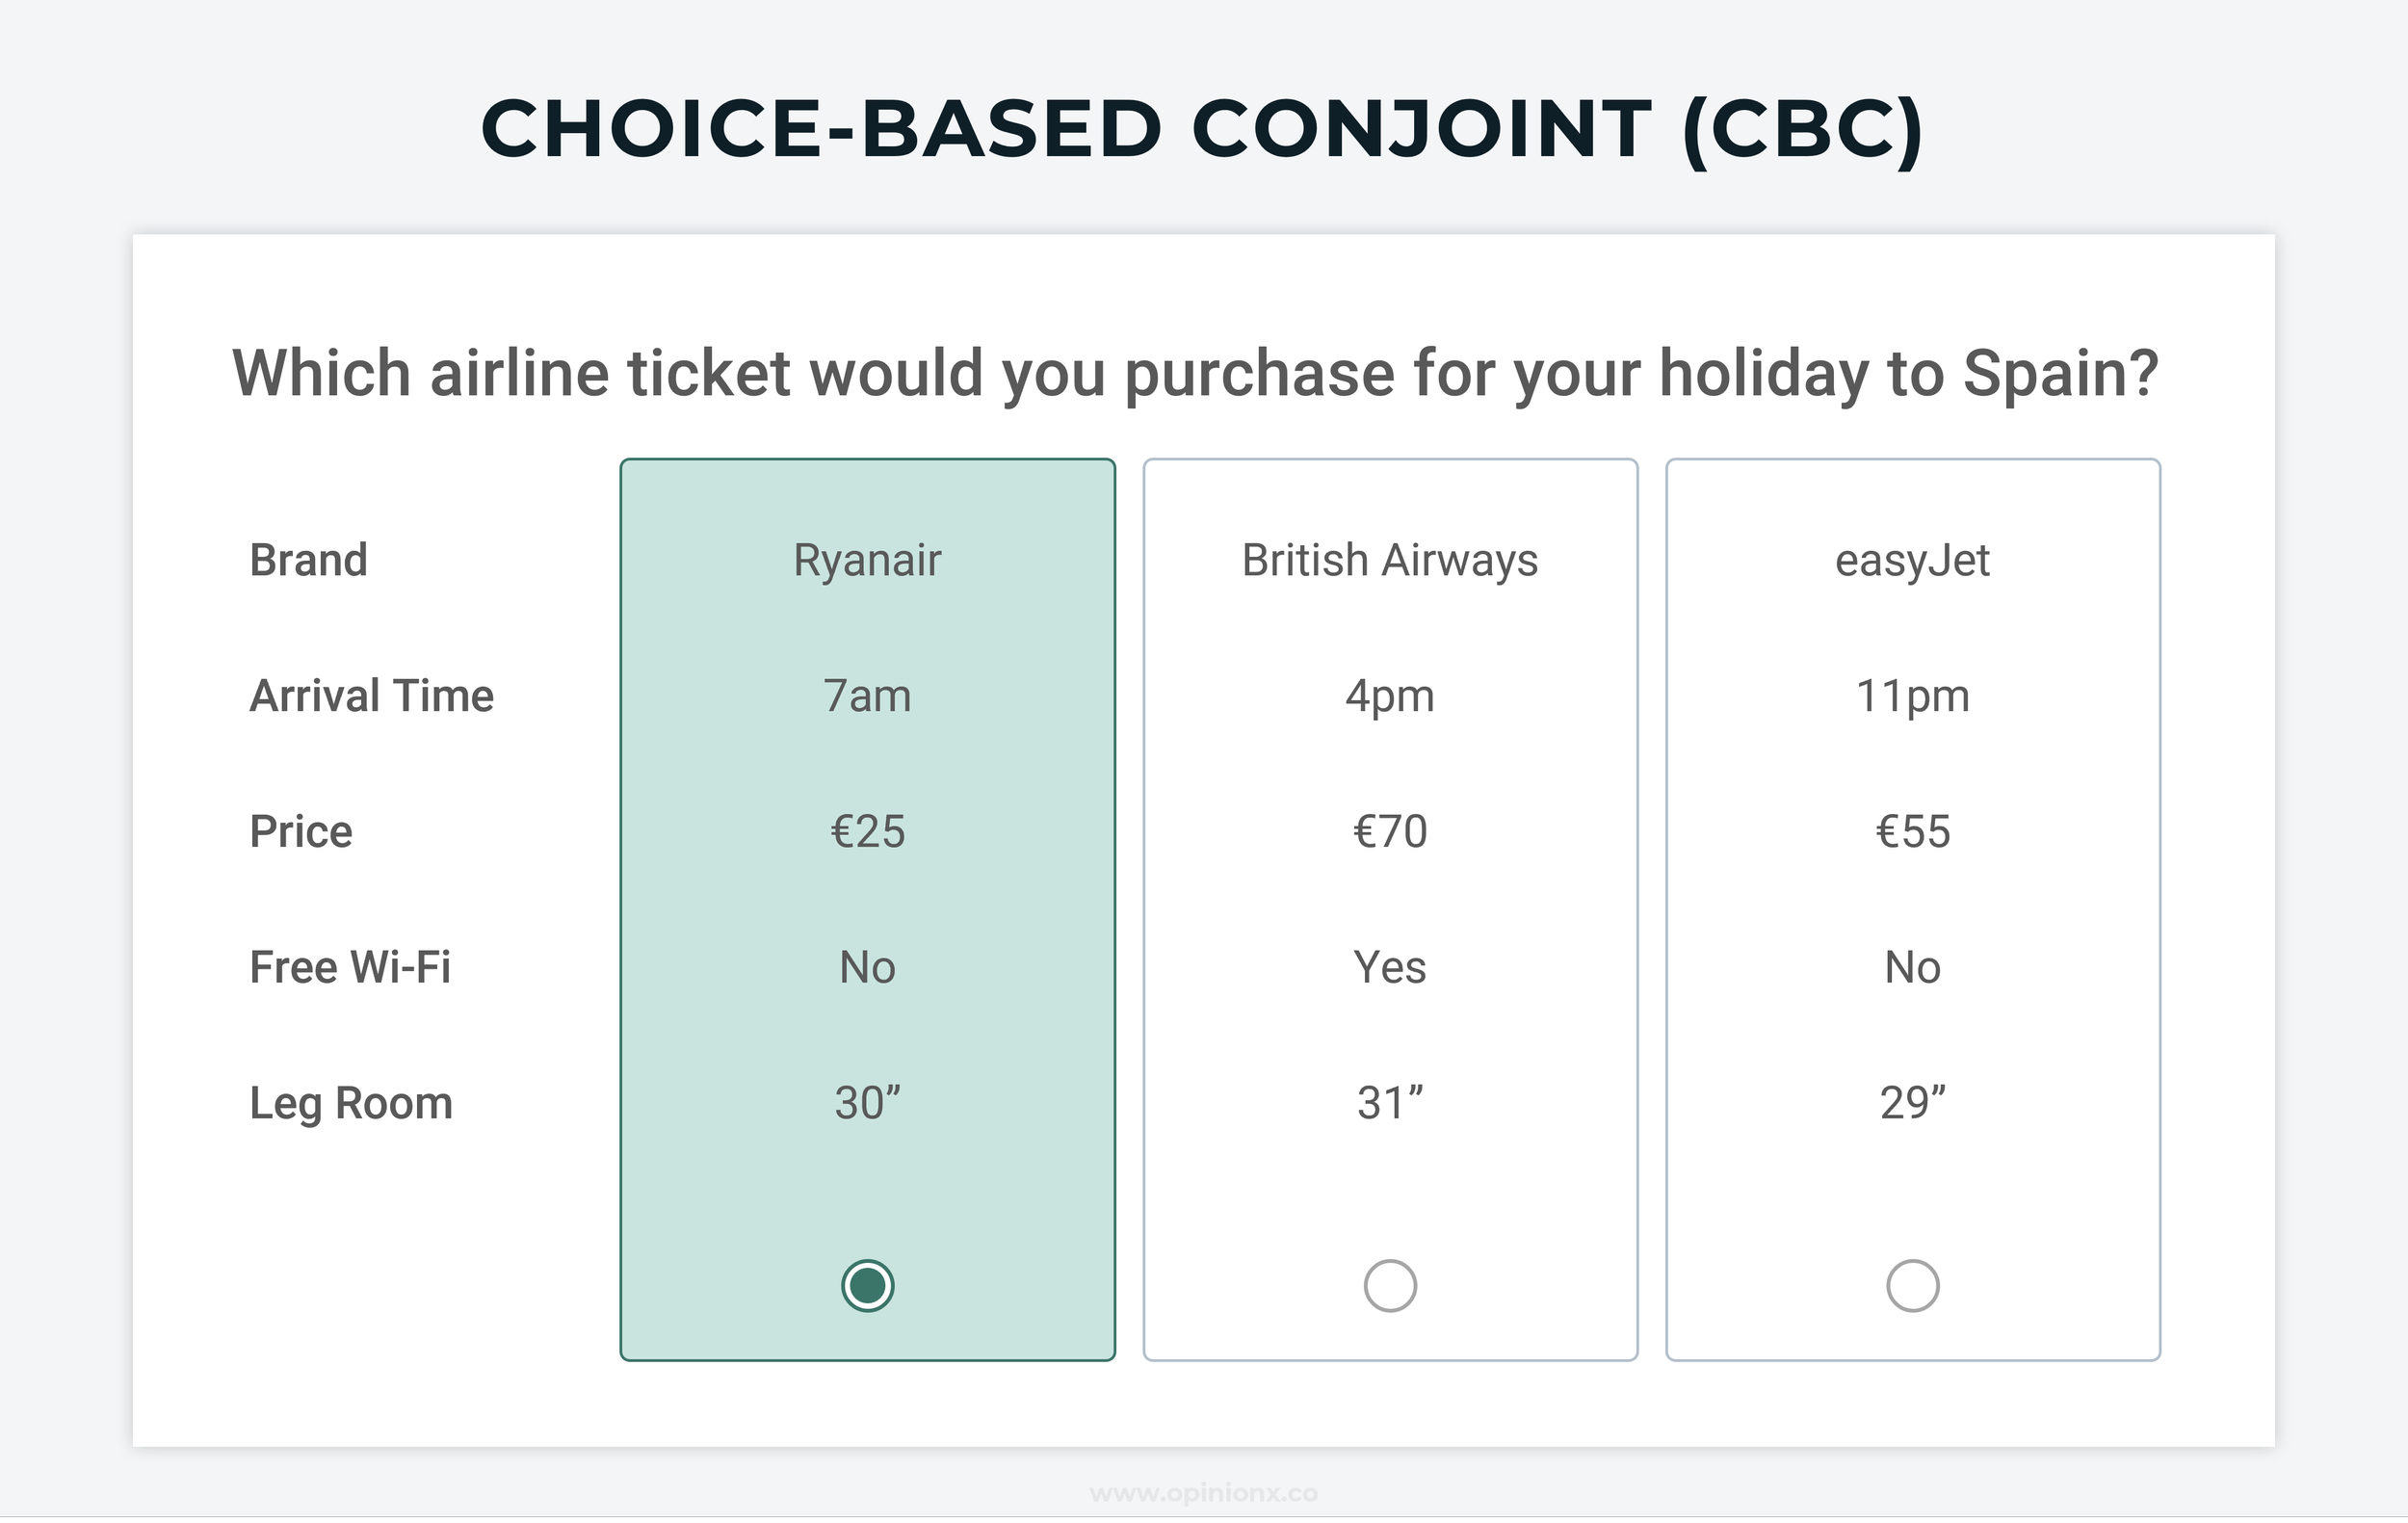
1. Choice-Based Conjoint Analysis (CBC)
Choice-Based Conjoint (CBC) is the most common survey format used to run conjoint analysis research. Respondents are shown a set of product “profiles” (usually 2-6 at a time) and asked to choose the option they prefer most or would be most likely to buy. This is repeated multiple times, with the attribute “levels” in a profile changing each time the respondent votes.
OpinionX is a free tool for creating Choice-Based Conjoint Analysis surveys. You can set as many attribute categories and level options as you’d like for free and you can engage unlimited participants for free too! Free conjoint surveys on OpinionX only show two profiles at a time, premium tiers offer customizations like a custom number of profiles and advanced segmentation analysis of your results.
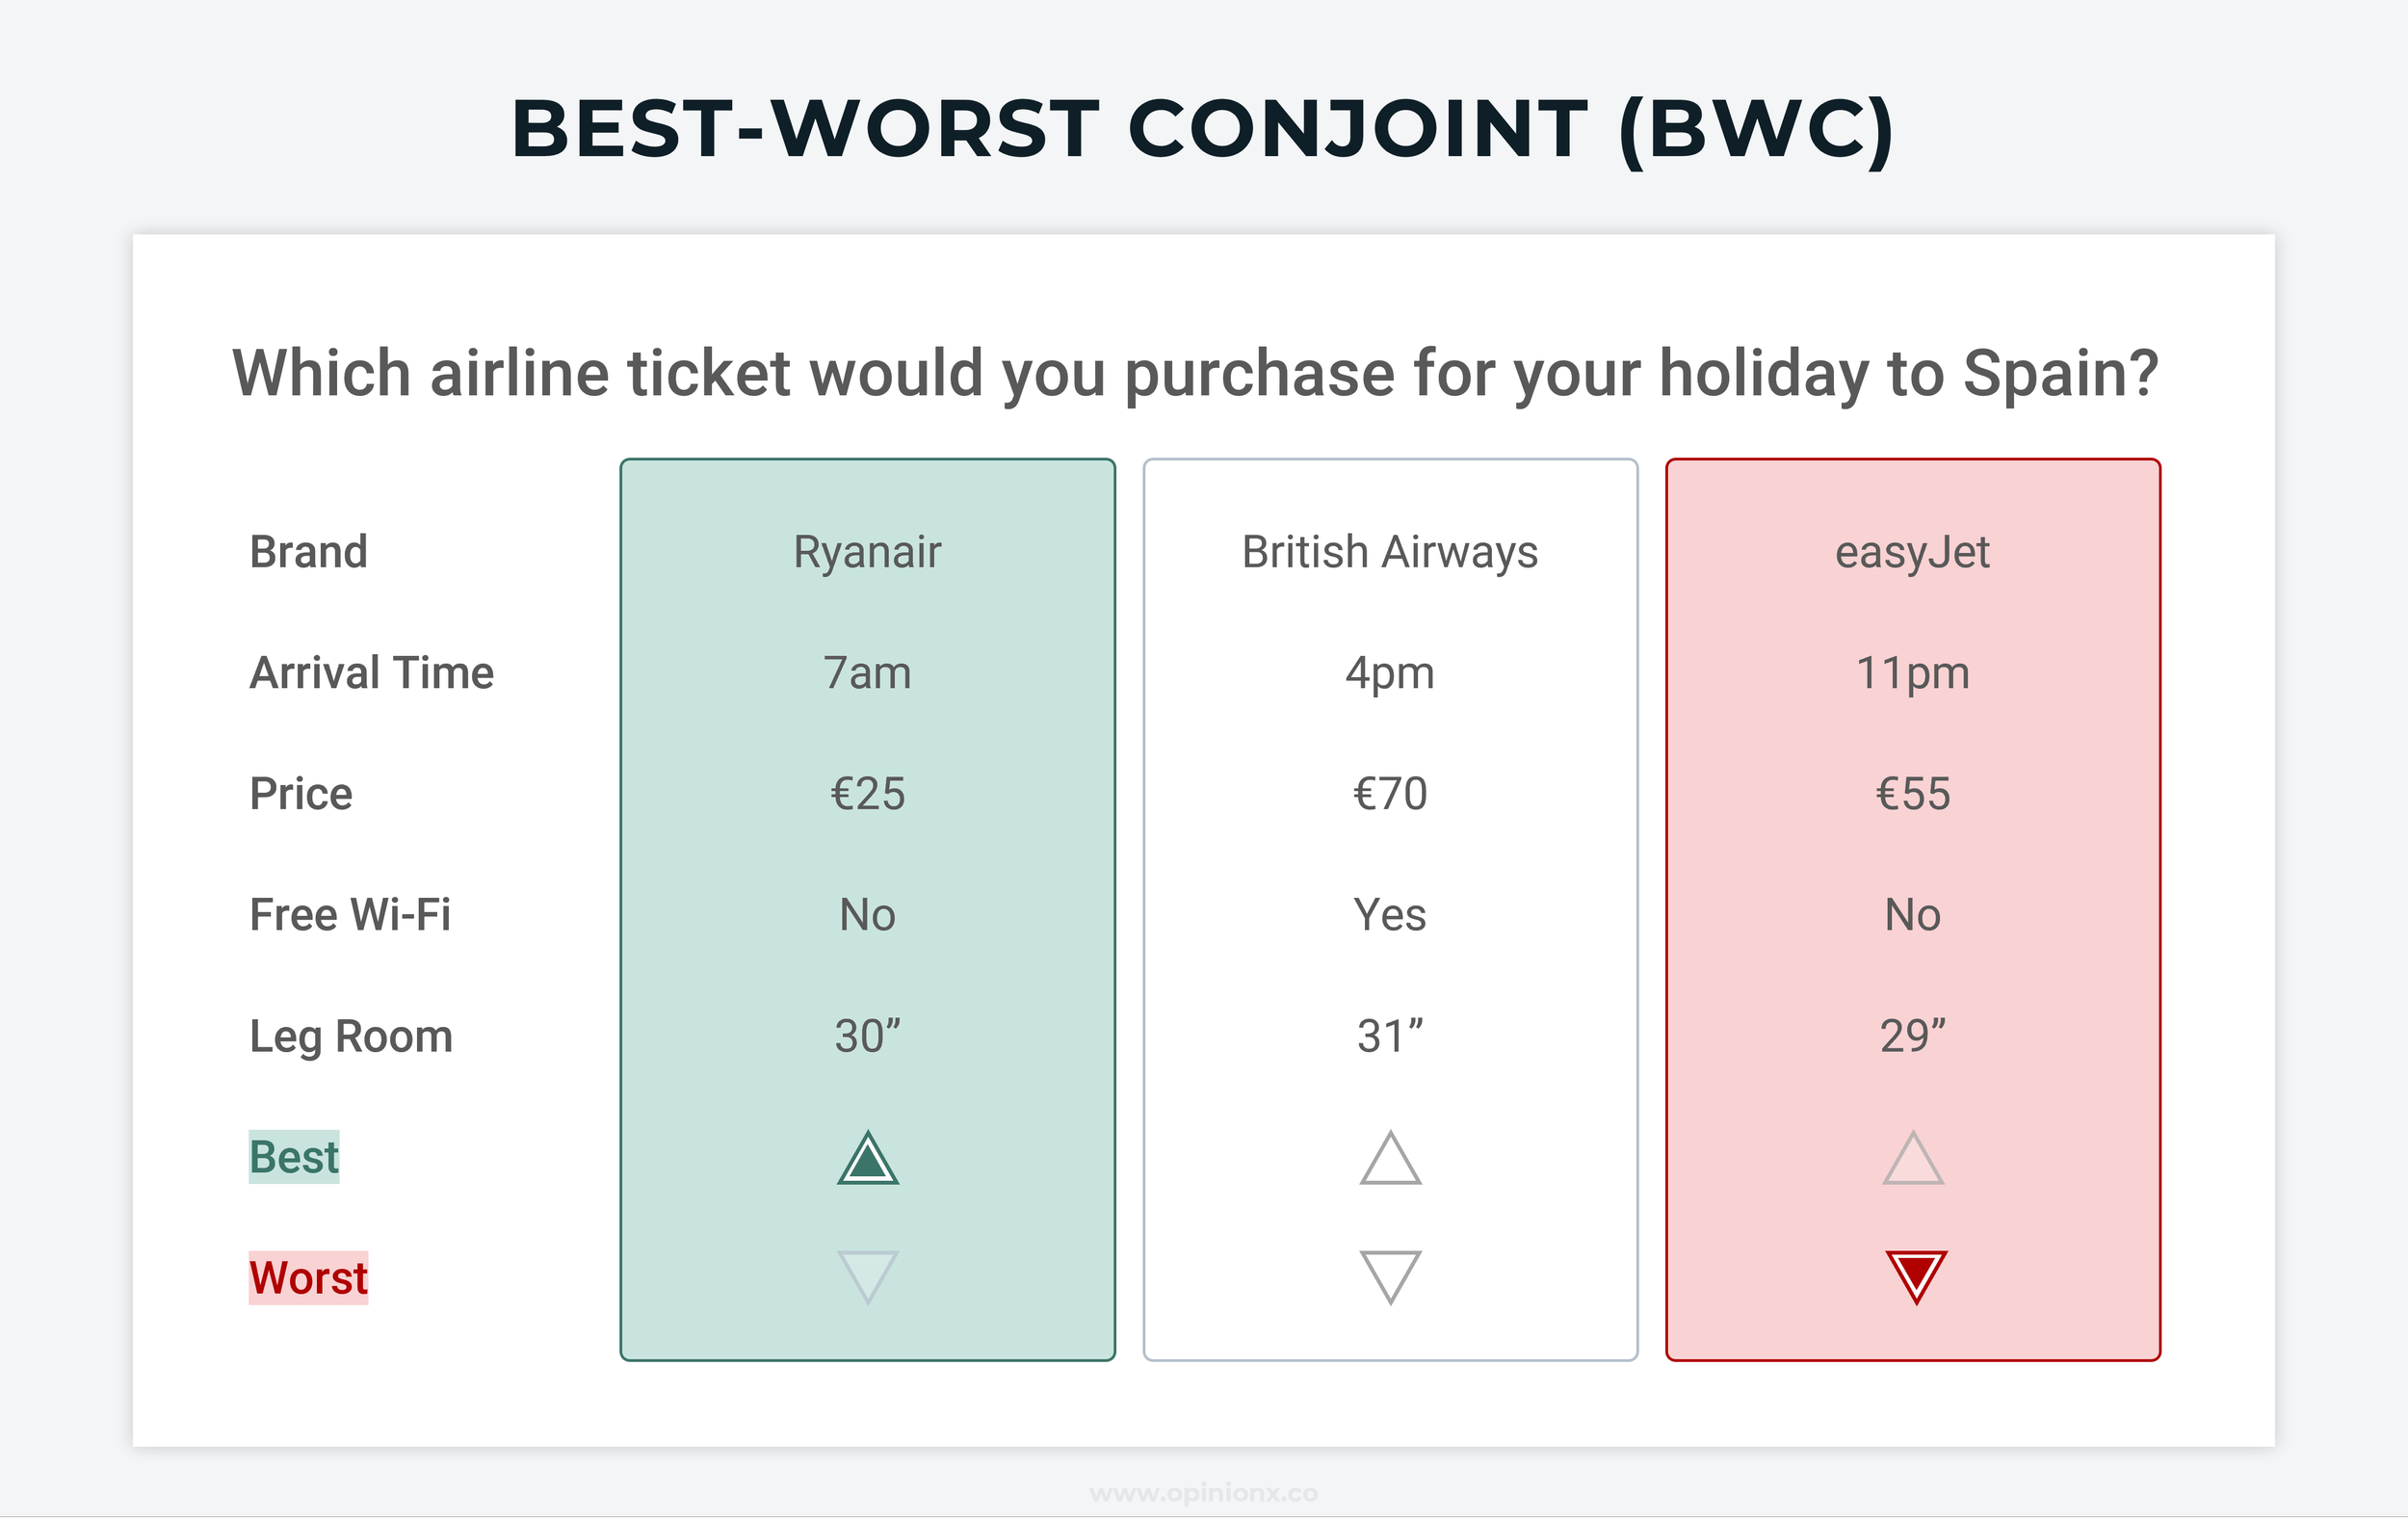
2. Best-Worst Conjoint Analysis (BWC)
Respondents identify the “best” and “worst” options from the set of profiles shown. This approach combines the voting format of MaxDiff Analysis (which is a form of best-worst scaling) with the attribute-based profiles structure of Conjoint Analysis. It requires some extra work from respondents, but collects more data per set of profiles shown. OpinionX does not have a Best/Worst Conjoint format, but it does offer free Best/Worst MaxDiff surveys with single-variable voting options.
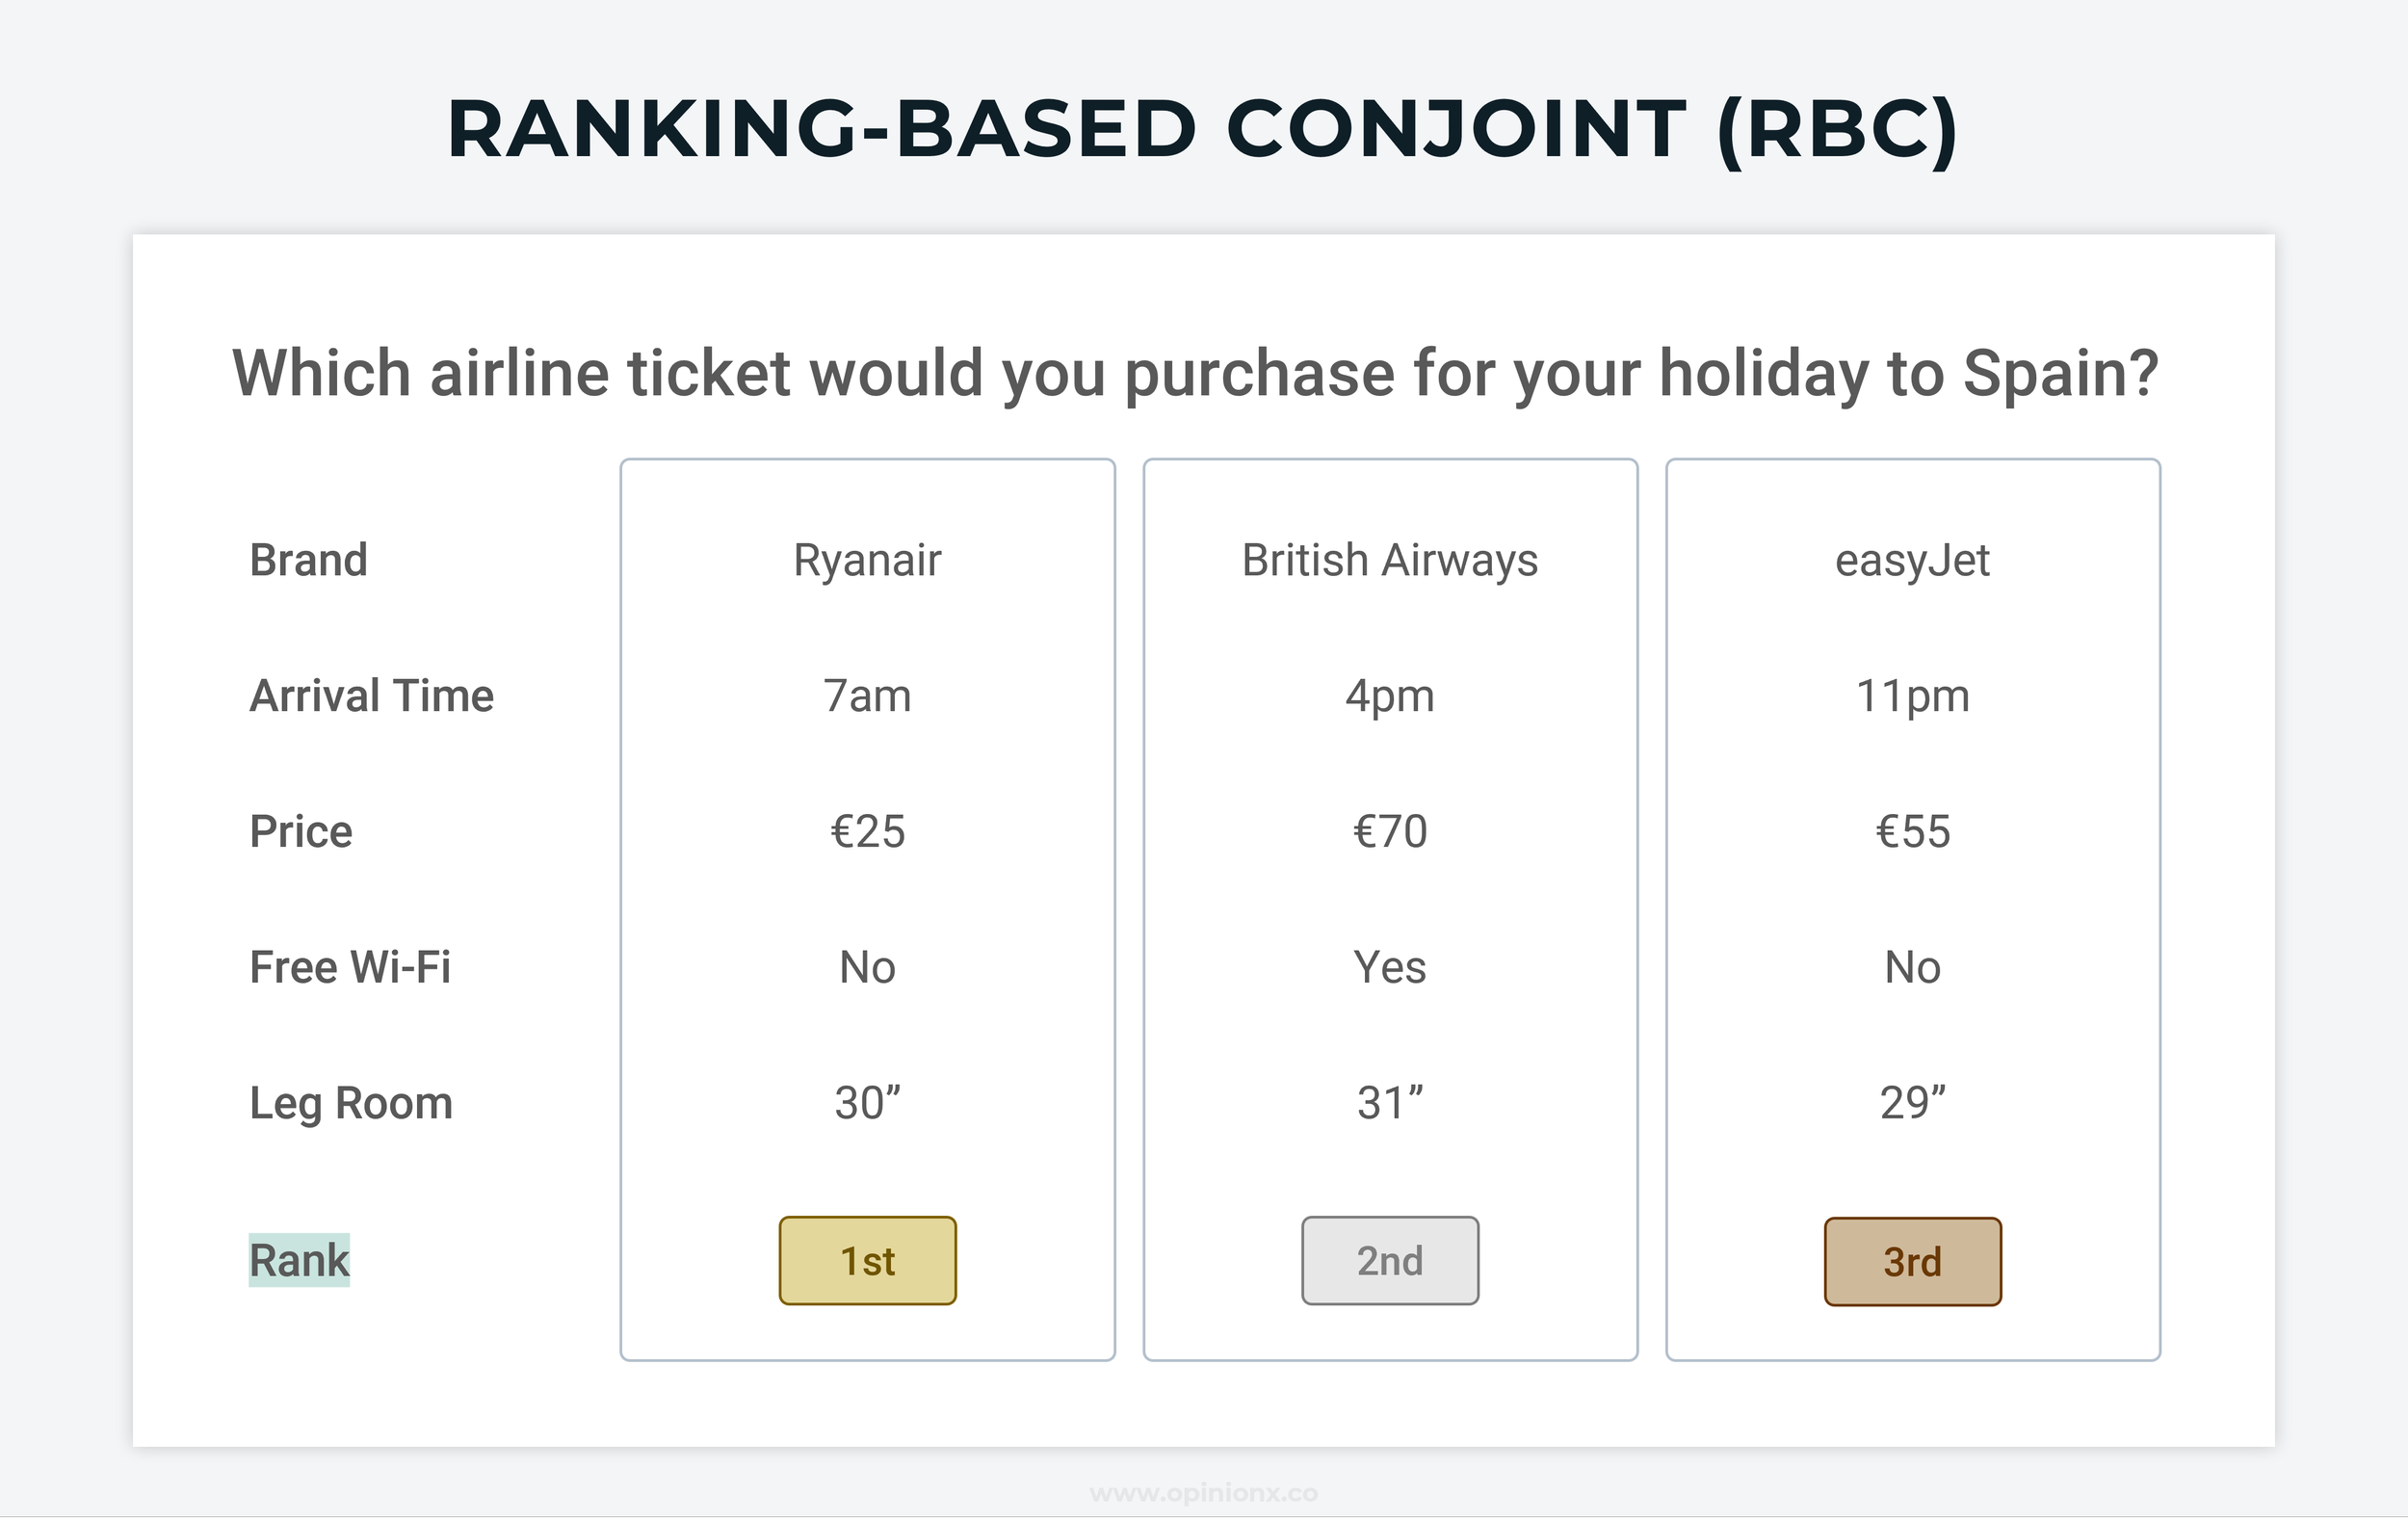
3. Ranking-Based Conjoint Analysis (RBC)
Instead of respondents selecting just one profile or the best/worst options, they rank all the profiles from 1st to last. It uses the format from ranked choice voting, which is one of the best-known survey formats for ranking things, and applies it to conjoint analysis.
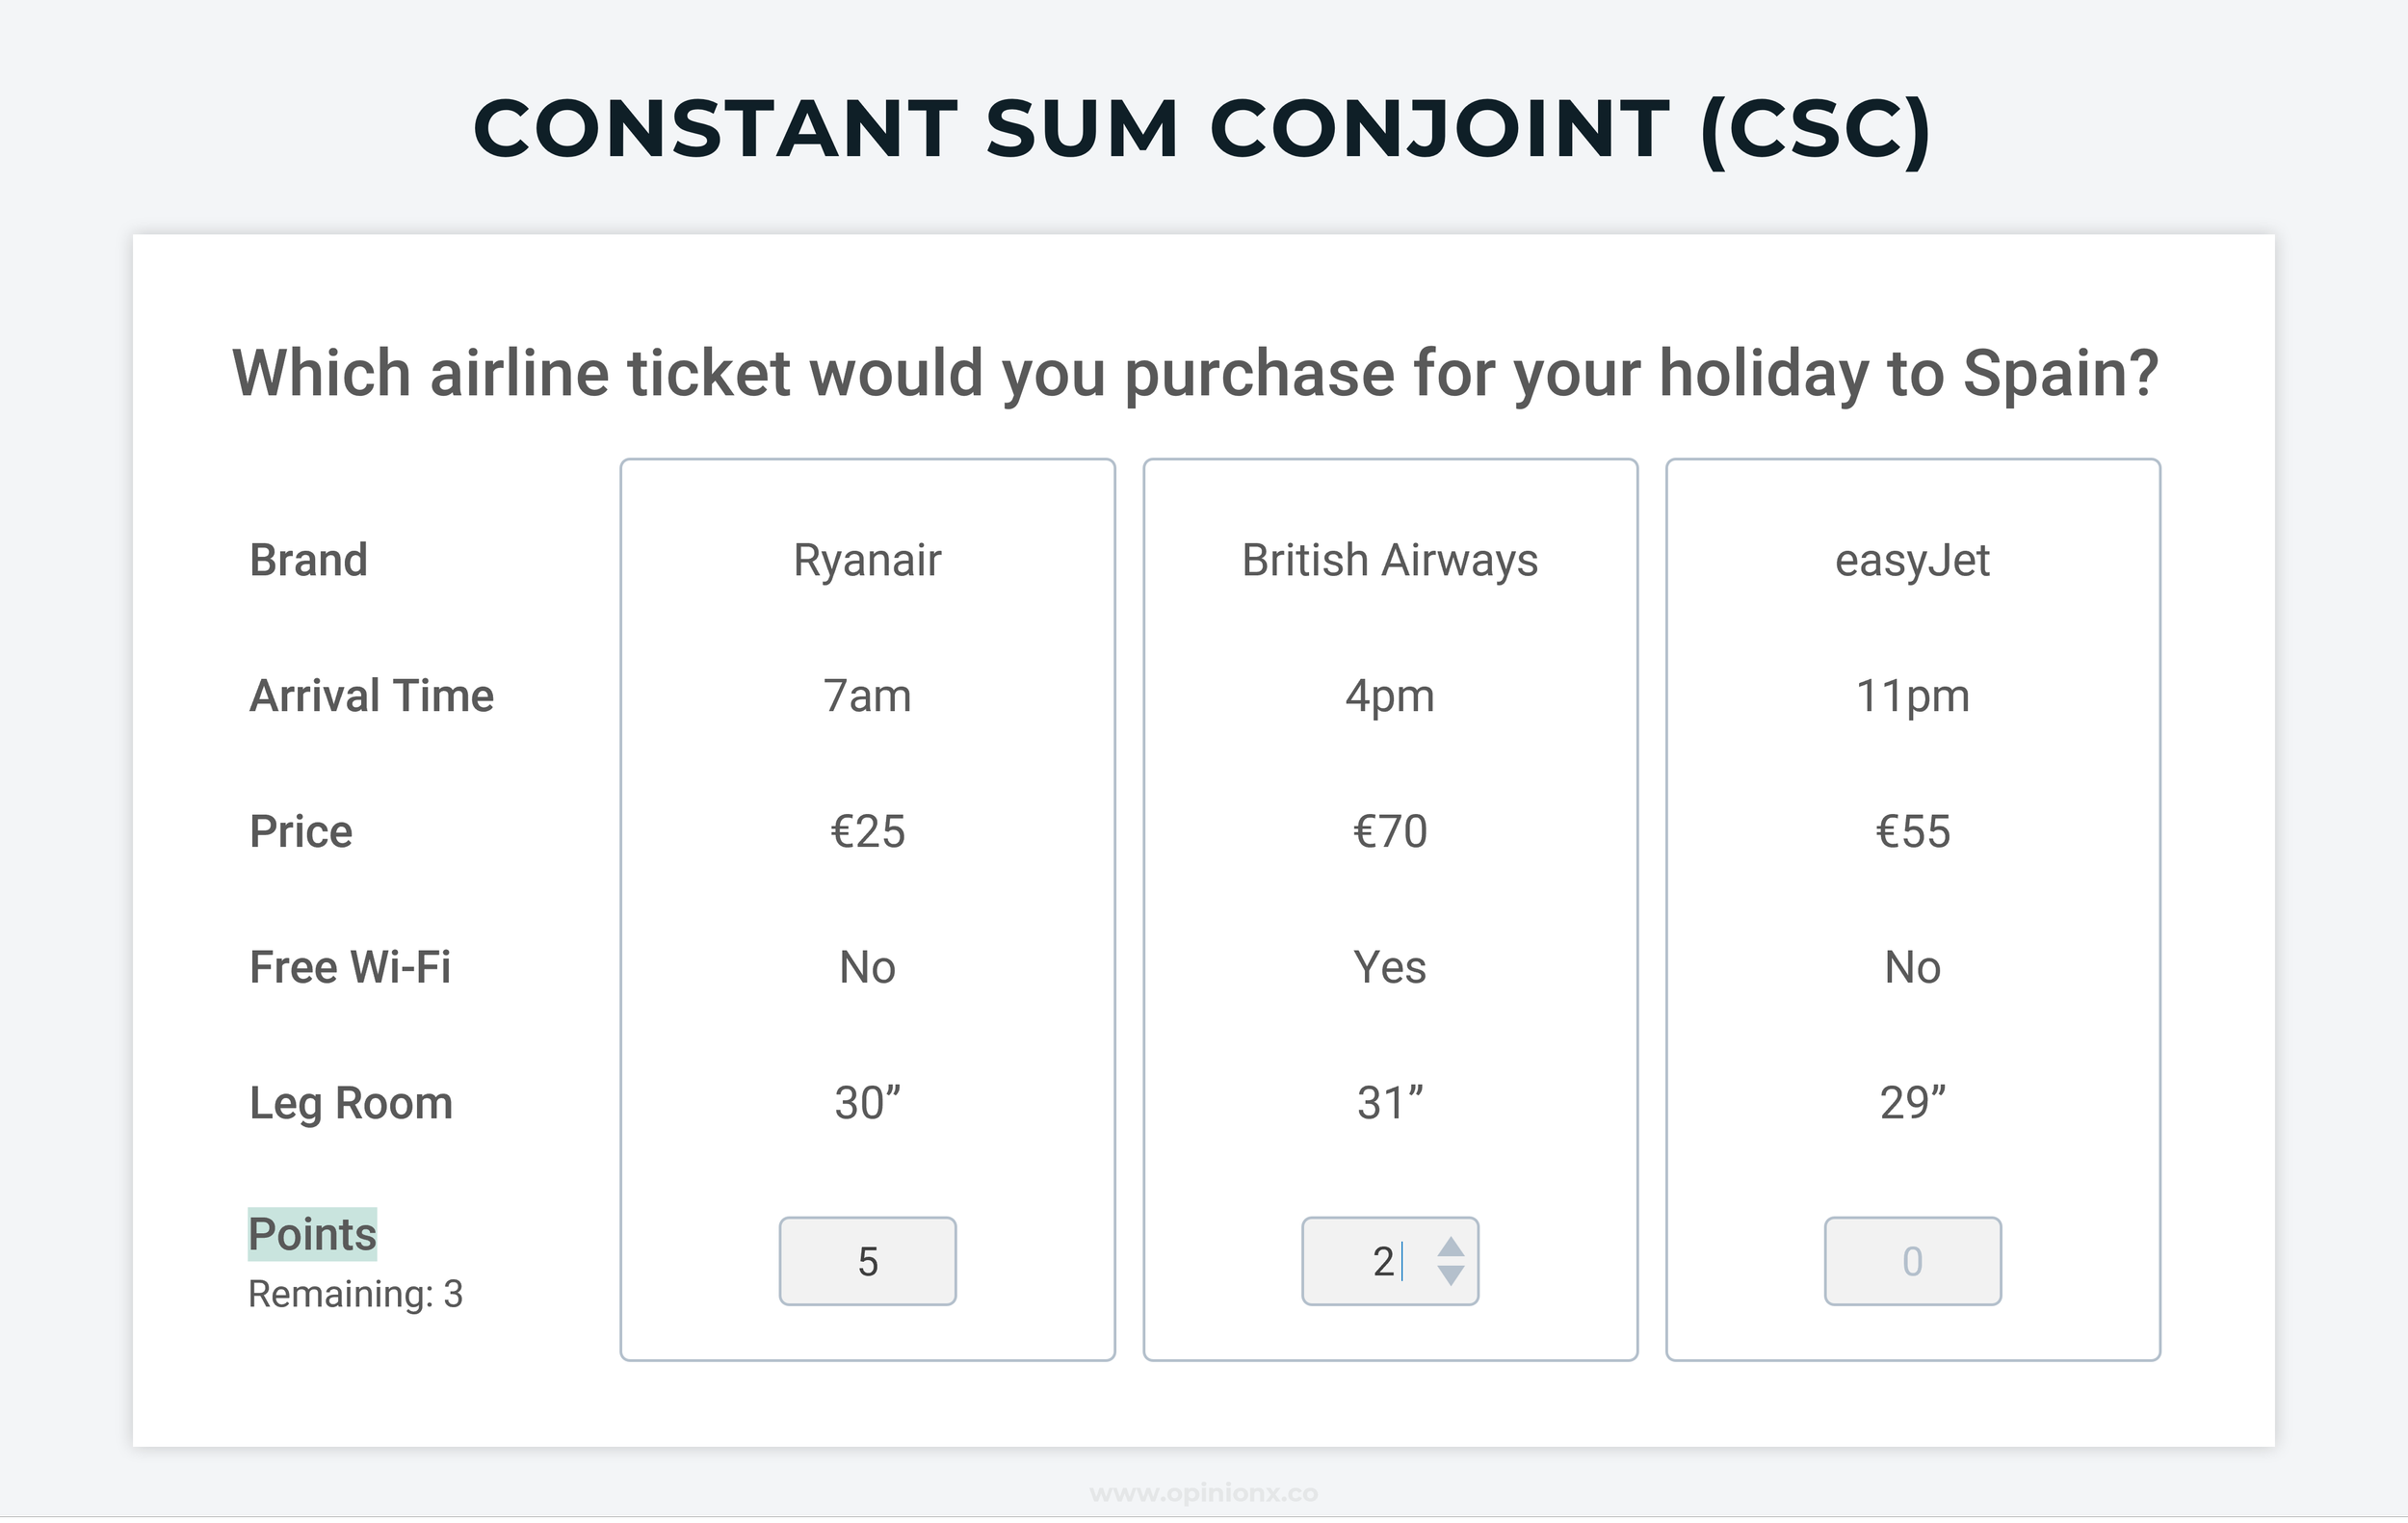
4. Constant Sum Conjoint Analysis (CSC)
Respondents are given a fixed number of points that they can allocate amongst the profiles shown in whatever distribution they choose, allowing them to show the magnitude of their preference towards the profiles shown. This approach combines the Constant Sum (also known as Points Allocation) format of normal ranking surveys with profiles-based voting in Conjoint Analysis.
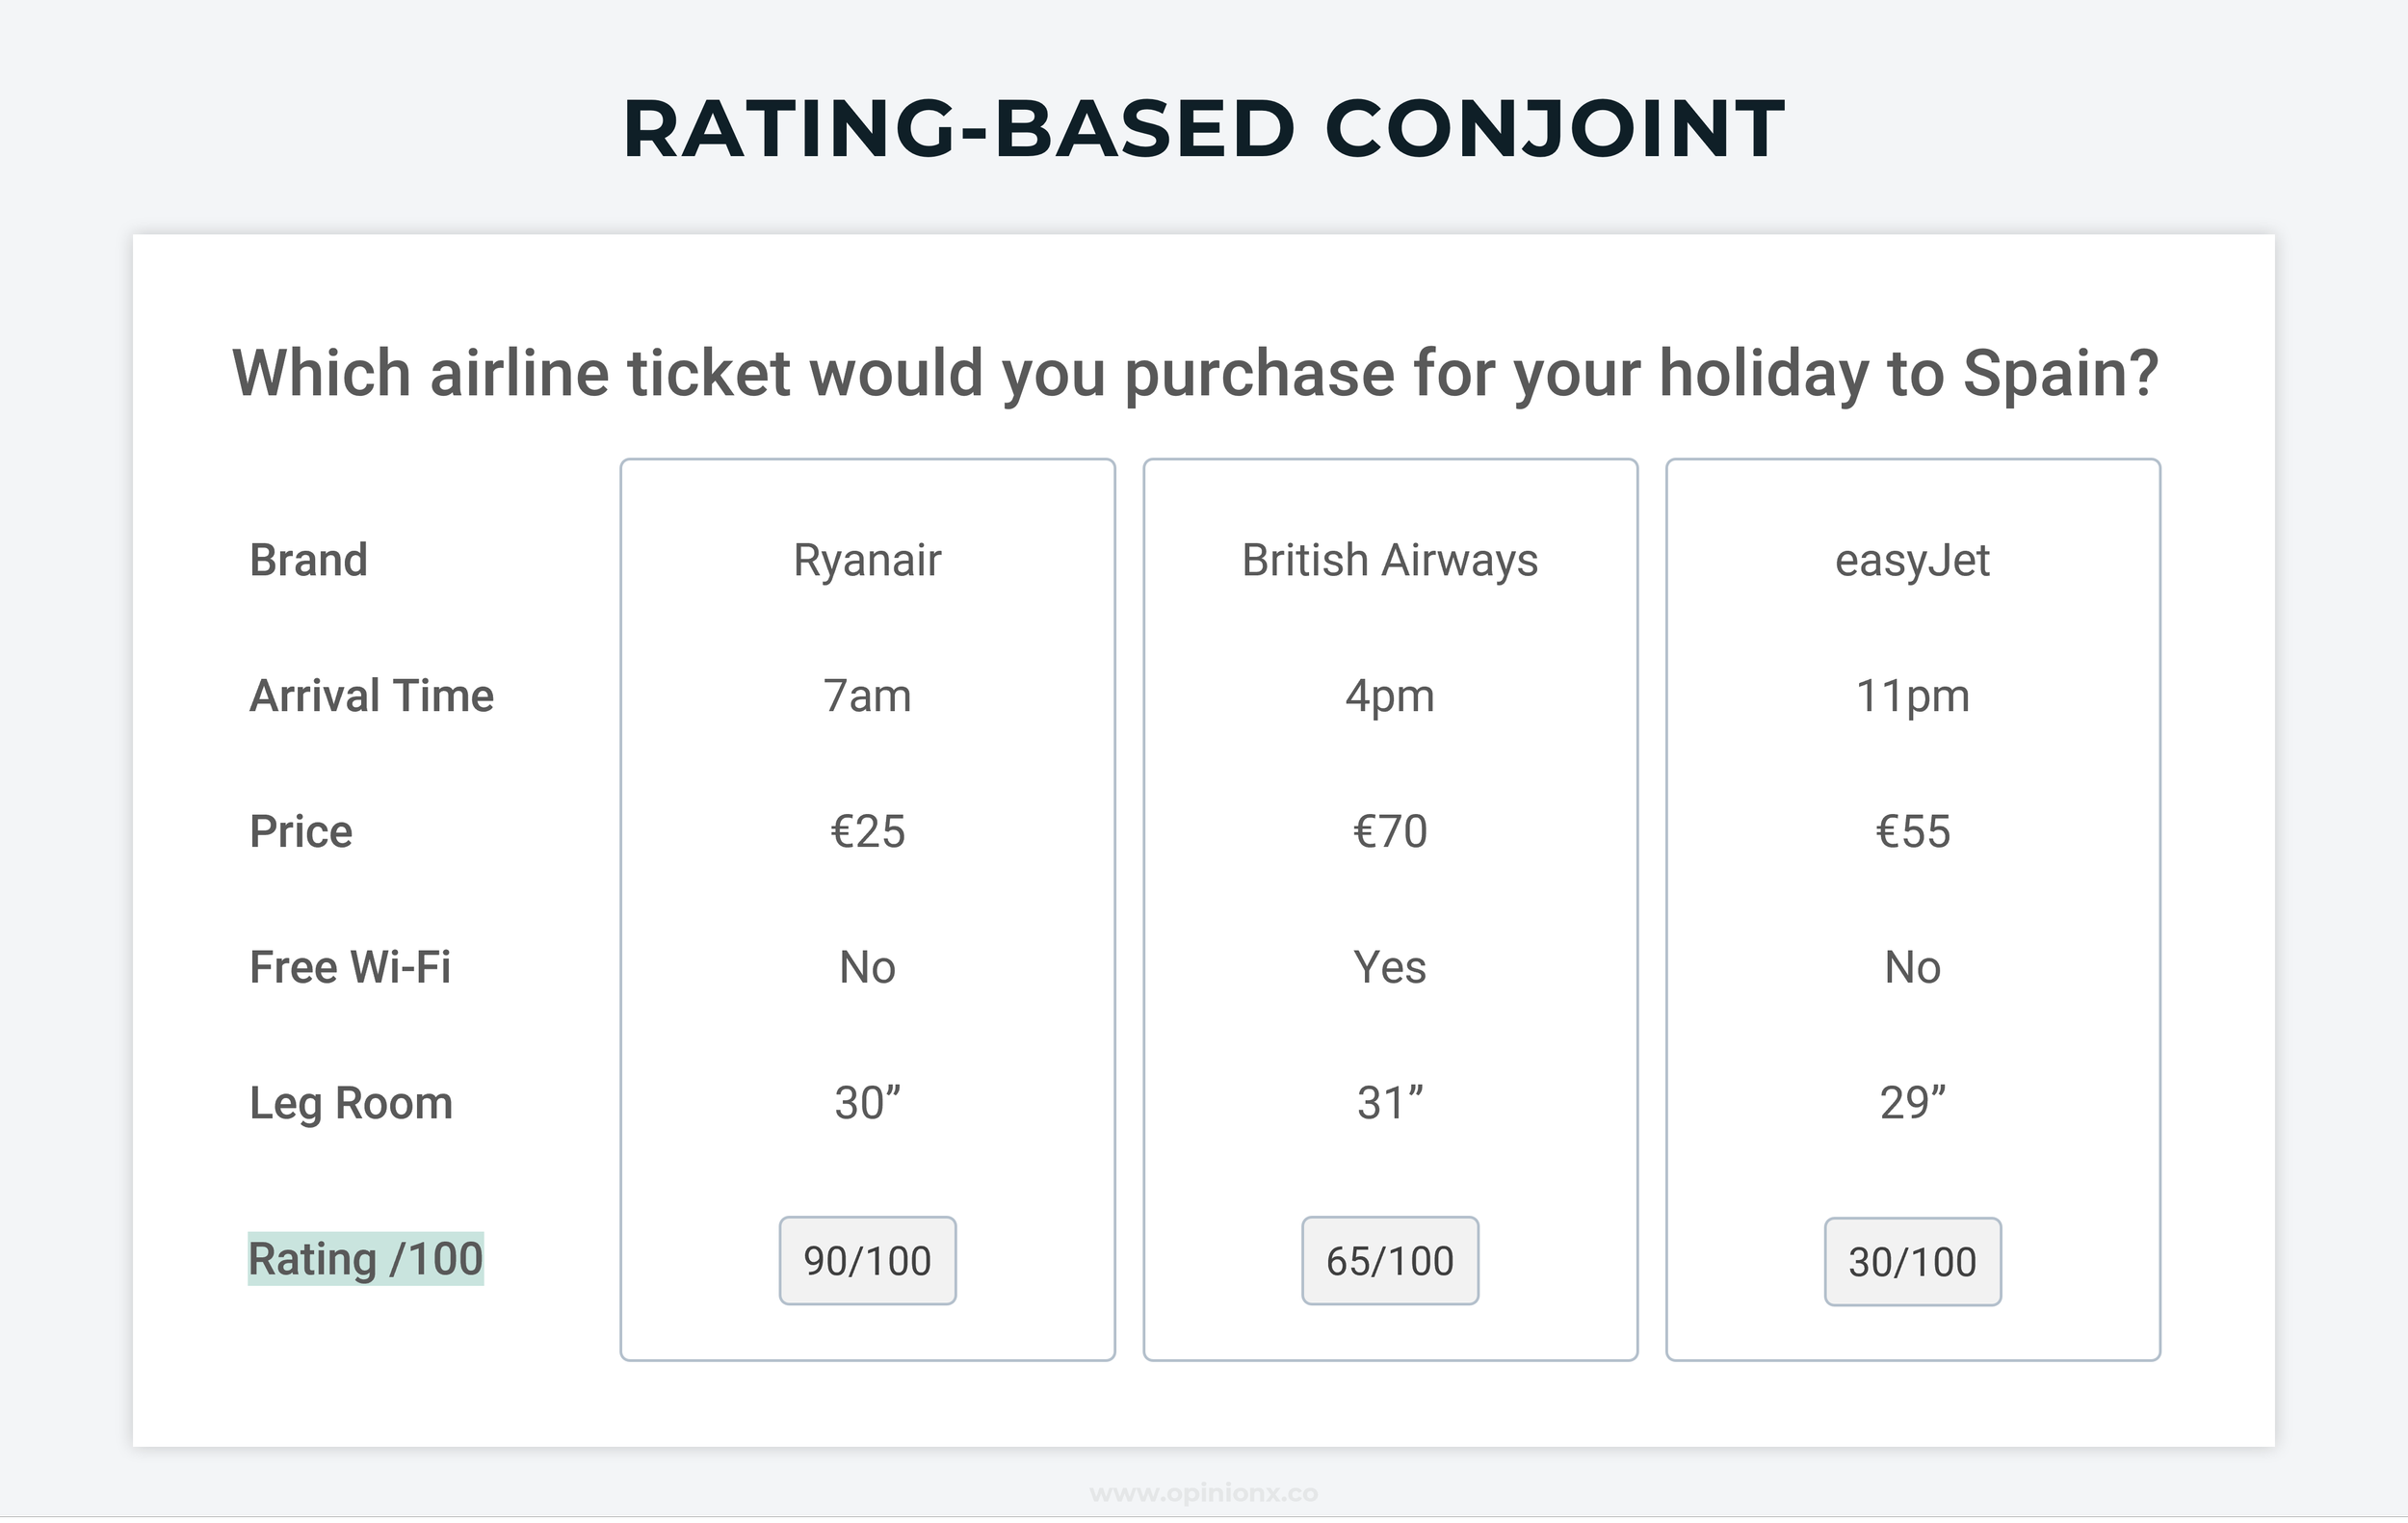
5. Rating-Based Conjoint Analysis
Respondents are asked to rate each profile shown on a scale from 0 to 100. Rating-based approaches are generally not recommended for understanding the relative importance people feel towards a set of options, as respondents tend to use a small range of the available points (eg. giving everything 60-80 points). Rating-based approaches also allow for ties, producing a higher proportion of useless data when it comes to calculating relative importance.
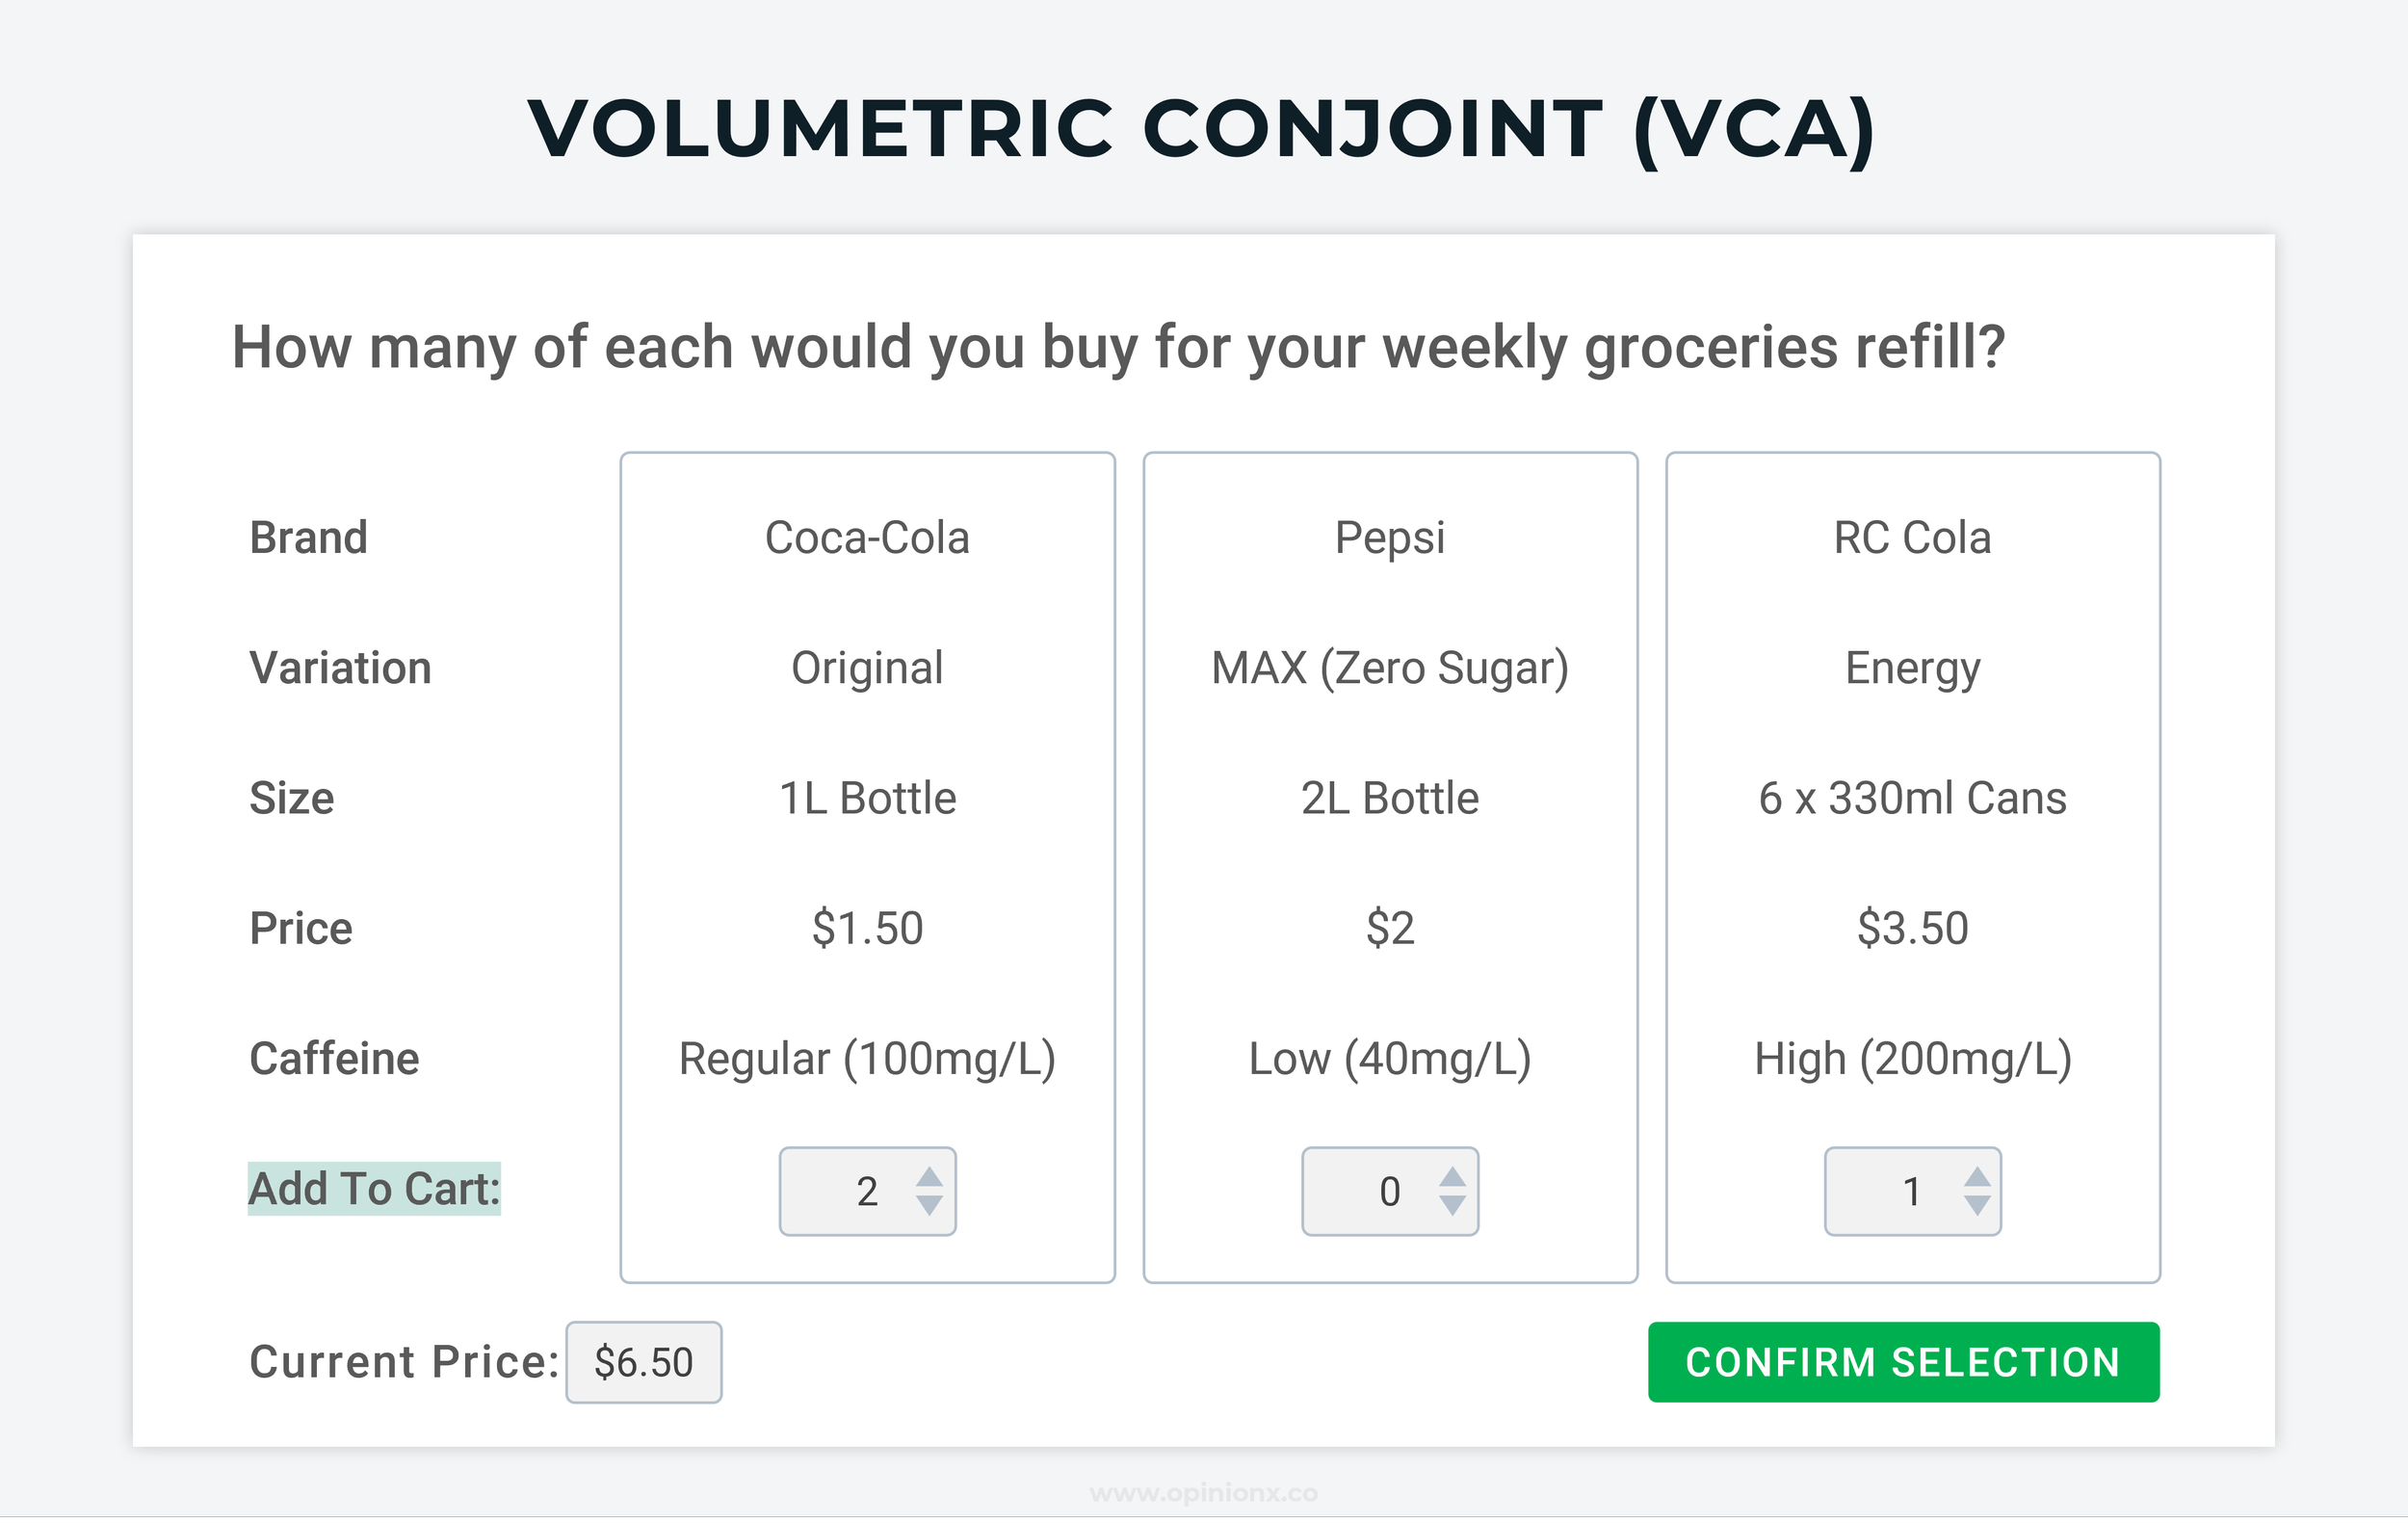
6. Volumetric Conjoint Analysis (VCA)
Respondents are given a scenario or task and told they can purchase as many of each product profile as they choose. Volumetric conjoint allows pricing to become a more realistic constraint in how respondents choose profiles — particularly when a limit is put on the budget they can spend on each set of profiles. This is similar to how a traditional points voting survey or constant sum question works.

7. Full-Profile Conjoint Analysis (FPC)
Full-Profile Conjoint follows a similar format to Choice-Based Conjoint, except the attribute levels on each profile are a static set of values that do not change. In this sense, it’s more like Pairwise Comparison or MaxDiff Analysis where respondents vote on single options rather than variable-based profiles. FPC is often used when you want to explore the overall attractiveness or appeal of different product configurations as a whole.
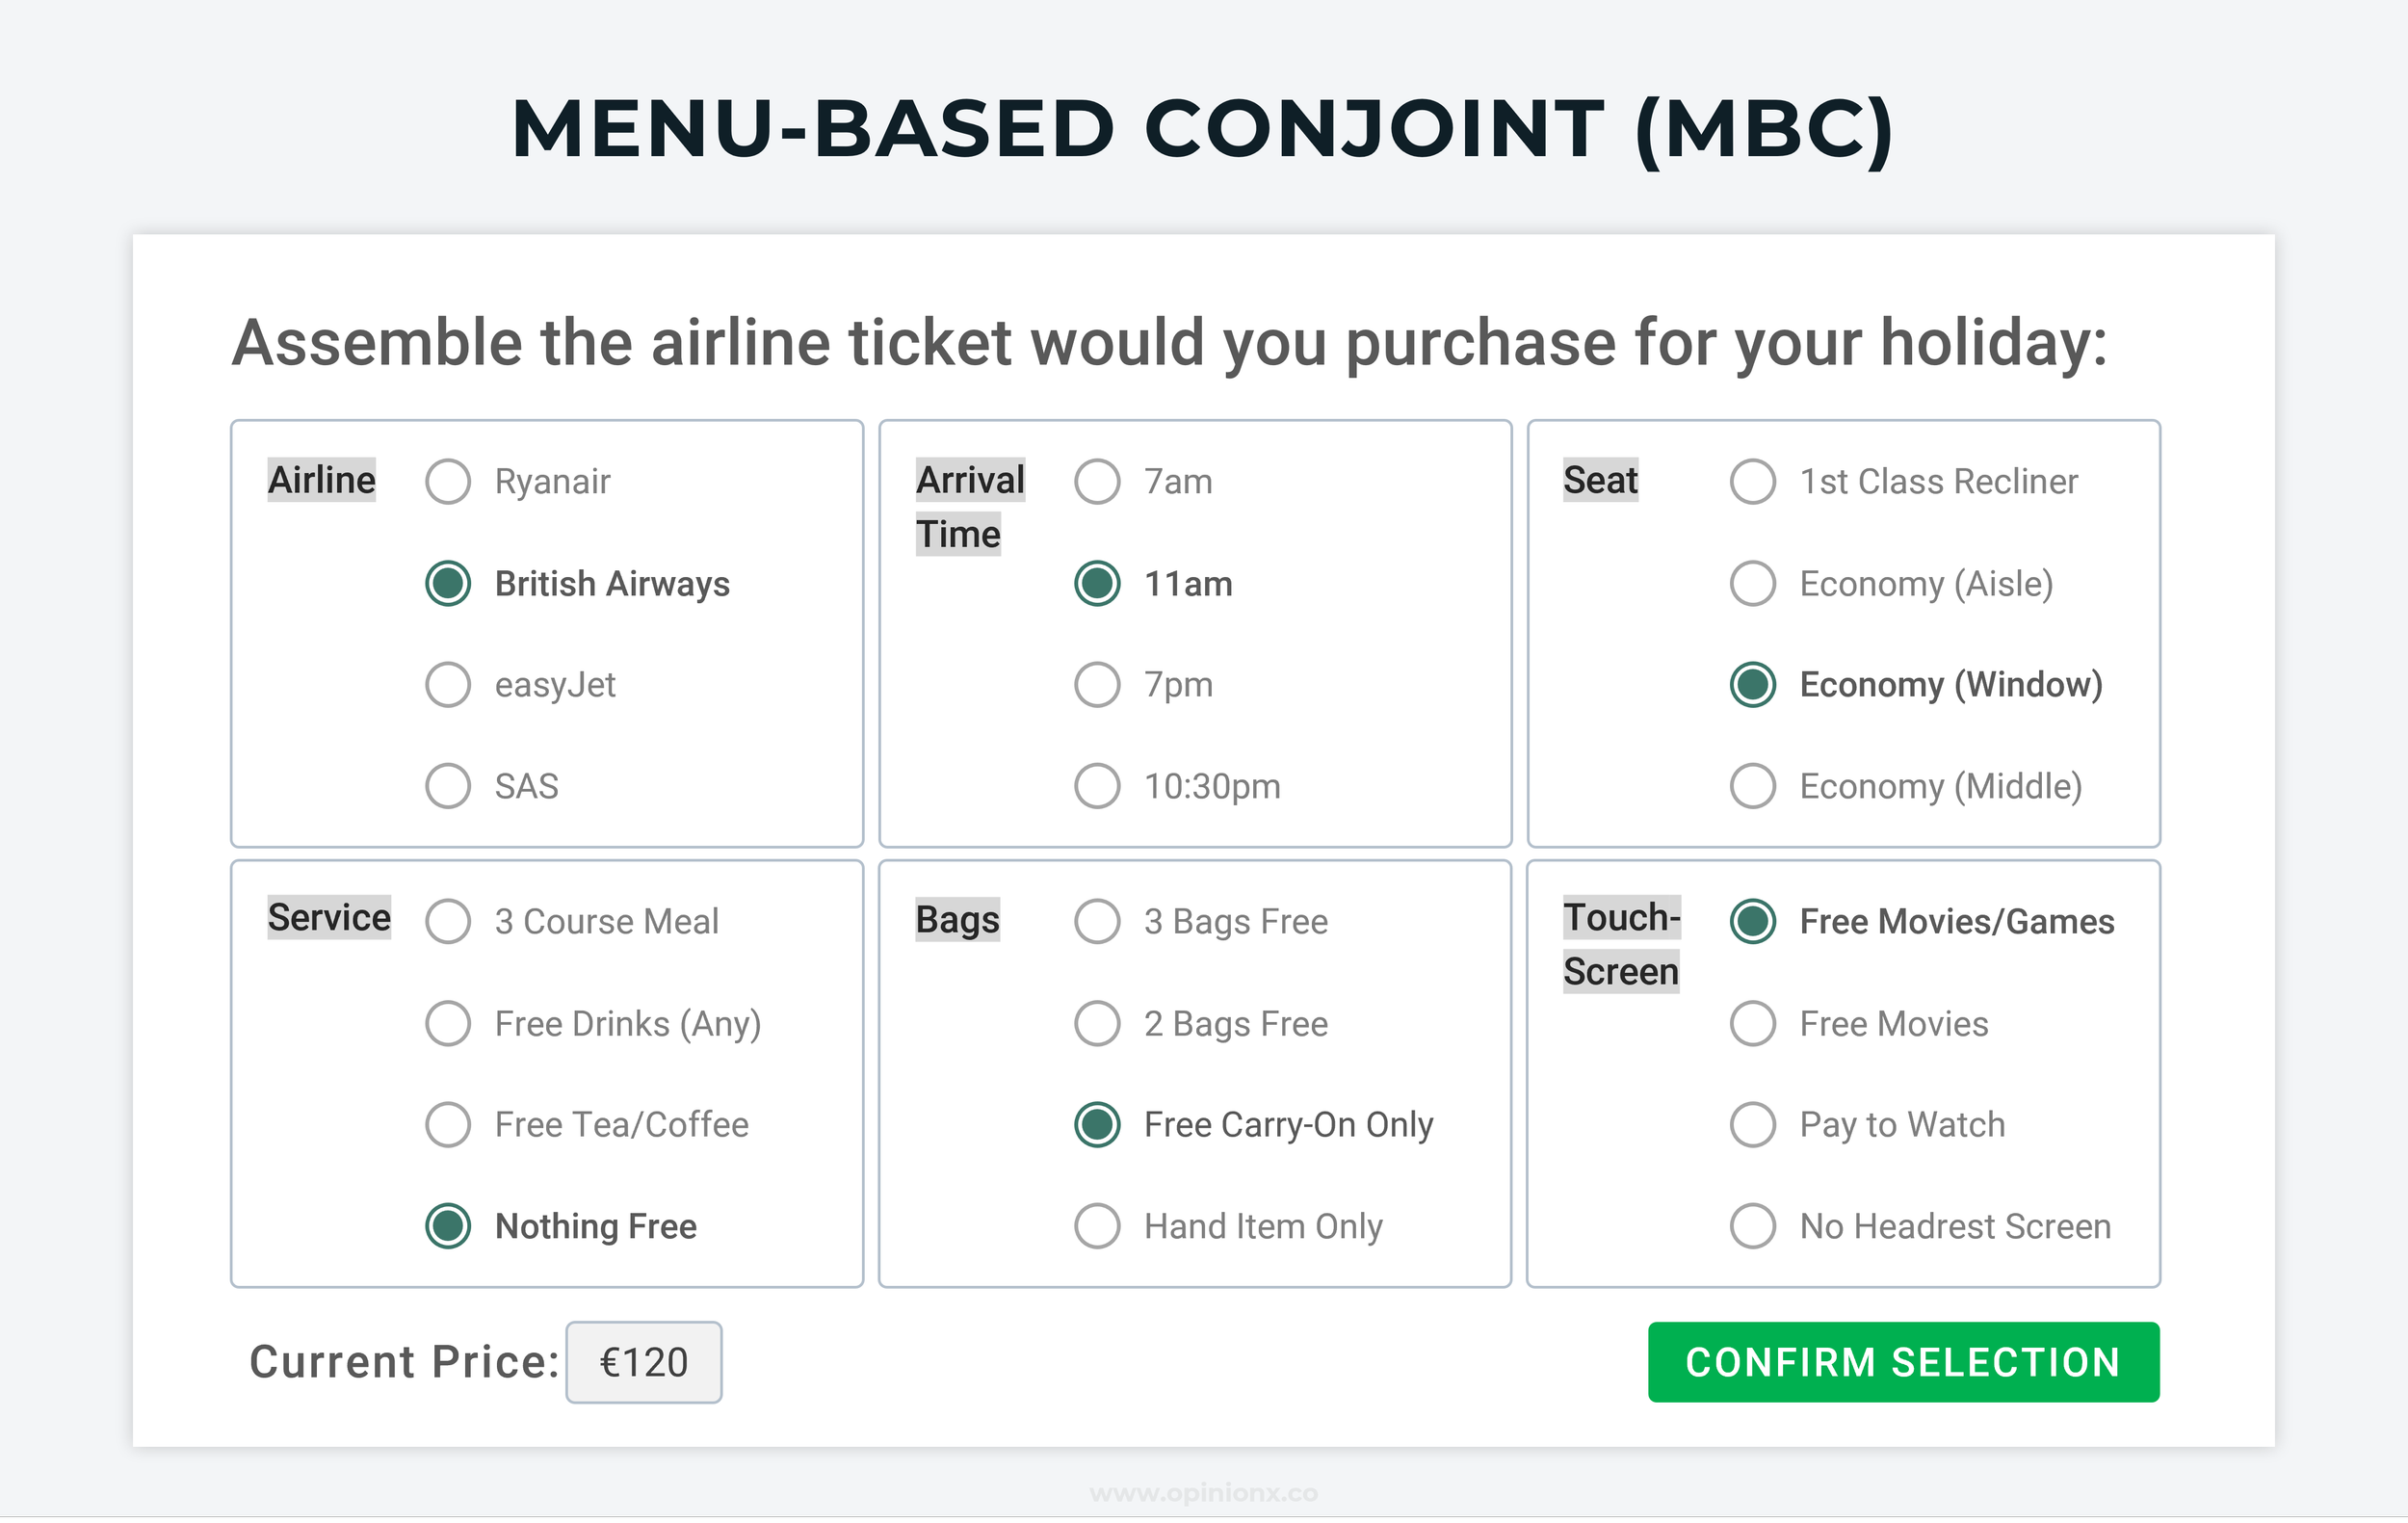
8. Menu-Based Conjoint Analysis (MBC)
Respondents are then given a series of menus where they can build their preferred product or service by selecting one level from each attribute. The attributes available in each menu vary to test which attributes and levels have the highest relative importance to respondents.

9. Self-Explicated Conjoint Analysis (SEC)
The Self-Explicated Conjoint isn’t really a conjoint analysis at all — it uses the same setup as a conjoint, where you assign a number of attributes (categories) and the range of “levels” (options) for each attribute. But then it asks the respondent to rank the levels altogether using a standard choice-based ranking format like points allocation, constant sum, maxdiff analysis, or ranked choice voting. Some other formats of Self-Explicated Conjoint use slightly different approaches, but overall it generally just breaks attributes down into attribute-by-attribute ranking exercises.

10. Dual-Response Conjoint Analysis (DRC)
Respondents complete a normal choice-based conjoint question initially (usually following the choice-based format), and then a follow-up question appears based on their choice. This breaks each set of profiles down into two data points — the selection of profile measures attractiveness, while the follow-up question measures likelihood of purchase.
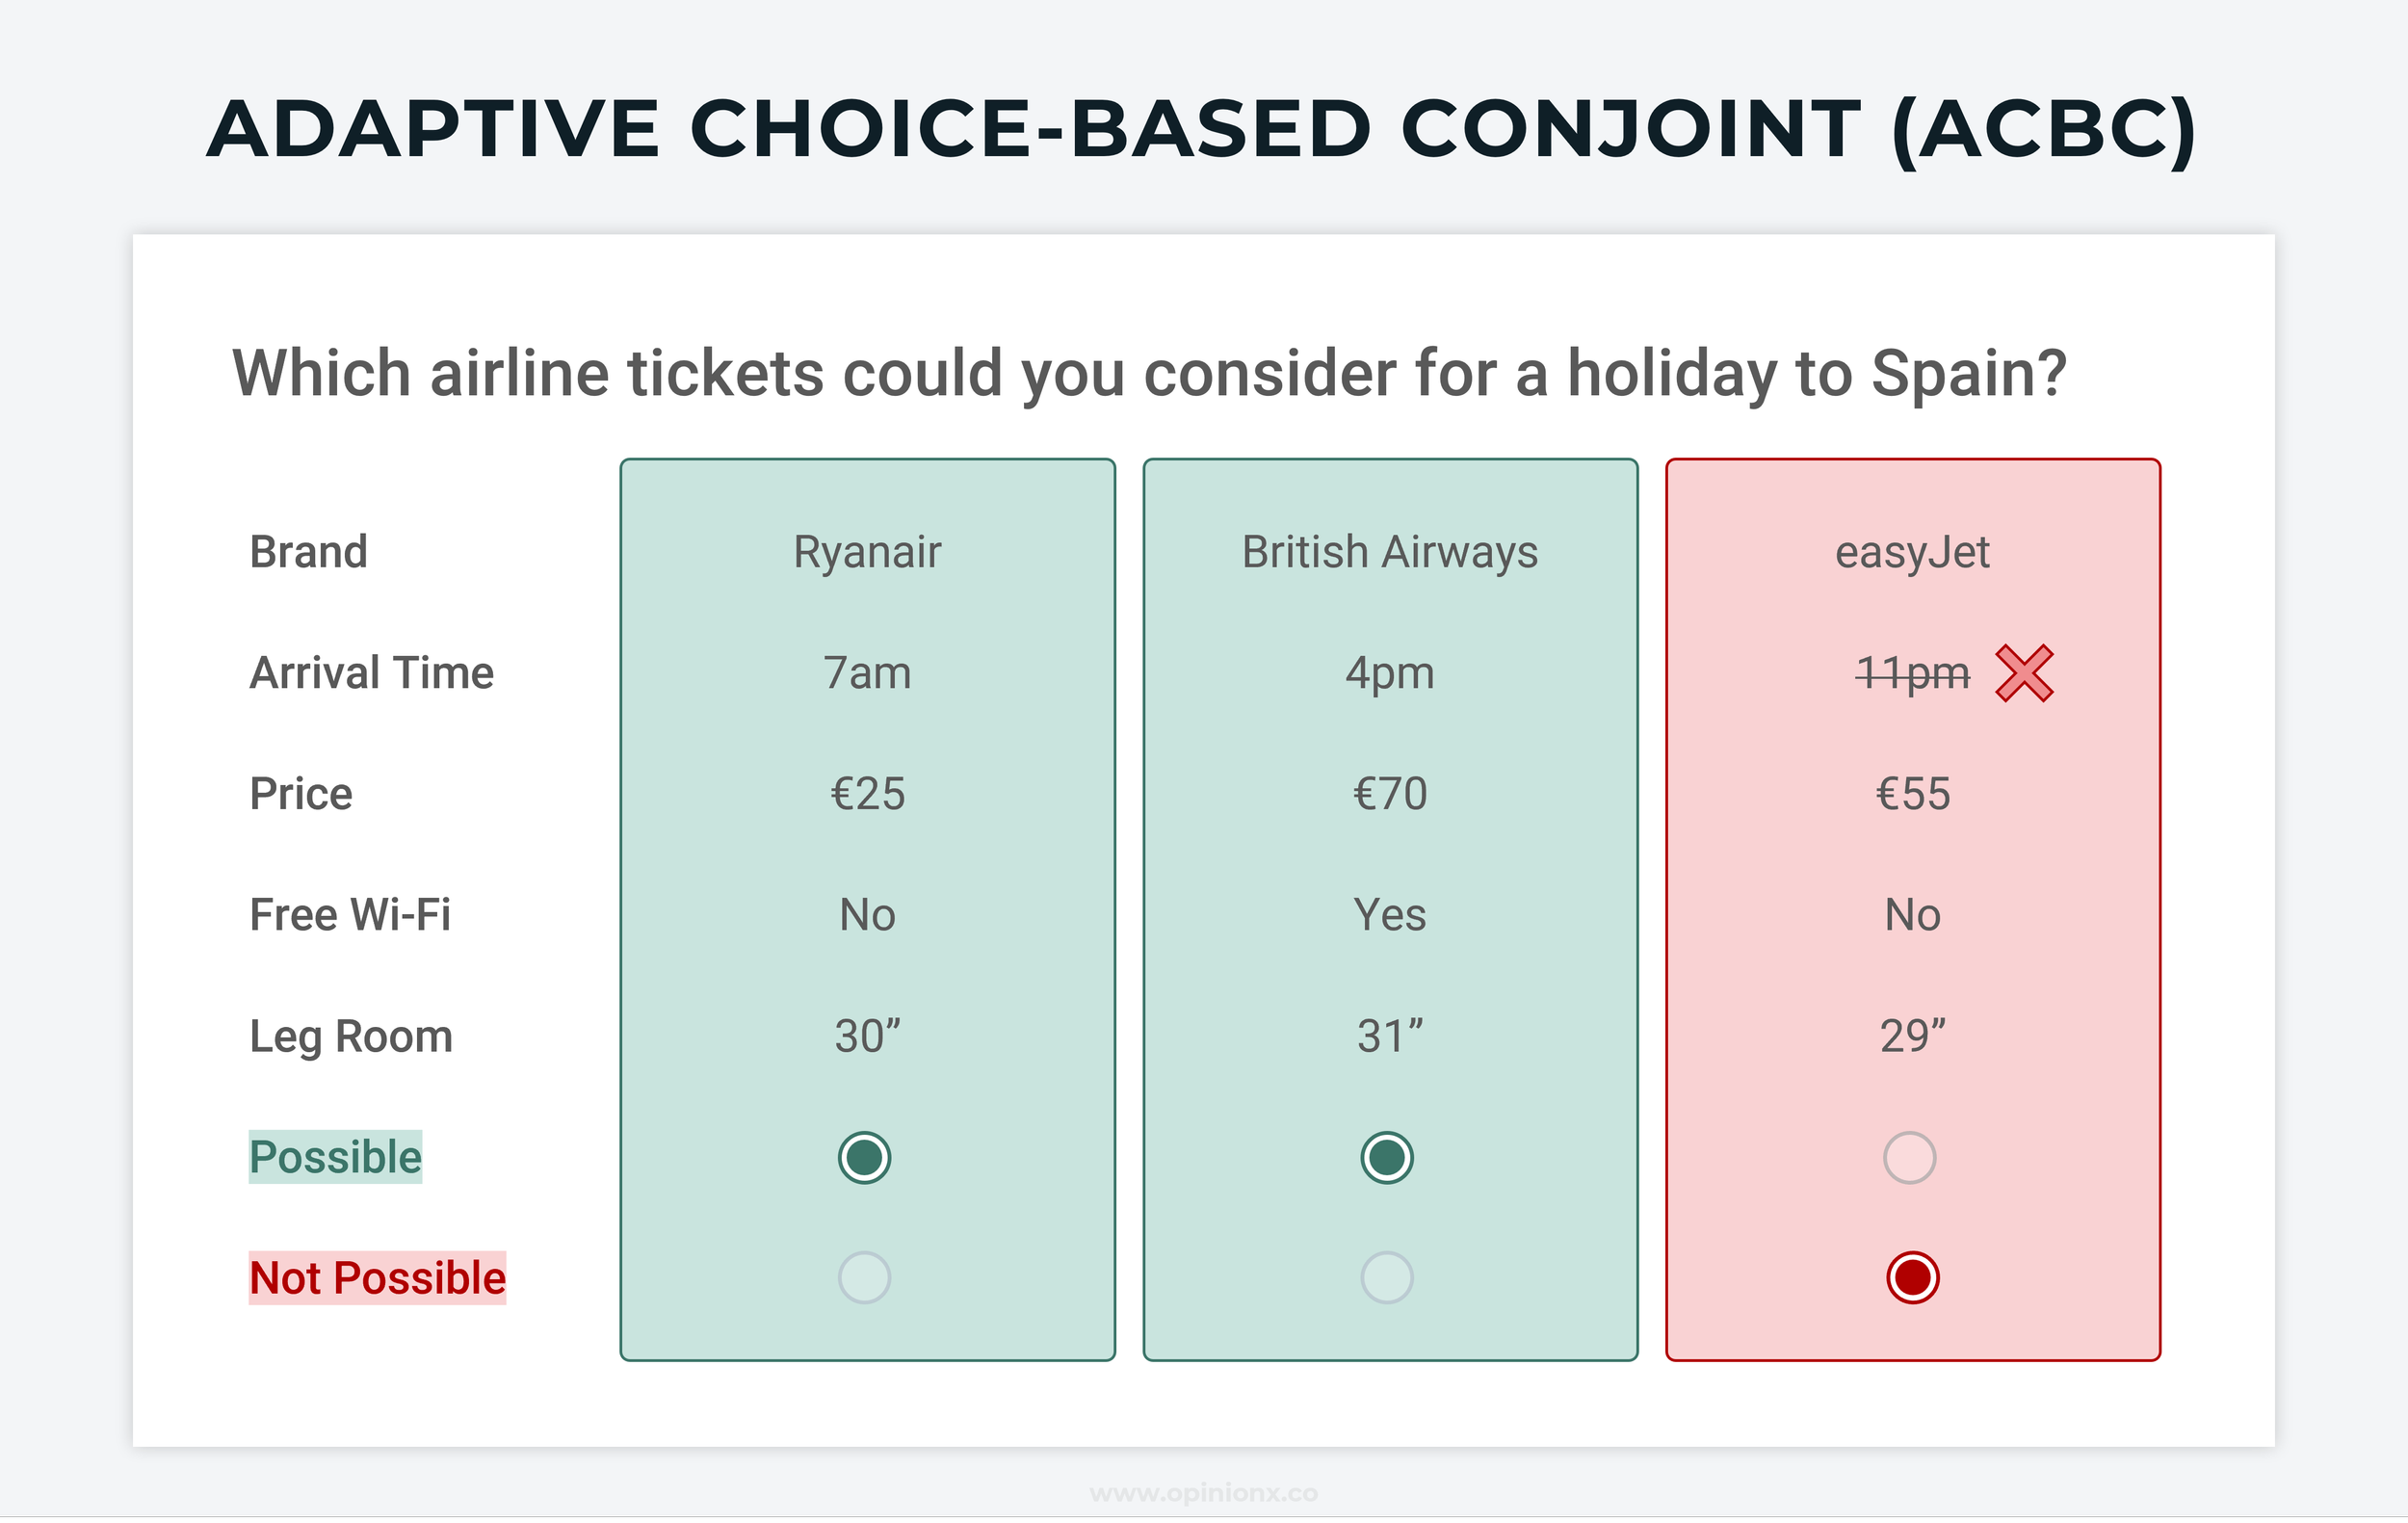
11. Adaptive Conjoint Analysis (ACBC)
Adaptive conjoint surveys learn from respondents’ choices and change what they show next. This can either be done through screening questions (ranking, rating, duel-response, etc.) or simply by learning from standard choice-based profile selection. You can apply this self-learning to any conjoint method, but Adaptive Choice-Based Conjoint (ACBC) is the most common adaptive method used. ACBC surveys take considerably longer for respondents to complete, are a lot harder to set up, and are much more expensive as you are always going to require expert support to design and analyze an adaptive conjoint survey.

12. Time-Series Conjoint Analysis (TSC)
Time-Series Conjoint is not actually a different format for asking conjoint questions — it is a different way to analyze conjoint results. A time-series analysis looks at respondents in “waves” based on when they completed the survey, helping researchers understand how preferences are changing over time.
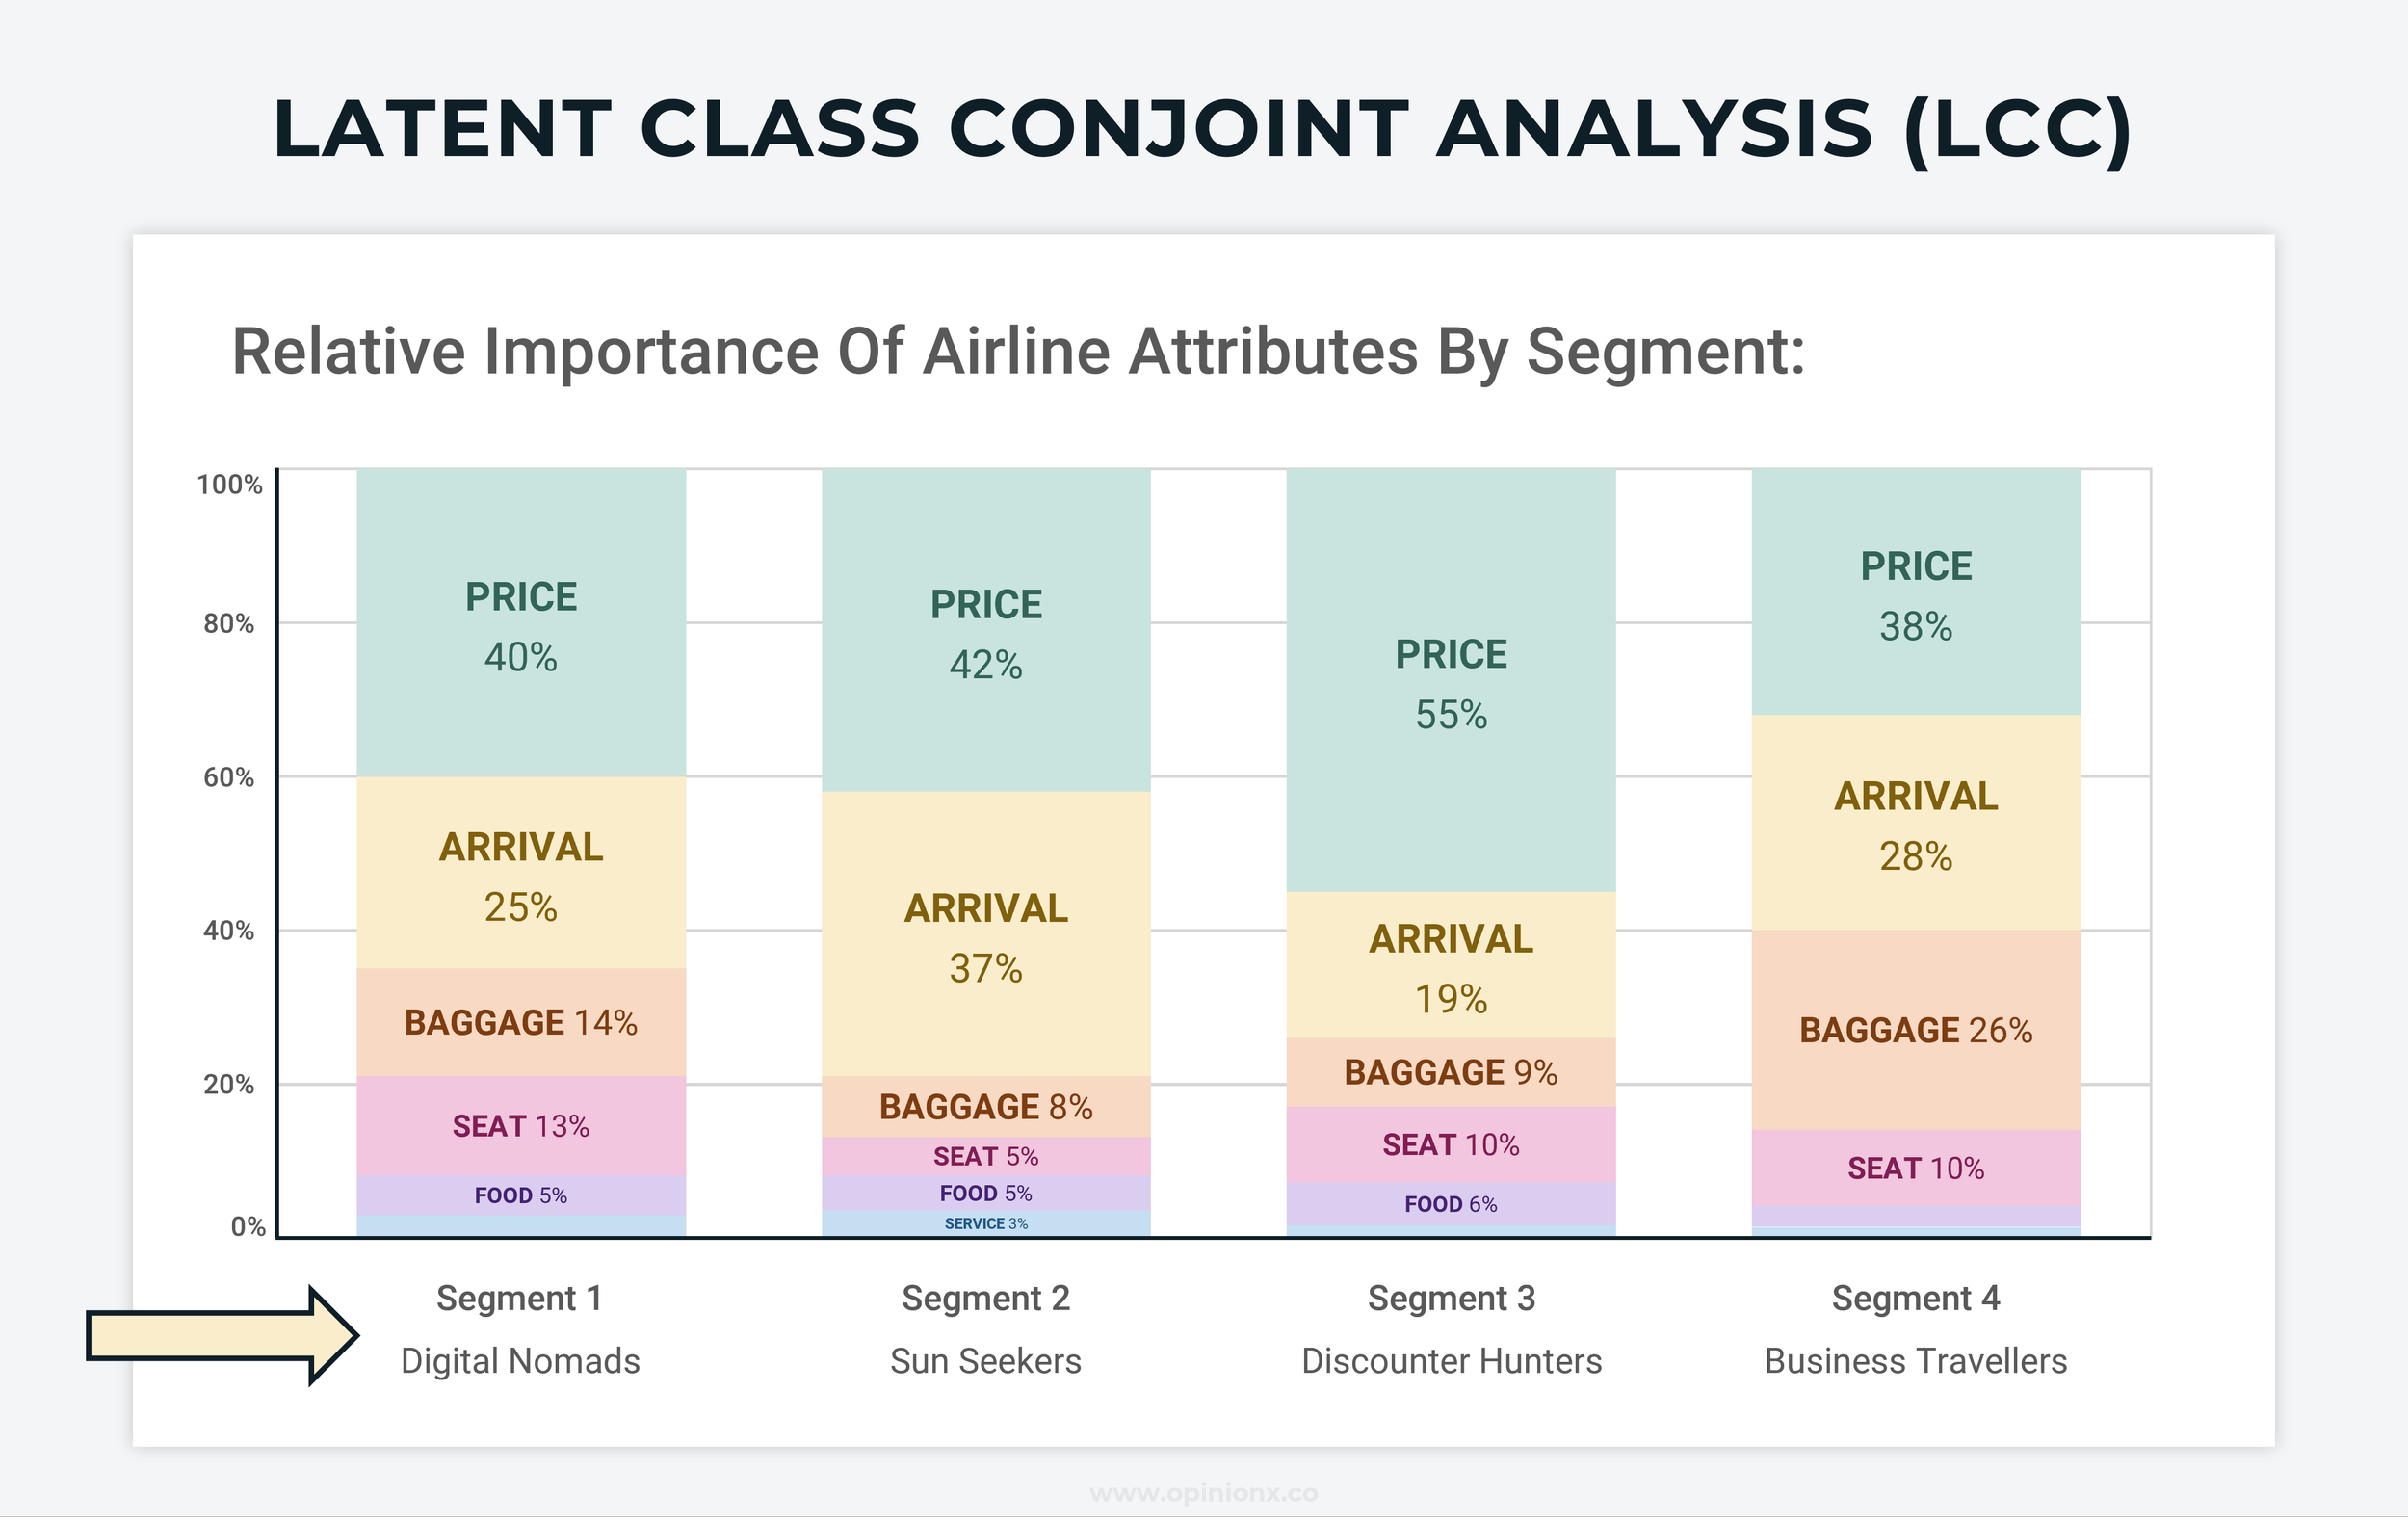
13. Latent Class Conjoint Analysis
Latest Class Conjoint Analysis is not a survey format, it’s an approach to analyzing conjoint results. Latent Class is a way of looking at patterns in voting data that can be used to segment respondents into groups with similar preferences. This is a form of segmentation analysis (eg. needs-based segmentation).
Alongside offering free conjoint analysis surveys, OpinionX comes with advanced segmentation and filtering analysis features on its paid tiers. These analysis features automatically calculate segmented results for your conjoint surveys, enabling teams to conduct Latent Class Conjoint Analysis without the need for any expert (expensive!) data scientists.
— — —
Use Cases: When to Use Conjoint Analysis Surveys
Research projects that simulate a purchase decision are the best fit for a conjoint analysis survey. This is why conjoint analysis is commonly used in pricing research, whether to help design the best possible pricing plans or to figure out which combination of features will generate the best potential market response for your new product.
Before covering some common conjoint analysis use cases in more detail, it’s important to know when not to use conjoint analysis. Conjoint surveys should ideally meet all five of these criteria:
You’re simulating a simple, well-considered purchase between similar products.
Where only one person is involved in the purchase decision.
Where the customer already knows what kind of product they need.
Where you know which attributes the customer uses to compare products.
If your survey doesn’t meet these criteria, it’s possible that your project would be better suited to using a different survey method or discrete-choice format.
Here are three examples of specific research projects that are well-suited to conjoint analysis surveys…
1. Willingness to Pay
Customers often don’t know what the maximum amount is that they’d be willing to pay for your product — or even if they do know, they often don’t want to tell you for obvious reasons! Conjoint analysis lets you avoid directly asking customers this question by instead showing hypothetical product “profiles” and observing which ones they choose.
Your conjoint survey will produce a set of relative importance scores for each option you included. If one of your categories is price, you can use the max range in price and the max range in score to convert your importance scores into a dollar amount. For example, if your prices ranged from $1,000 to $91,000, where $1,000 had a score of 20 and $91,000 had a score of -10, you could say that a $90,000 change in price resulted in a 30-point difference in score. $90,000/30 = $3,000/point.
“$3,000 per point” becomes our conversion rate when comparing two options from our conjoint survey. For example, if I want to compare Toyota (3 points) to Tesla (20 points), I can see that a 17-point difference means that Tesla as a brand carries a markup of $51,000. ($3,000 x 17 points).
2. Market Share Modelling
Market share modeling uses utility scores from conjoint analysis to predict how 100% of market share would be divided amongst a range of products. This market share prediction can be to compare how alternative features/attributes can increase or decrease a product’s likely market share, or to see how different features can justify a higher or lower market price for the product. Here’s a good video explaining more.
3. Product Mix / Bundling Strategy
TURF Analysis (Total Unduplicated Reach and Frequency Analysis) helps you figure out what combination of attributes or options to put together to have the largest interested audience possible. So you’ve already run your conjoint analysis survey (or alternative method of choice-based ranking survey) to measure what people care about, which has produced a list of options ranked from most to least important. You might assume that bundling together the top-ranked options would be the best way to make your offering more appealing to a larger number of people — but what if your #1 and #2 ranked options were liked by the same sub-group of voters? That would mean bundling these options together wouldn’t actually help you reach any additional people, it would just make your existing audience like it a little bit more than before.
TURF Analysis is like a specialized type of segmentation analysis that measures whether your combination of bundled options will reach a larger audience. There are two main outputs of TURF analysis:
Reach → the percentage of customers that like at least one option in your bundled offering.
Frequency → the average number of options in a bundled offering that customers like.
Typically, “reach” is prioritized above “frequency” as the more important of the two datapoints.
TURF Analysis, especially if calculated manually in a spreadsheet, is much easier to conduct if you use a simpler choice-based survey method like Pairwise Comparison or MaxDiff Analysis, where scores can more easily be ascertained for each individual participant towards each option.
— — —
Alternatives To Conjoint Analysis For Online Surveys
In this section, I cover 8 survey methods that are often more suitable for research occasions that people initially assumed they should use a conjoint analysis survey for.
Conjoint analysis is a choice-based research method — it gives people a series of options and figures out what they care about by tracking which options they choose. There are a range of different survey methods that follow this same principle of giving people options are seeing which choices they make. Choice-based survey methods are valuable for researchers because they imitate real-life scenarios where people have limited options, forcing them to consider the trade-offs between choices and pick the one that best meets their needs.

Of the eight alternatives to conjoint analysis that I explain below, the first four are choice-based research methods while the last four are non-comparative survey methods (ie. question types that don’t force people to choose between options — the asterisk * indicates that the survey method is not a choice-based format). Here are the eight alternative survey methods:
1. Pairwise Comparison
2. Points Allocation
3. Ranked Choice Voting
4. MaxDiff Analysis
5. Agreement Voting *
6. Kano Model *
7. Van Westendorp PSM *
8. TURF Analysis *
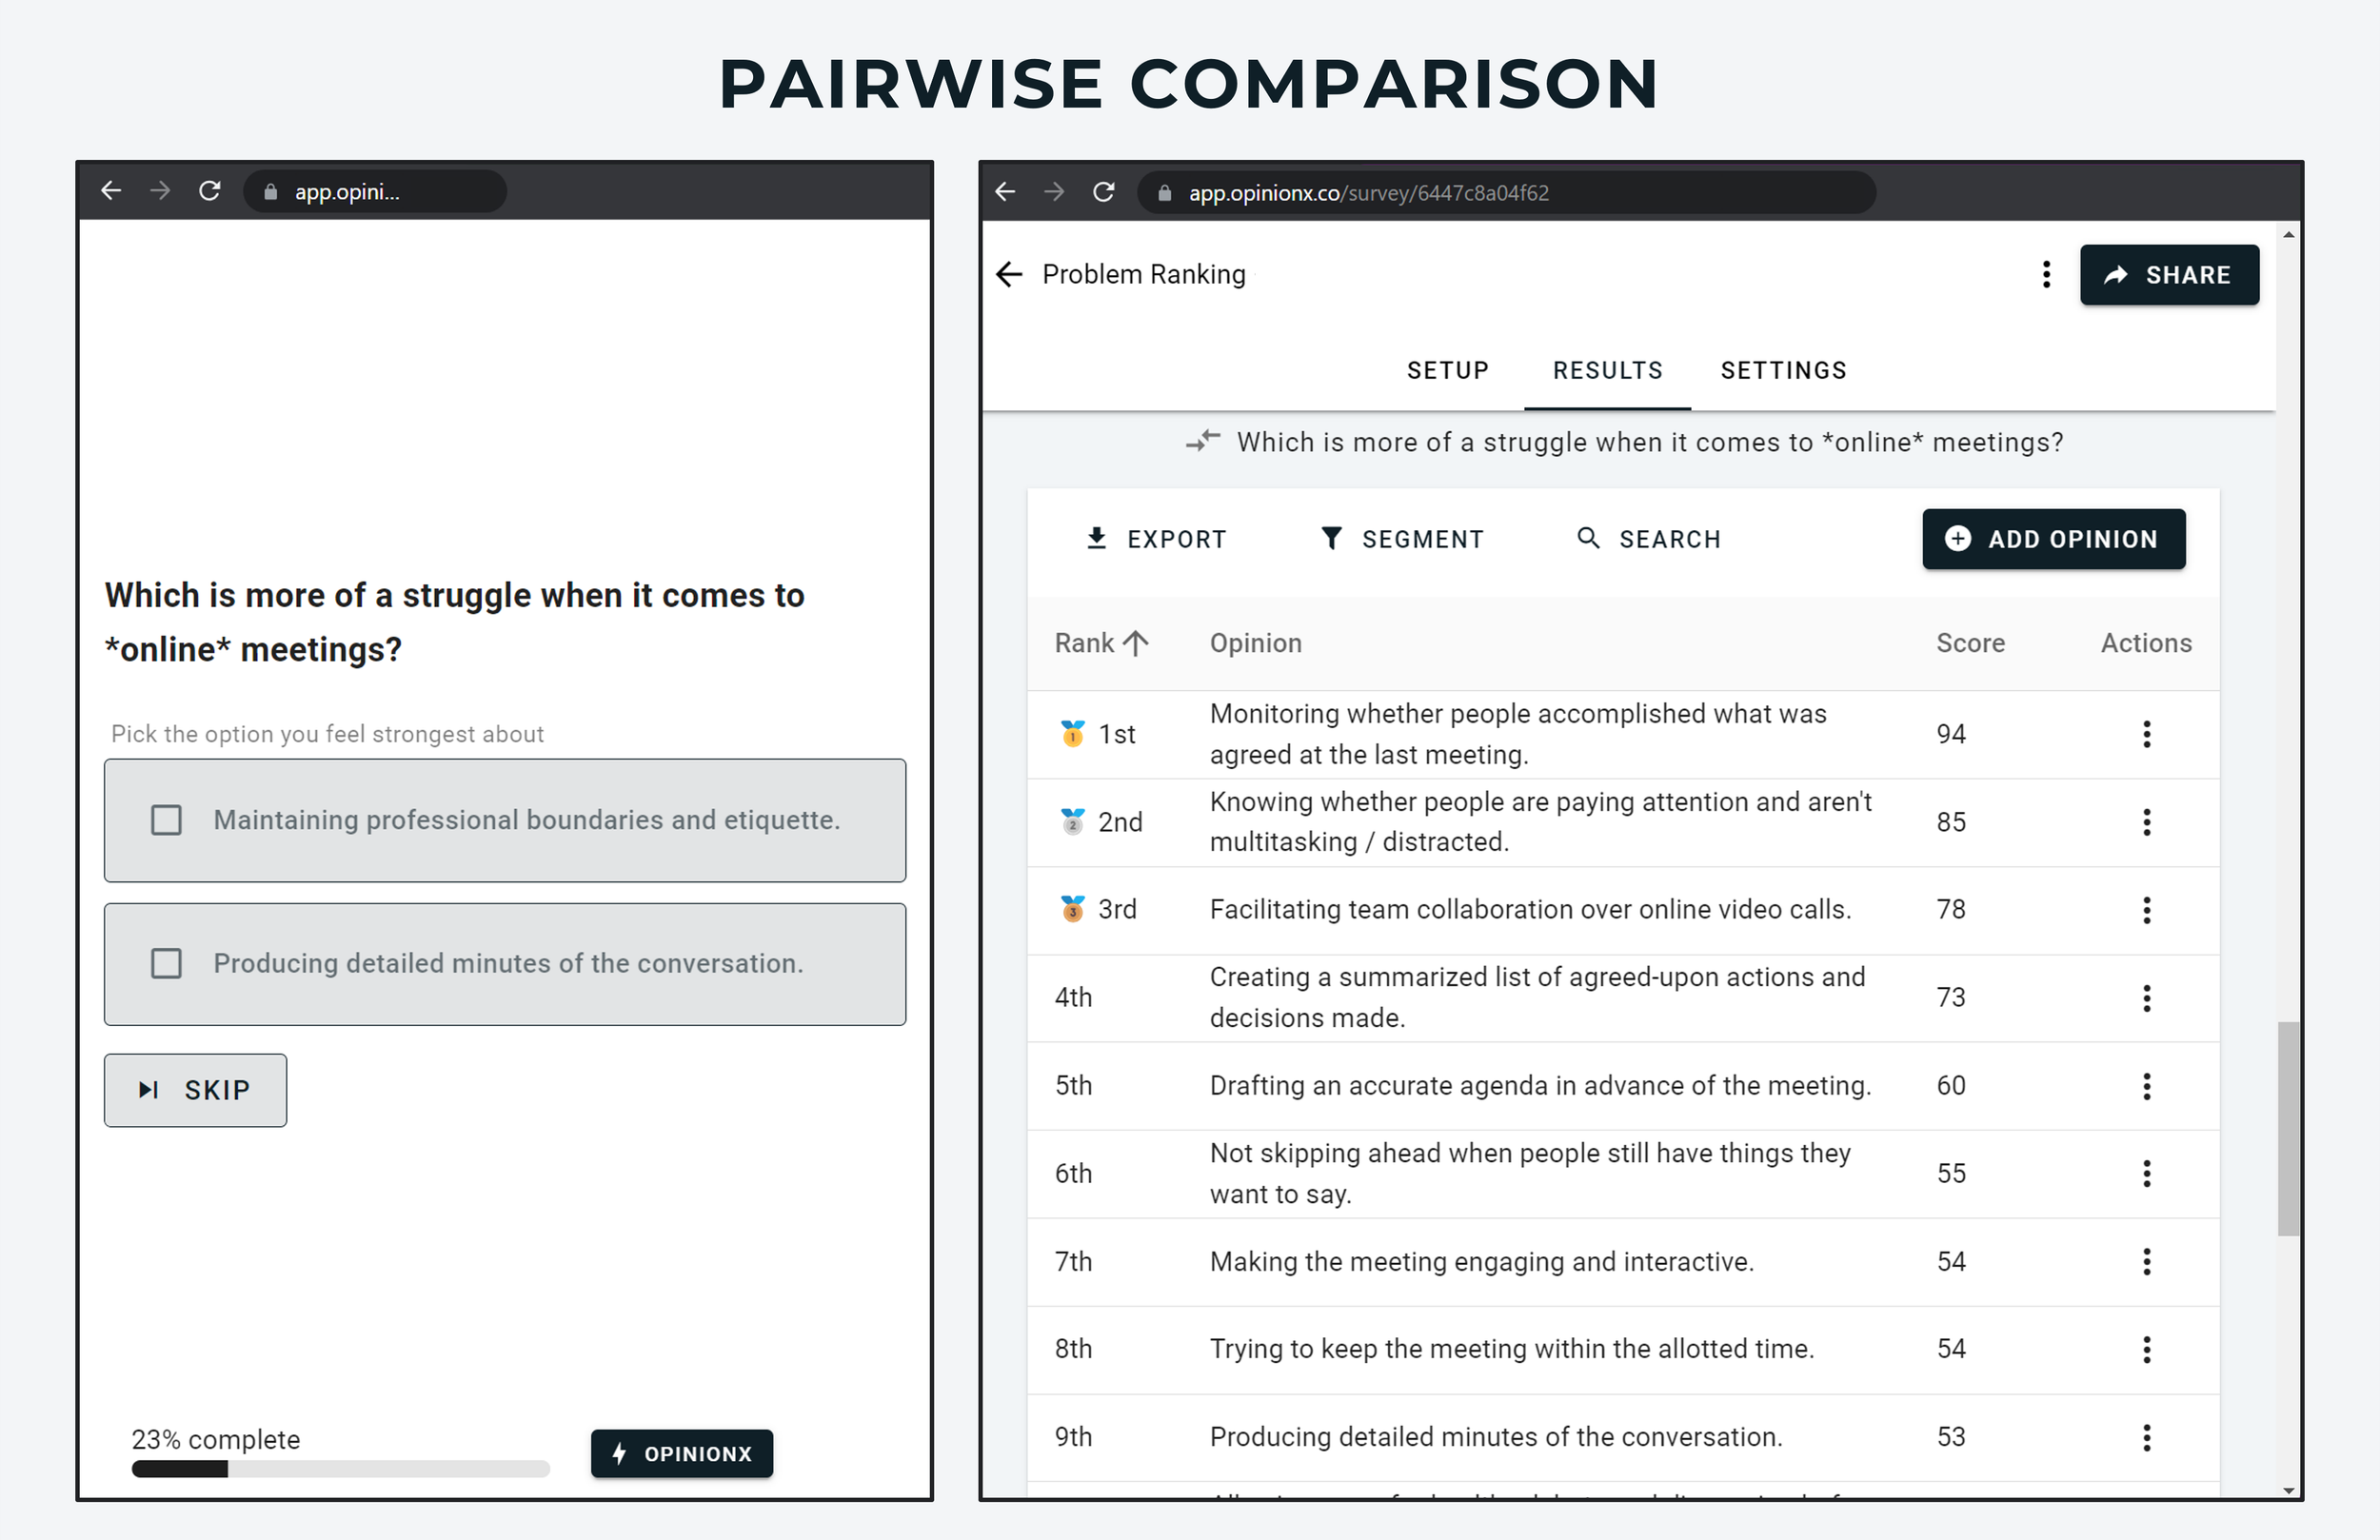
1. Pairwise Comparison
Explanation: Pairwise Comparison is like a simple, flexible version of conjoint analysis. Instead of showing people “profiles” made up of many different attributes, pairwise comparison shows two options at a time and calculates which options get picked most often.
Advantages: Simple to set up on your own, low cognitive load for participants, can rank short or long lists, easy to understand how results are calculated, 10x cheaper than conjoint analysis tools.
Disadvantages: Lacks some of the sophistication of conjoint analysis (eg. separate attributes and levels). Can require a lot of voting if you’ve got a lot of options but only a few respondents.
Suggested Tool: OpinionX (unlimited free Pairwise Comparison surveys)
Interactive Example:
— — —

2. Points Allocation
Explanation: Points Allocation surveys give respondents a pool of credits to spend amongst a set of options. The way they allocate those credits tells you not only which options are most important to them, but also how much more important the top options are.
Advantages: Great at measuring the magnitude of people’s preferences by allowing them to “spend” their credits on what matters most to them (ie. not just that they like apples more than pears, but they would give 9 of their 10 points to apples). Points Allocation is more flexible than conjoint analysis for testing willingness to pay for specific functionality or benefits.
Disadvantages: As a method of choice-based modeling, respondents may feel so strongly about a few options that they choose not to allocate any points to many of the options available. While this is a solid indicator that it is not important, it can create gaps in data (particularly with smaller respondent sample sizes).
Suggested Tool: OpinionX offers unlimited free Points Allocation surveys on all tiers.
Interactive Example:
— — —

3. Ranked Choice Voting
Explanation: Ranked Choice Voting shows respondents the full list of options and asks them to rank them according to their personal preferences.
Advantages: It’s a well-known ranking method that’s easy to set up and very simple for participants to use.
Disadvantages: You should only use 6-10 options max in a ranked-choice question, any more and your quality of data collection starts to decline sharply. For ranking 10+ options, consider using Pairwise Comparison or MaxDiff Analysis questions instead. Ranked choice voting is not particularly easy to do on touchscreens / mobile phones, however, many tools have adapted the design to make this easier (eg. OpinionX allows users to rank by tapping options, drag-and-dropping, or using small arrows to reorder their choices).
Suggested Tool: OpinionX offers unlimited free Ranked Choice Voting surveys (optimized for all screen sizes!)
Interactive Example:
— — —

4. MaxDiff Analysis
Explanation: MaxDiff Analysis shows respondents a list of options (usually 4-7 at a time) and asks them to identify the “best” and “worst” options from the list. Each time the respondent has finished, the list resets and a new set of options are shown.
Advantages: By showing 4-7 options at a time, MaxDiff collects more data per vote than pairwise comparison. It is also much less rigid and complex to set up than a Conjoint Analysis survey.
Disadvantages: MaxDiff has multiple times higher cognitive load than pairwise comparison by showing 4-7 options at a time instead of just 2. While this speeds data collection up, it slows the participant down considerably and requires more “considered” judgment for each vote to be reliable. Additionally, MaxDiff tends to be pretty expensive with a similar price tag to conjoint analysis tools.
Suggested Tools: OpinionX offers the only free MaxDiff survey tool on the internet
Interactive Example:
— — —

5. Agreement Voting
Explanation: Measures which option has the highest level of consensus agreement amongst a population of voters.
Advantages: In many scenarios (collaborative planning, educational settings, conflict resolution), it’s more important to identify consensus options that will move progress forward than to find a divisive option just because it has the highest number of votes. Agreement voting is extremely simple, quick, and easy to understand for both researchers and respondents.
Disadvantages: Agreement voting has no forced comparison or trade-off, so it doesn’t do a good job of simulating how people act in real life. Simple aggregate voting like this should not be used in most research scenarios.
Suggested Tools: OpinionX lets you create unlimited free Agreement Voting surveys on all tiers.
Interactive Example:
— — —
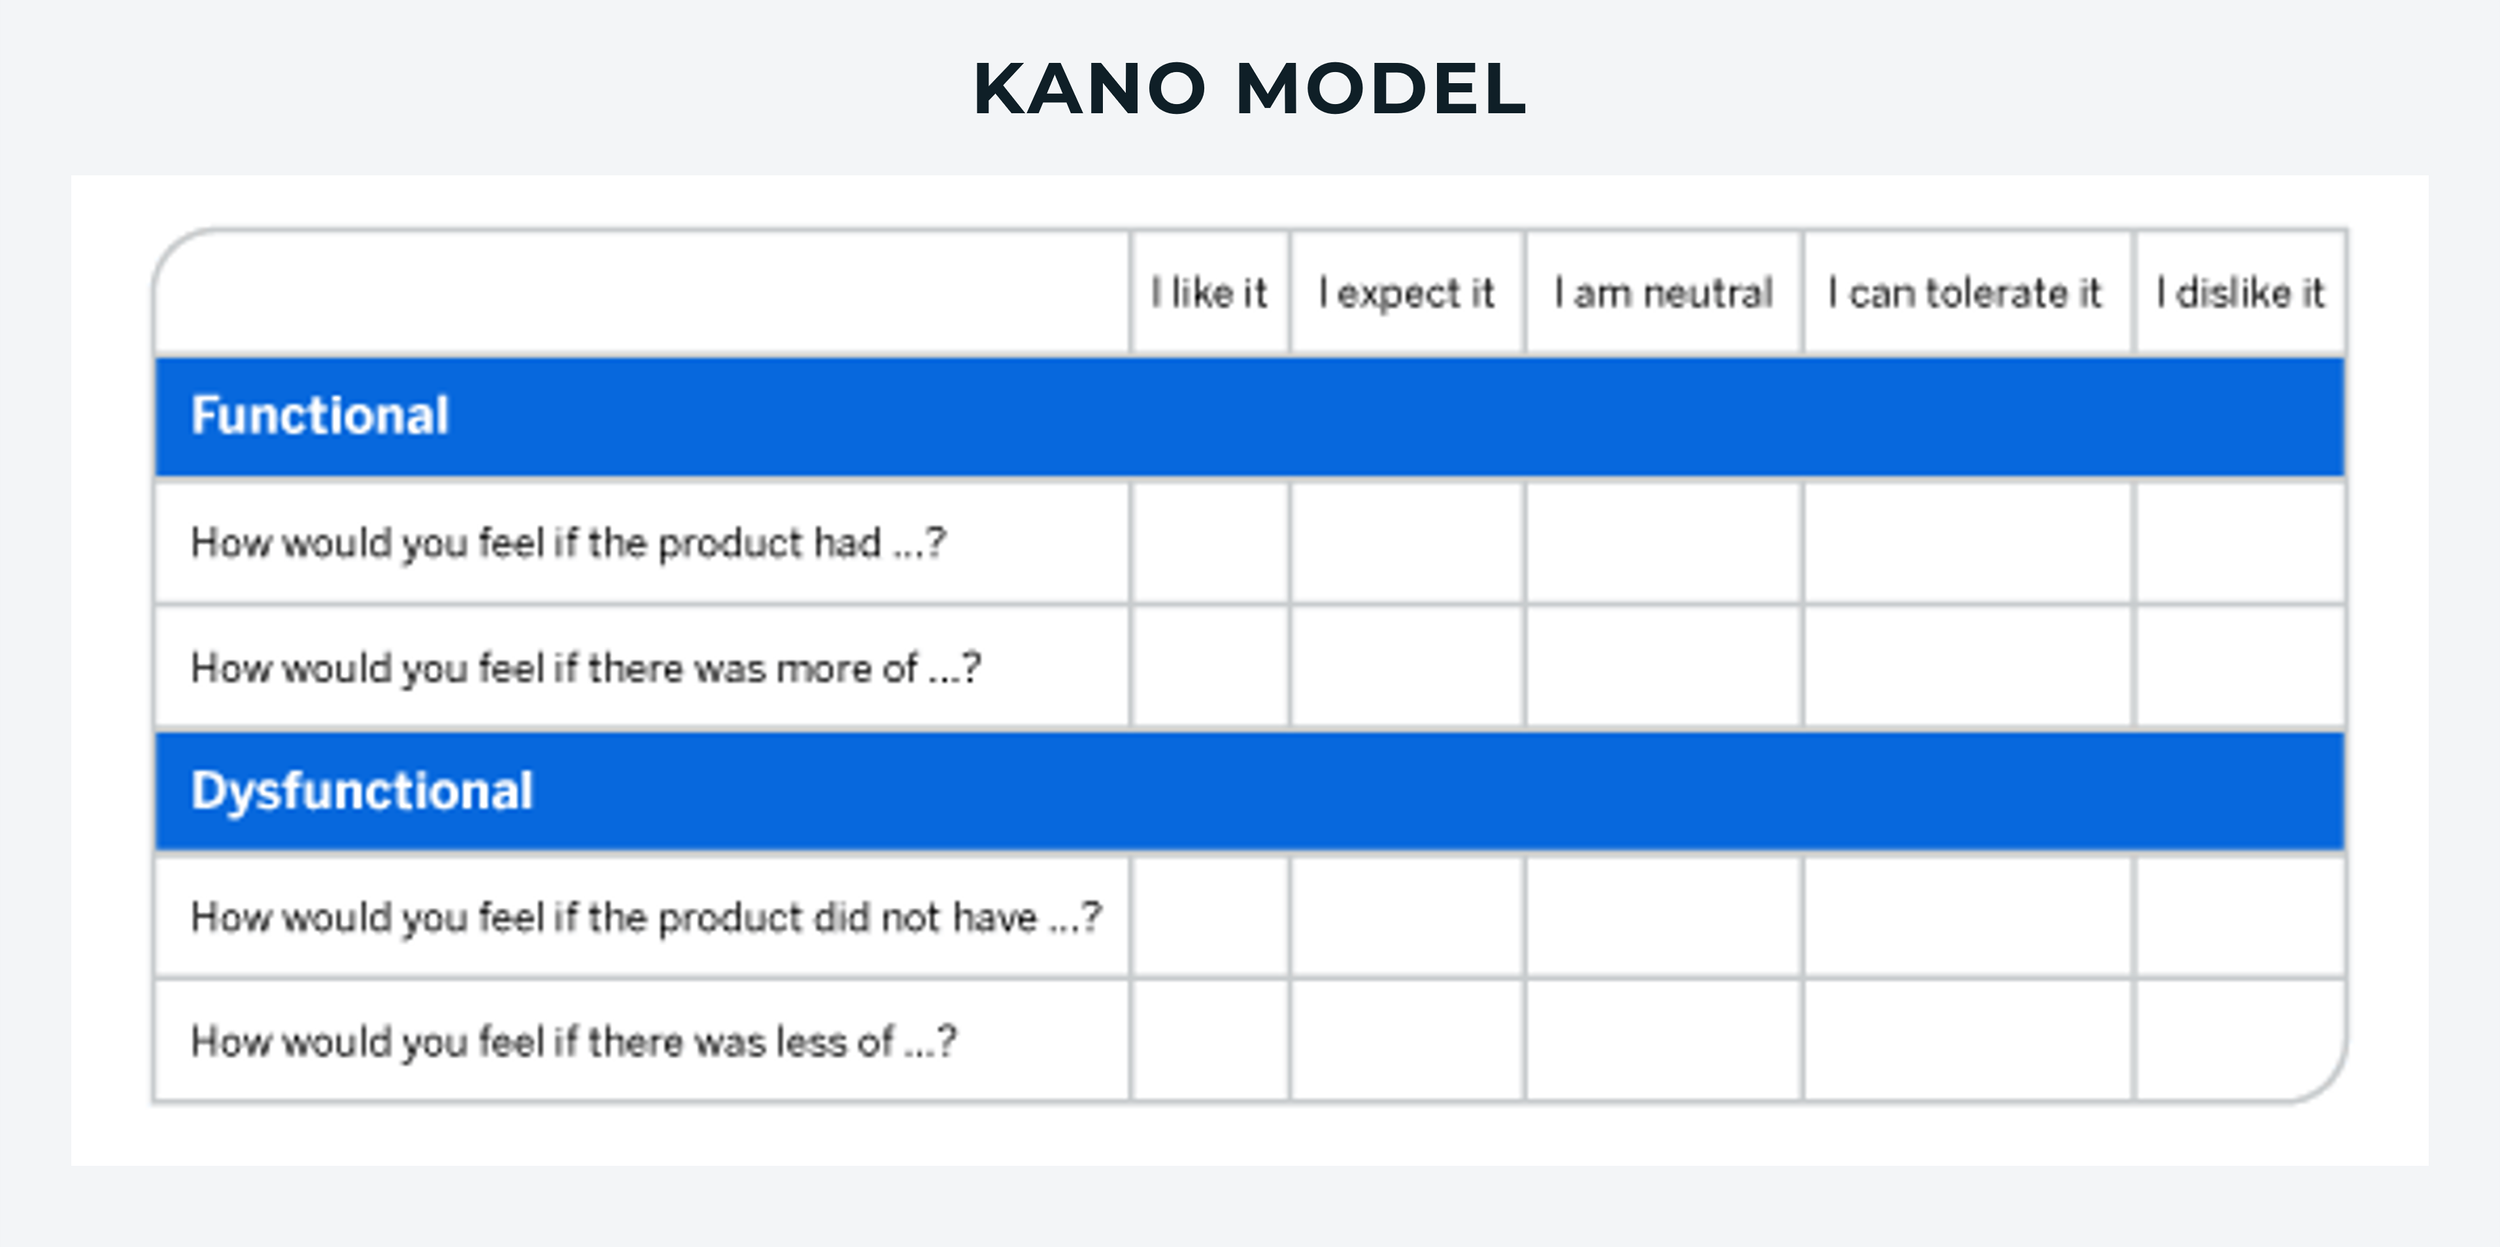
6. Kano Model
Explanation: The Kano Model shows a respondent a statement (usually about a specific feature or product functionality) and asks them to select one of five options: (1) I like it, (2) I expect it, (3) I am neutral, (4) I can tolerate it, (5) I dislike it.
Advantages: The main advantage of the Kano Model is that it helps you distinguish which features are expected (basic), which contribute to satisfaction (performance), and which can lead to delight (excitement).
Disadvantages: In my opinion, the Kano Model is not a good approach to trade-off analysis or understanding what matters most to people. It requires respondents to have a very clear understanding of the value that each individual feature translates into for them, which is rarely the case. It’s also a glorified 1-5 star rating scale, which has many proven issues in research, particularly for allowing respondents to pick the same score for every option and for not forcing any comparison between options, which is a fundamental aspect of trade-off analysis.
Suggested Tools: Any survey tool with a multiple-choice question or matrix grid question type (such as OpinionX).
— — —
7. Van Westendorp PSM
Explanation: Conjoint analysis is famous for pricing research, however, it can only be used if you already have a range of 2-7 potential price points you’re willing to consider for your offering. For many new products, particularly in emerging categories or based on technical innovations, you won’t have any benchmark price to even start at! That’s where the Van Westendorp Price-Sensitivity Meter comes in. It uses four open-response questions to help you find a reference point for what your initial pricing should be.
Advantages: Great for identifying a rough range of price points to consider for a new product or service. Simple setup and analysis that anyone can do. No advanced survey tool required.
Disadvantages: Only suitable for finding pricing estimates, not any other form of research, so it’s very narrow in usage.
Suggested Tools: Honestly, no need for any fancy tools here — just use a Google Forms questionnaire or a free OpinionX survey to collect people’s text response answers and manually create your Van Westendorp PSM graph in a spreadsheet.
— — —

Image Source: Quantilope
8. TURF Analysis
Explanation: TURF Analysis isn’t actually for data collection like the other methods shown. It’s a data analysis method that takes ranked data and finds the combination of options that have the highest combined preference that appeals to the most people possible (basically which two options are highly ranked but with very little overlap in who cares a lot about them).
Advantages: TURF Analysis is predominantly used for informing product bundling strategy, where it’s very useful in product or attribute mix selection.
Disadvantages: As it’s not a data collection method like the other alternatives, TURF Analysis relies on using an approach like Pairwise Comparison, MaxDiff or Conjoint Analysis to calculate the relative importance of each option first. It’s also only really useful when looking for the lowest input approach to maximizing output effect, which is not a common research requirement.
Suggested Tools: Sawtooth Software ($4,500/year for TURF Analysis) or QuestionPro’s “Research Suite” Package ($5,000/year).
— — —
How To Pick The Right Choice-Based Research Method
If you’re trying to model market share scenarios, calculate willingness-to-pay for existing product features, or simulate competitor comparisons in mock buying decisions, then it’s hard to beat conjoint analysis. But the vast majority of research projects people consider conjoint for are not made for conjoint, so pick a more flexible, easier-to-use method that’s available for a much cheaper price (or even for free) instead.
— — —
About The Author:
Daniel Kyne is the Co-Founder of OpinionX, a free research tool for stack ranking people’s priorities — used by thousands of product teams to better understand what matters most to their customers. OpinionX has a bunch of free research methods for ranking people’s preferences — including free Conjoint Analysis surveys alongside other ranking methods like Pairwise Comparison and Points-Based Voting.
→ Create a FREE Conjoint Analysis Survey now
Subscribe to The Full-Stack Researcher newsletter where we share research strategies for founders and product teams: