
Product concept testing: 4 studies to run before you build (in order)
A survey that asks customers to rate features can't tell you whether to build a new product, because ratings measure what people like and a launch decision depends on what they'd give up. Product concept testing that answers "should we build this version?" runs four studies in order. Customer interviews and a survey find what buyers care about and which groups care about what, and a conjoint analysis then tests whether your unique selling point wins when buyers have to choose. A Van Westendorp pricing survey finds the price range buyers accept for the winning version, and a purchase test, such as pre-orders, shows who actually puts money down. Most product validation fails because teams ask a study a question it can't answer, so here each study answers one question and hands its result to the next. Funded companies need this as much as founders do: in a CB Insights analysis of 431 venture-backed startups that shut down since 2023, 43% cited poor product-market fit (March 2026).
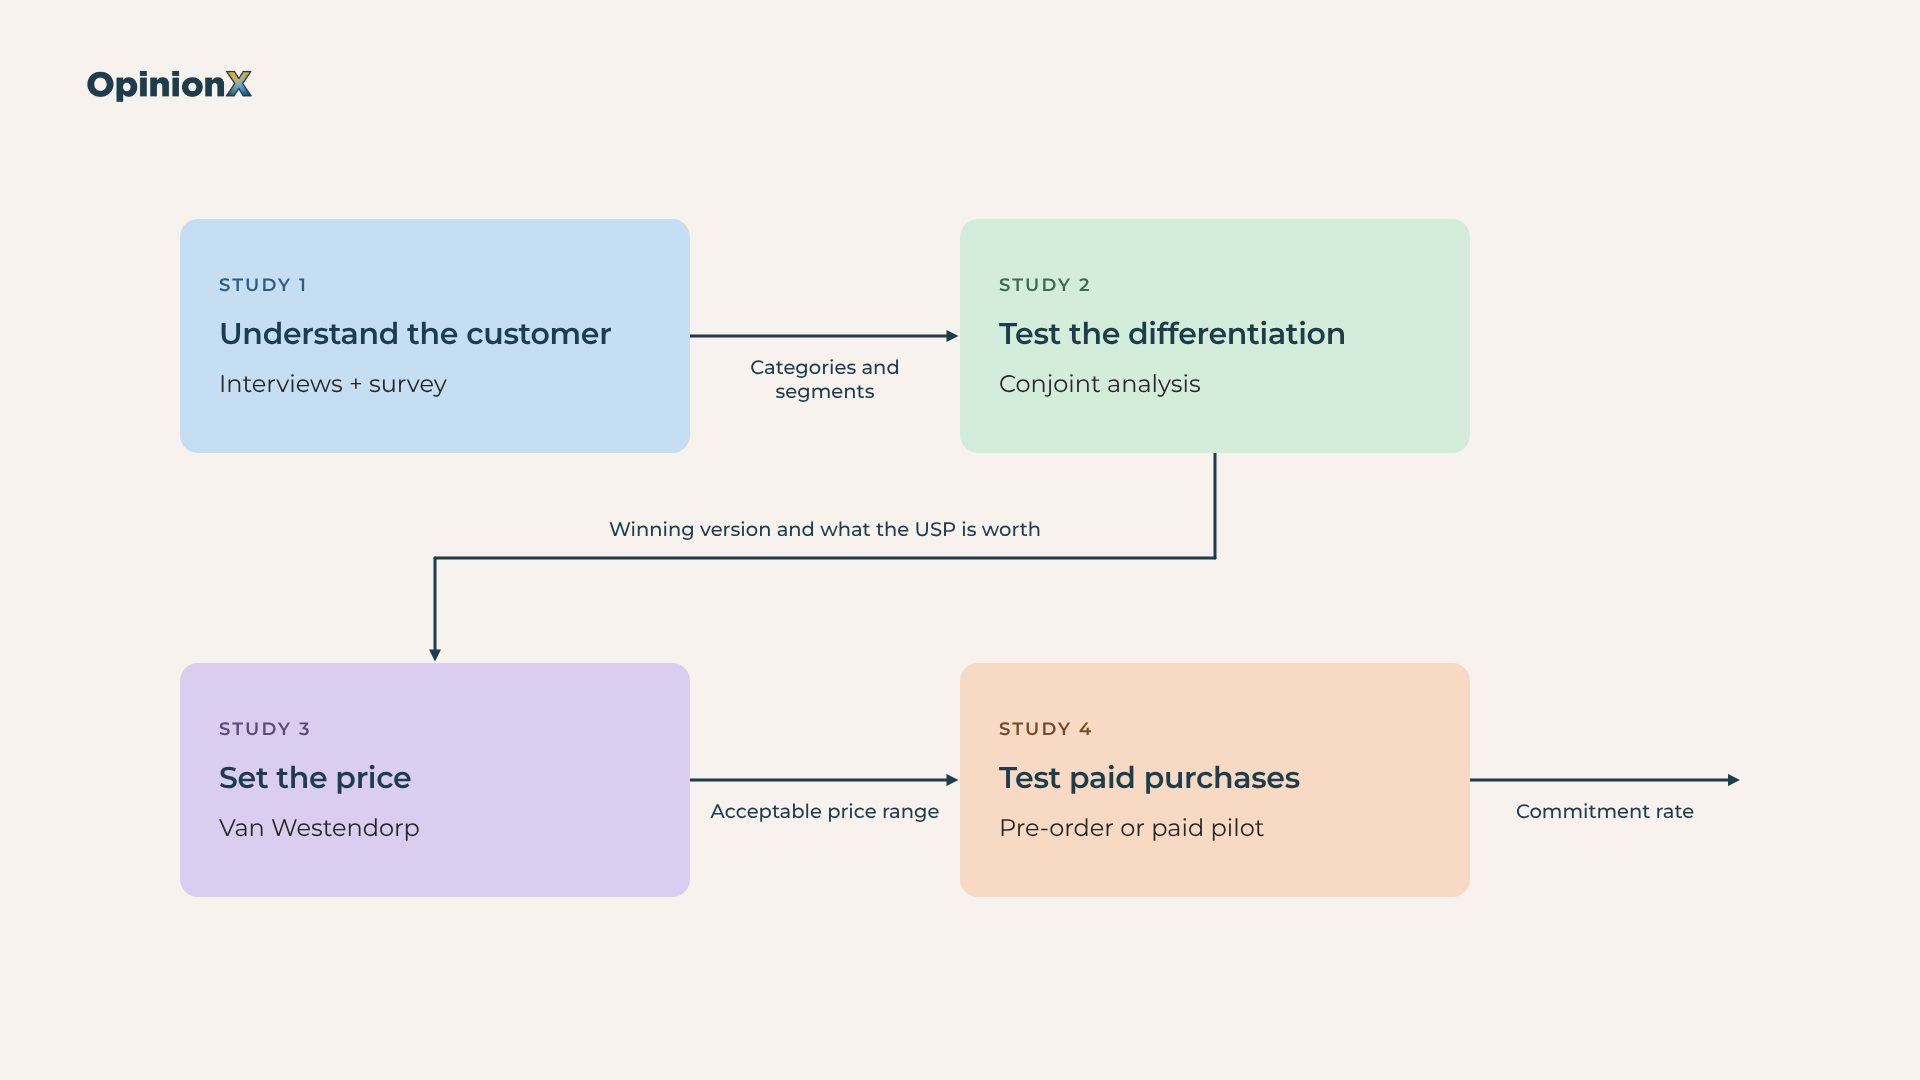
This four-study sequence is for product teams at funded companies and established brands taking a new product or product line from concept to launch, with existing customers or an audience to recruit from. If you're testing whether a business idea is worth starting at all, this sequence comes too late, so start with our guide on how to validate a product idea instead. This guide covers why rating surveys fail at this job, what each study produces and why you have to run them in order, then how to read a conjoint result as a verdict on your unique selling point and why the last step has to happen outside any survey tool.
Why can't a rating survey tell you whether to build a new product?
A rating survey can't tell you whether to build a new product because a rating costs the participant nothing, so they score most features as important and never show you what they'd sacrifice. Take an illustrative example: an established kitchen-appliance brand is launching its first coffee grinder and surveys its existing customers, asking them to rate how important grind consistency, noise, capacity and price are on a scale from 1 to 5.
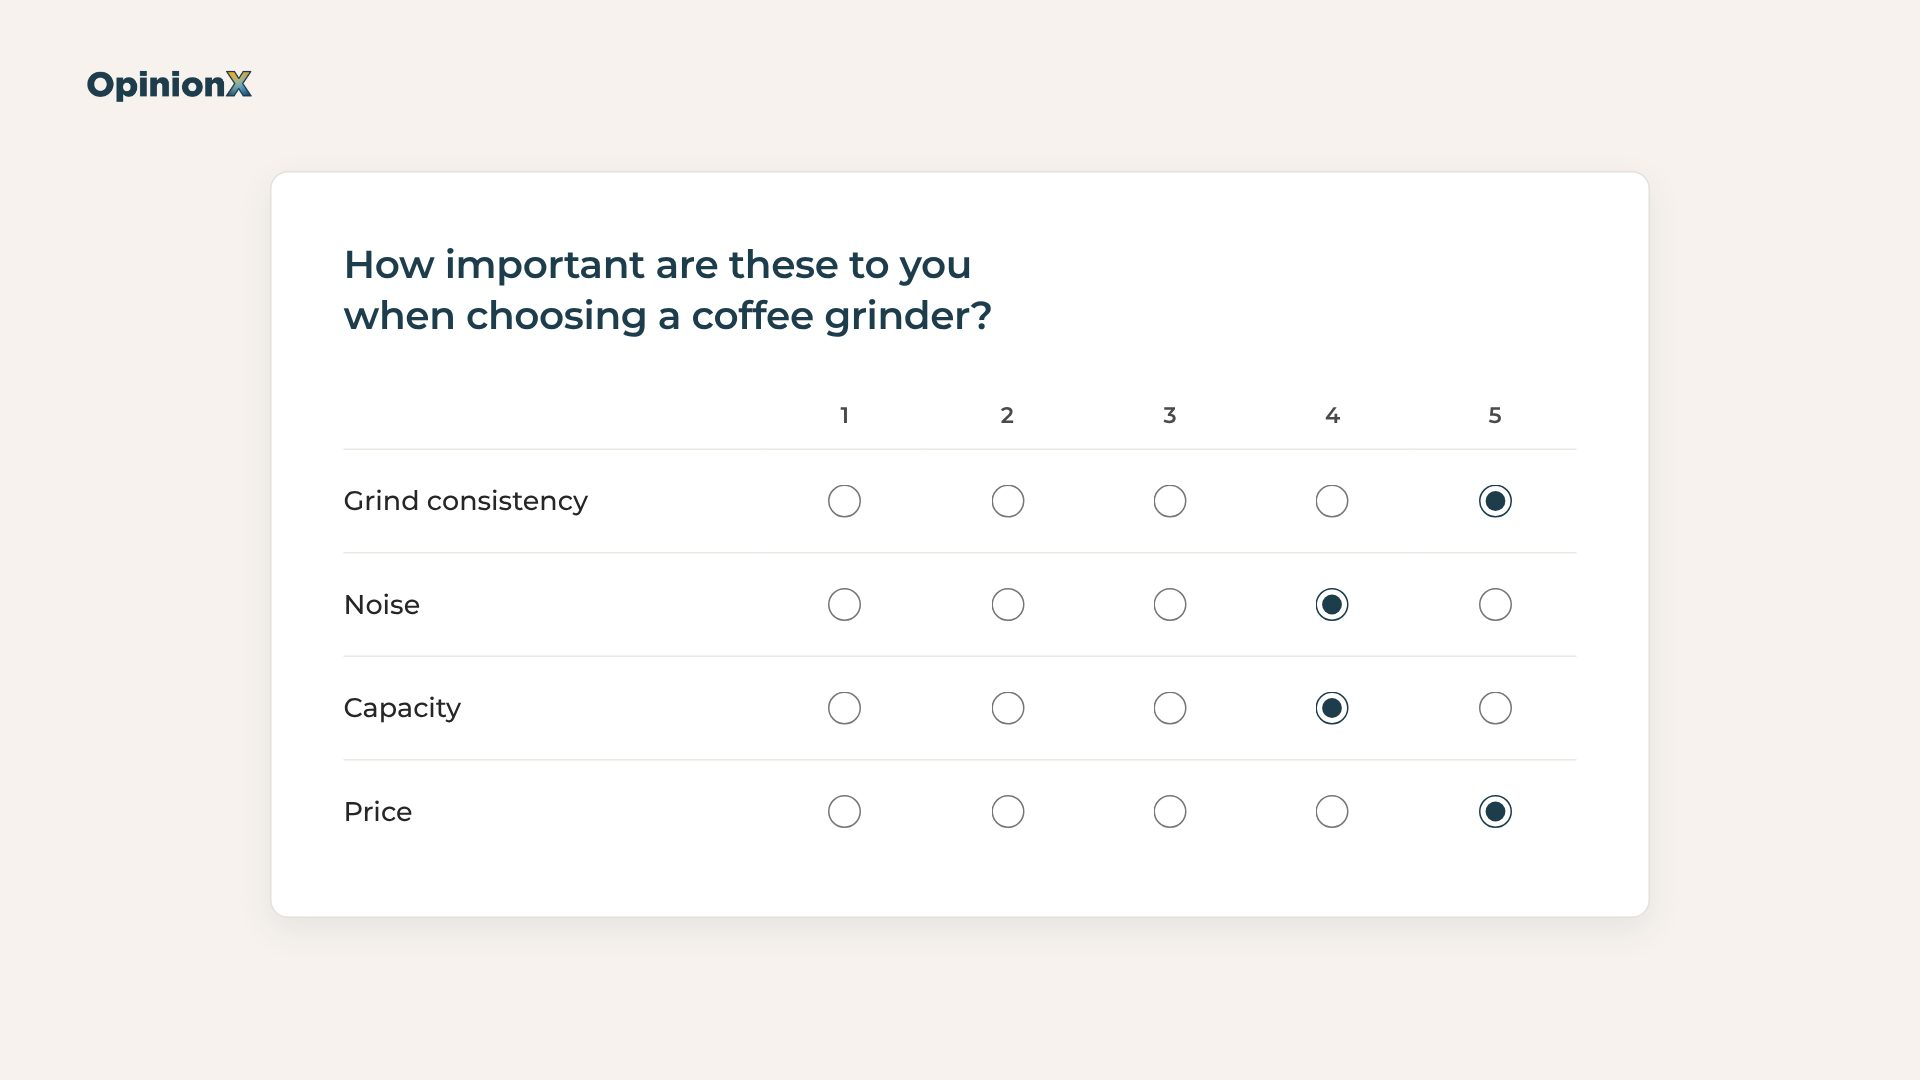
Every feature comes back "important", because nothing stops a participant from giving all four a 4 or a 5. The team's unique selling point (USP), meaning the one feature they believe makes buyers pick their product over the alternatives, is a quieter motor, and after the survey they still don't know whether a quieter motor beats a lower price when a buyer has to pick one grinder over another.
That gap between liking a feature and giving something up for it is behind most failed concept tests. A launch decision is a trade-off decision, because your new product will sit on a shelf or a pricing page next to a cheaper or more familiar alternative, and only a method that forces participants to choose between versions of the product can test a USP. We've written more about this in our article on why traditional surveys fail at validating product ideas.
What are the four studies in product concept testing?
Product concept testing works as four separate studies, run in order, where each one answers a single question and passes its result to the next. The table shows what each study asks, which method runs it, what it hands forward and what it can't tell you.
| Study | Question it answers | Method | Output passed forward | What it can't tell you |
|---|---|---|---|---|
| 1. Understand the customer | What do buyers care about in this product, and which groups of buyers care about different things? | Interviews, then a survey (for example a MaxDiff ranking of features) | The categories and options to test, and the customer segments to compare | Whether your USP still wins when buyers have to give something up to get it |
| 2. Test the differentiation | Does the USP change which product people choose, and how much is it worth to them? | Conjoint analysis | Category importance, marginal willingness to pay for the USP, and the winning product version | Whether anyone will actually pay, because choices in a survey cost nothing |
| 3. Set the price | What price range will buyers accept for the winning version? | Van Westendorp (with Gabor Granger if you want a demand curve) | An acceptable price range for the purchase test | How many people will buy, because it measures how a price feels rather than demand |
| 4. Test paid purchases | Will people commit money at a price inside that range? | Pre-order, deposit, paid pilot or pre-sale, run outside any survey tool | A commitment rate: the share of people offered the product who paid or put money down | Why people did or didn't buy, which is what studies 1 to 3 explain |
The last column is why you need all four: every study misses the question the next one answers.
Study 1: Understand the customer
The first study finds out what buyers care about in this kind of product and which groups of buyers care about different things. Start with interviews with existing customers, or with people from the audience the new product is aimed at, and ask about the last time they bought or used a product like this one. Then run a survey with a larger group to rank what you heard. A MaxDiff survey, which shows people a few features at a time and asks them to pick the most and least important, works well here because it ranks features against each other instead of rating them in isolation.
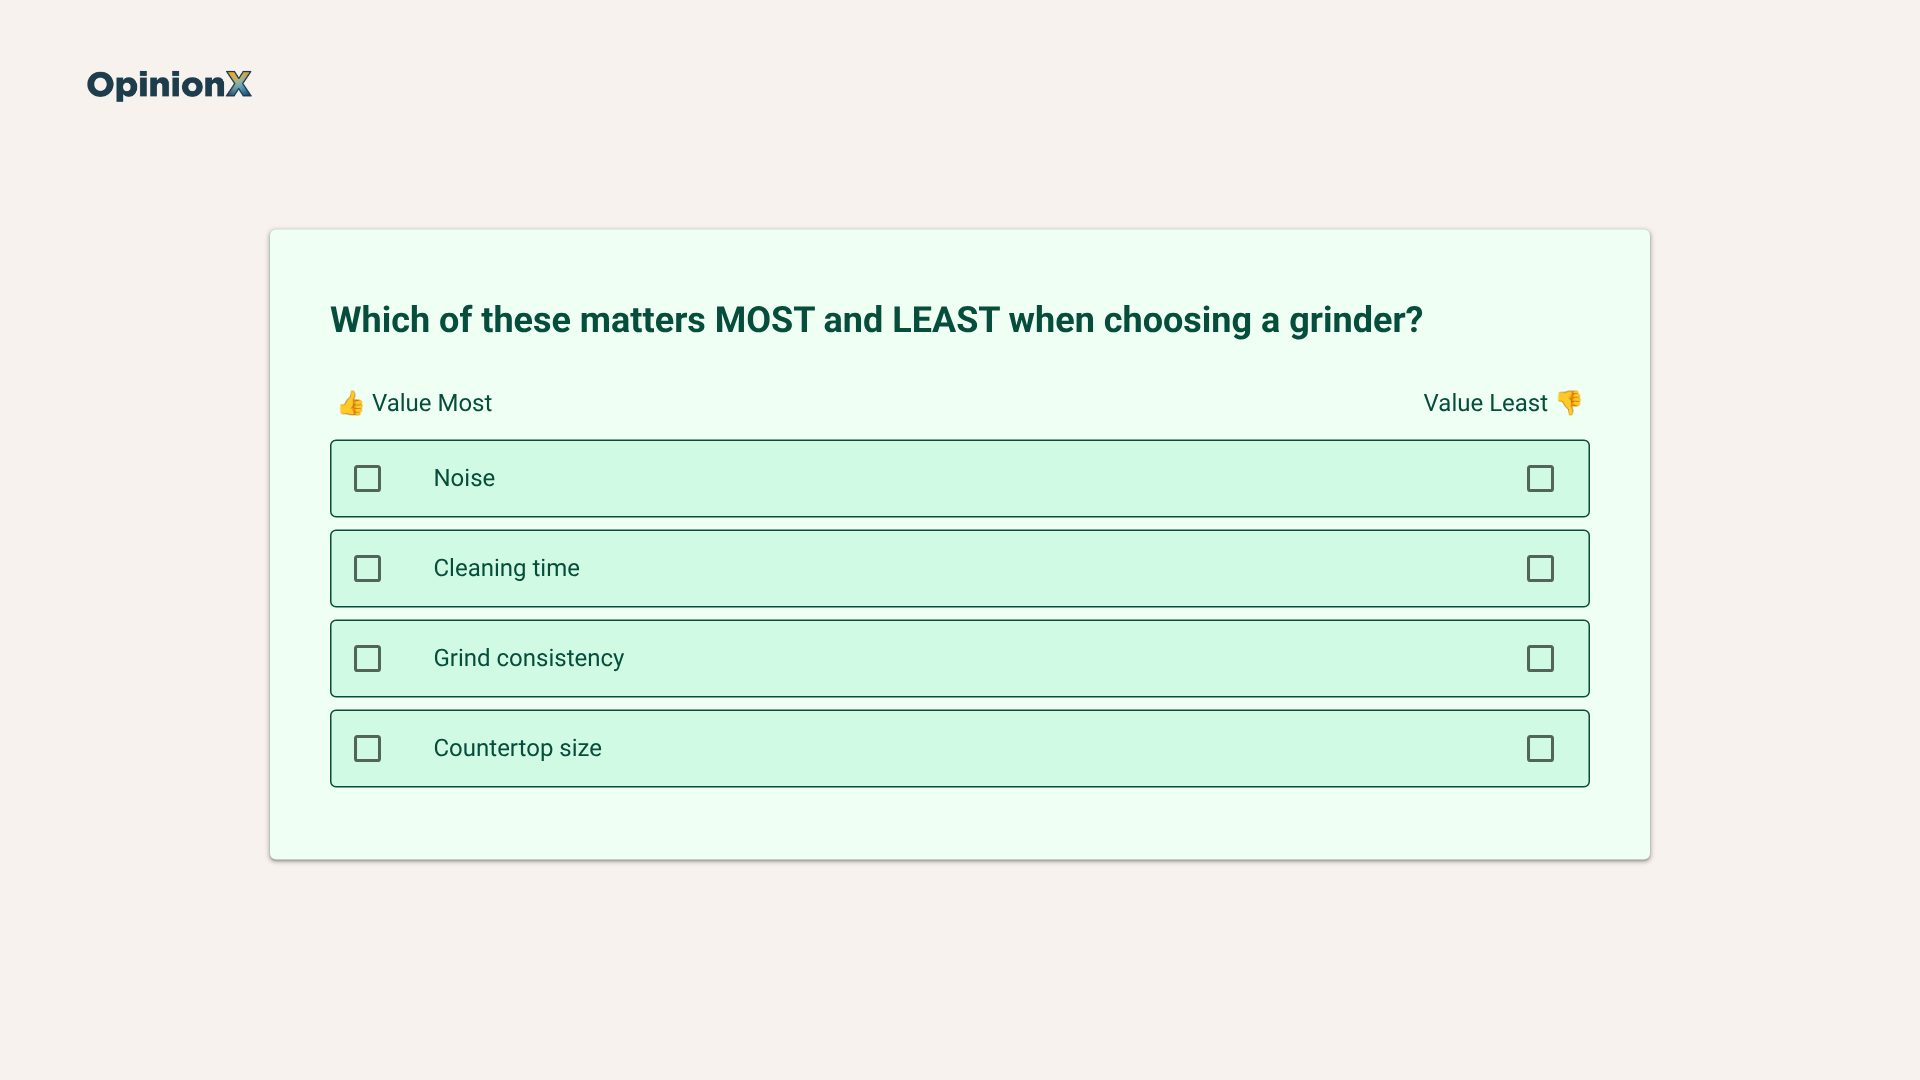
Study 1 produces two things the rest of the sequence needs. The first is the list of categories and options for the conjoint analysis, which textbooks call attributes and levels: categories are the product features you'll test (noise, capacity, price), and options are the versions of each feature (a standard motor or a quiet motor). The second is the customer segments, meaning groups of buyers with different needs, such as people who grind coffee early while others in the house are asleep. Study 1 assumes you've already picked the customer problem to solve. If you haven't, start with the Discovery Sandwich, which is OpinionX's three-layer method for that earlier stage: broad interviews, then a ranking survey, then focused interviews.
Turning interview notes into conjoint categories and options is where most concept tests go wrong, because nobody can put a value on a vague option like "quieter", and leaving out a competitor feature makes your USP look stronger than it is. If you're at that stage now, a research expert can help you design your categories and options on a free 30-minute call.
Study 2: Test the differentiation with conjoint analysis
The second study uses conjoint analysis to test whether your USP changes which product people choose. A conjoint survey shows participants two or more versions of a product side by side, each built from one option per category, and asks them to pick one. Every choice means giving up something on the version they didn't pick, so the results show how much each category drives the decision. Study 2 produces three outputs, and the section below explains how to read each: category importance, marginal willingness to pay for the USP, and the product version that wins most often.
Study 3: Set the price with Van Westendorp
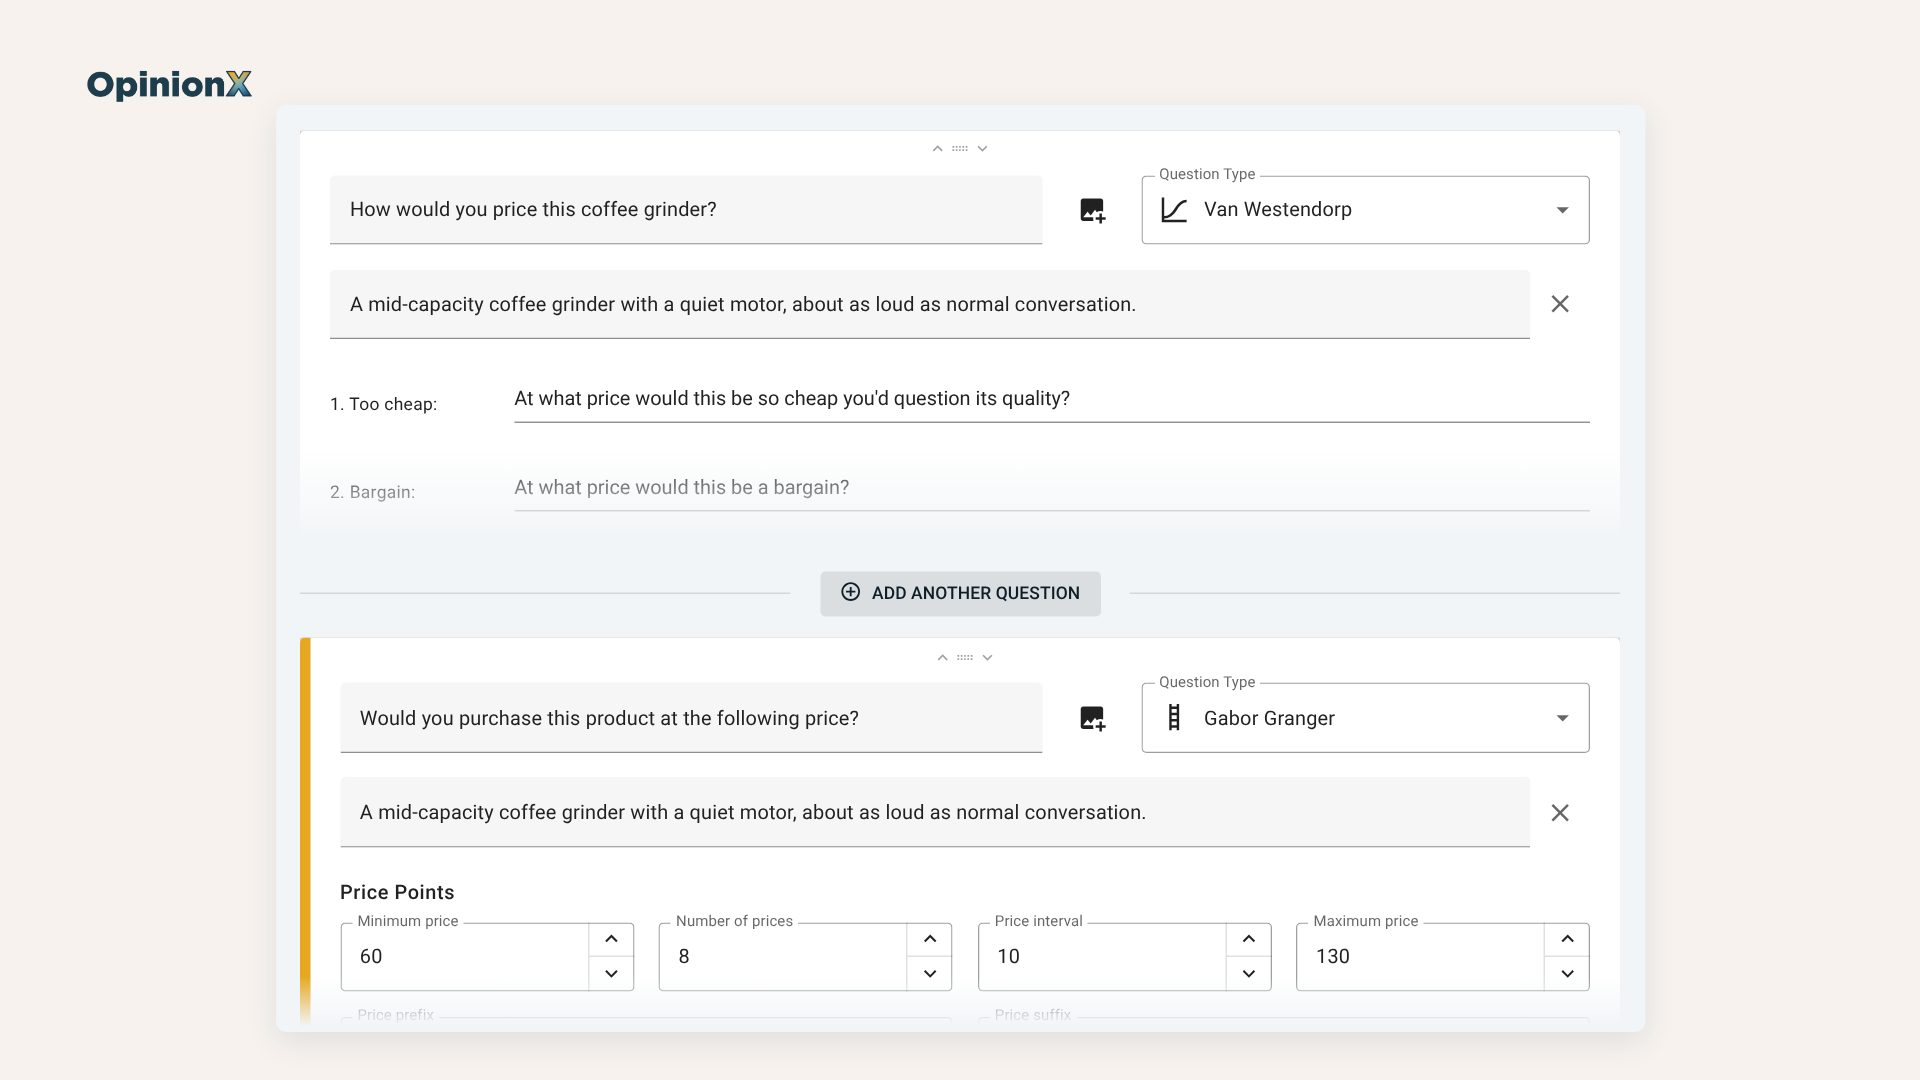
The third study uses a Van Westendorp survey to set the price for the winning version. Van Westendorp, also called the Price Sensitivity Meter, asks each participant four questions about the same product: at what price it would feel too cheap, a bargain, getting expensive and too expensive. Put those four answers together and you get the acceptable price range, meaning the prices most of your market won't reject outright. Show participants the exact version that won in Study 2, with its features described the same way, and check our Van Westendorp guide for how the questions and the chart work.
Study 4: Test paid purchases
The fourth study asks people to commit money at a price inside Study 3's acceptable price range, through a pre-order page, a refundable deposit, a paid pilot or an early-access offer. It produces a commitment rate, meaning the share of people who saw the offer and paid or put money down. It's also the only one of the four that measures what people do instead of what they say, and the section on purchases below explains why you can't skip it.
Why do you have to run the four studies in order?
You have to run the four studies in order because each one needs the output of the one before it, and running a study early means testing something nobody's decided yet. Two shortcuts break the sequence most often.
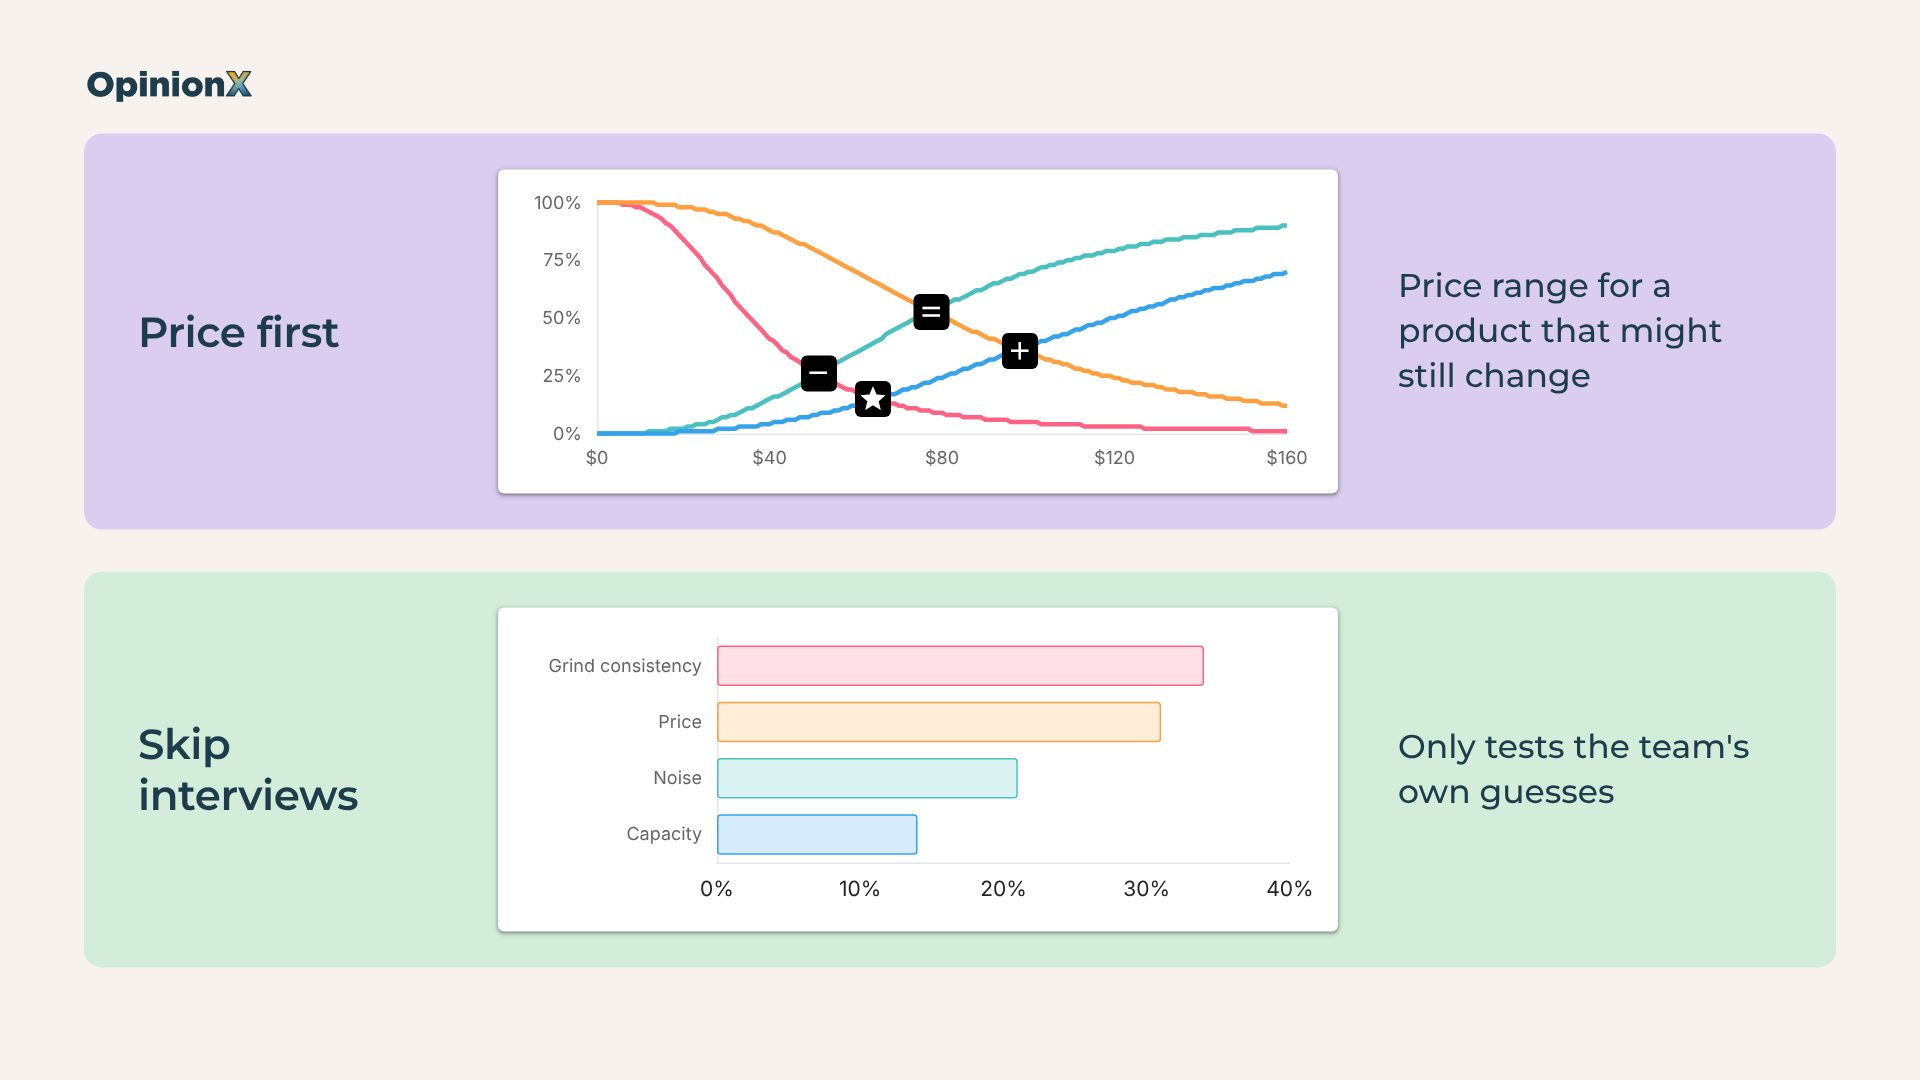
The first shortcut is pricing before Study 2. A Van Westendorp survey asks participants to price one specific product, so if the conjoint analysis hasn't picked the winning version yet, they're pricing a product that may still change: the quiet motor might get dropped, or the capacity might grow. The acceptable price range you get back then belongs to a product nobody's building.
The second shortcut is skipping Study 1, which leaves the conjoint categories and options as the team's guesses. A conjoint analysis can only test the options you put into it, so it can only confirm or reject ideas you already had. If buyers care most about something nobody listed, such as how long the grinder takes to clean, the results will never show it.
How do you read a conjoint result as a verdict on your USP?
A conjoint result gives you a verdict on your USP through three outputs: whether the USP moves choice, what buyers would pay for it and whether your version takes market share from a realistic alternative. To get them, set up the USP as one option inside a category, next to the features competitors already offer and a price category. In the coffee-grinder example, the noise category has two options, written so a participant can picture them: "standard motor, about as loud as a blender" and "quiet motor, about as loud as normal conversation". The other categories are grind consistency, capacity and price, each with options that match what's already on sale.
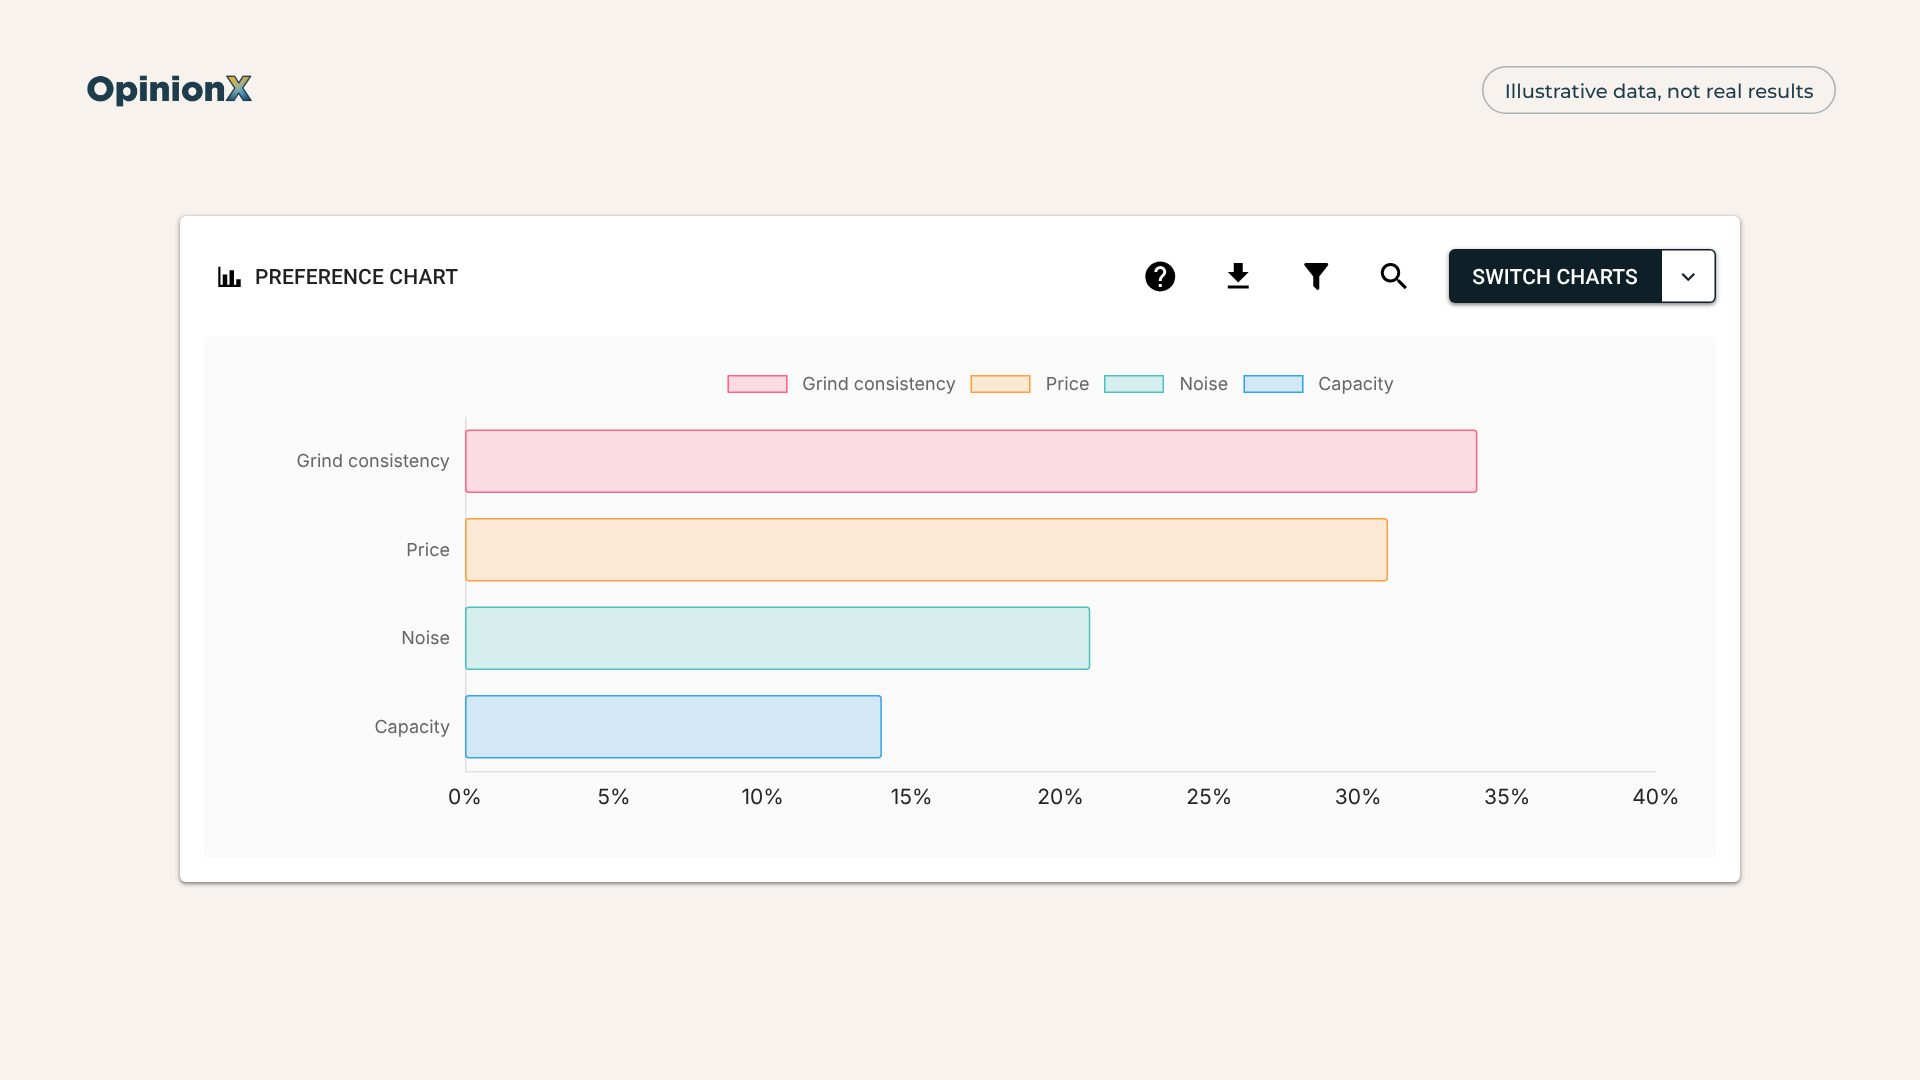
1. Category importance: does the USP move choice? Category importance shows how much of each participant's decision depends on each category, as percentages that add up to 100%. If noise takes a small share and price takes most of it, the quiet motor isn't what makes people pick a grinder.
2. Marginal willingness to pay: what would buyers pay for the USP? Marginal willingness to pay is how many extra dollars buyers would pay to get one option instead of another in the same category, such as the quiet motor instead of the standard one. OpinionX calculates it from the price category, so you have to mark that category as price in the survey settings for this chart to work, and our guide on marginal willingness to pay walks through the calculation step by step. If the quiet motor is worth less to buyers than it costs to build, the USP fails on cost even when people like it. Say the quiet motor adds $15 to the cost of making each grinder and buyers' marginal willingness to pay for it comes out at $10: every quiet grinder you sell at a price buyers accept then earns $5 less than the standard one.
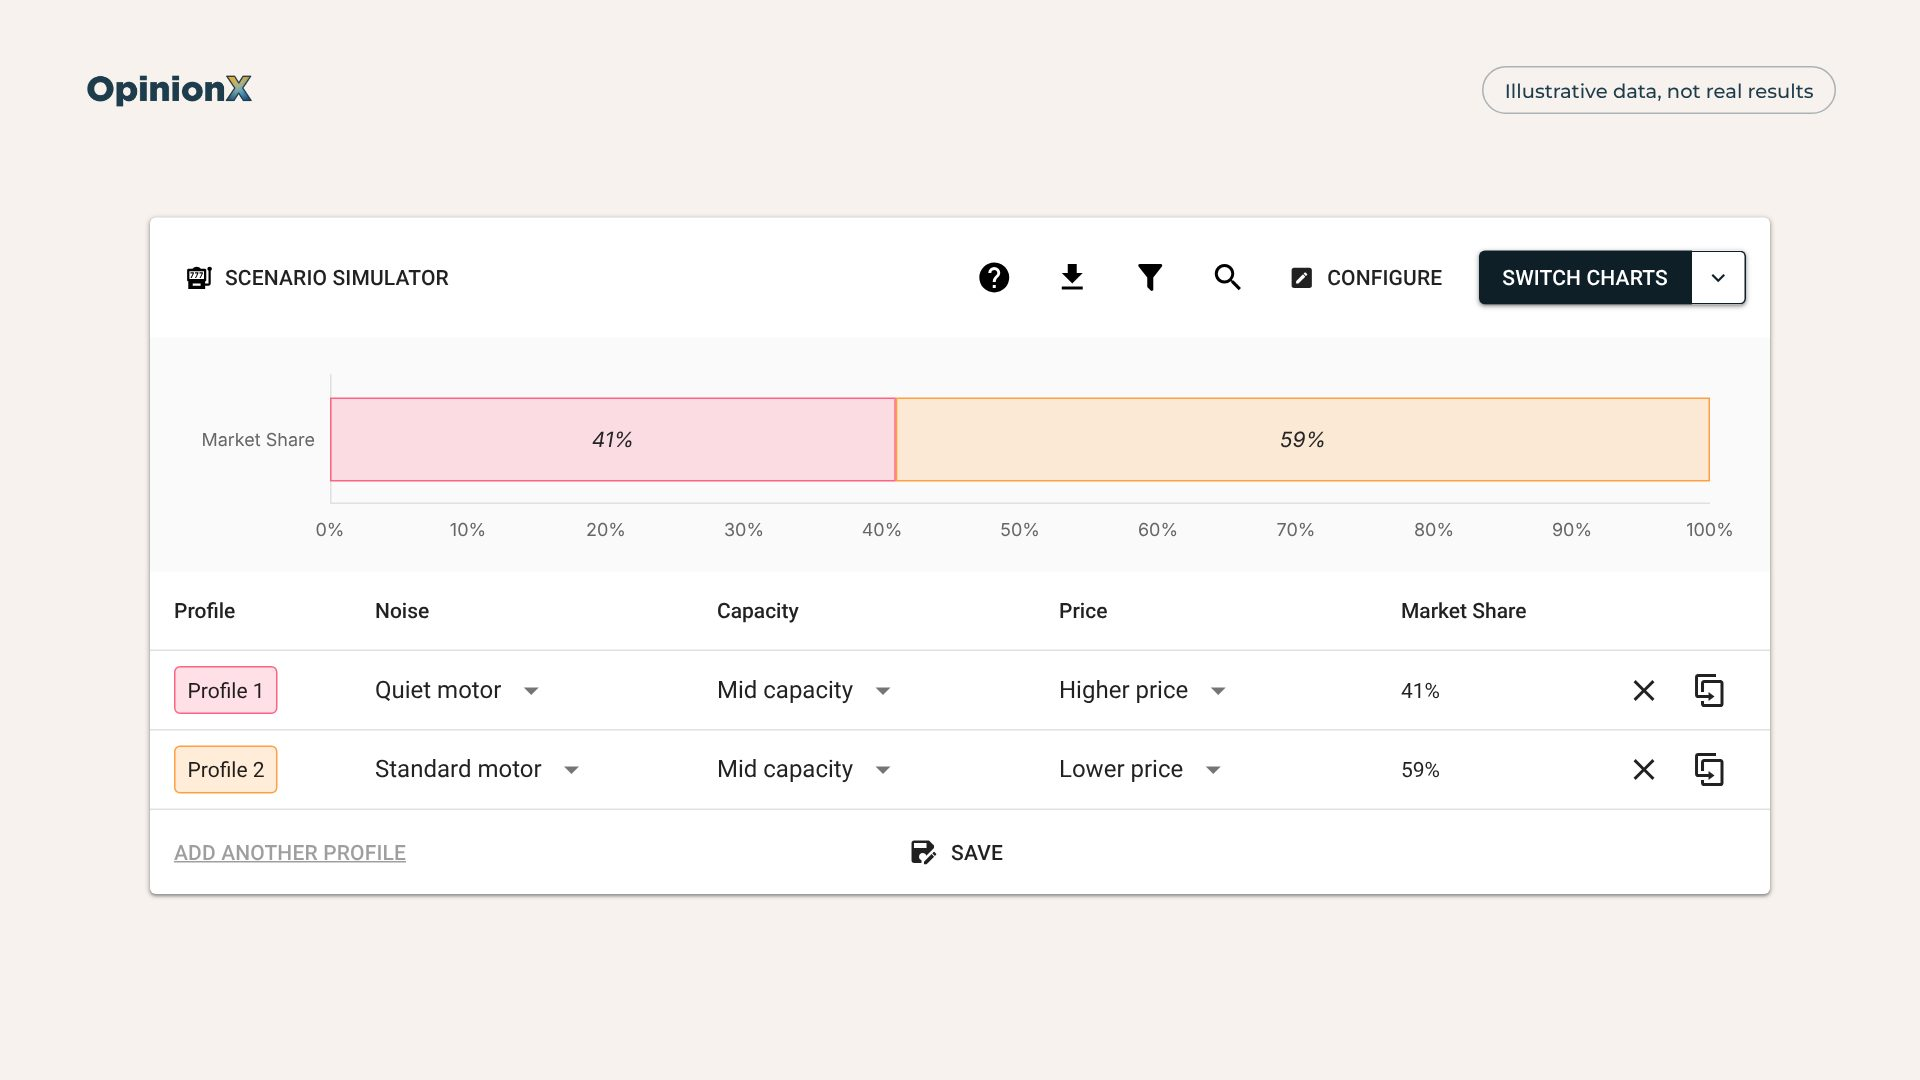
3. The market simulator: does your version win against a realistic alternative? The market simulator takes each participant's scores, predicts which of two or more product versions they'd pick and adds those predictions up into a market share percentage. Put your quiet-motor grinder at its planned price against the alternative a buyer would actually see, such as a cheaper, louder grinder already on sale. If your version loses that head-to-head, the USP isn't enough to win the sale at that price.
If the USP category ranks low in importance, that's a positioning problem, and finding it before you pay for tooling or engineering is the whole point of Study 2. A USP that's weak across everyone can still be strong for one group, though, so the next step is to split the results by customer segment. Needs-based segmentation groups buyers by the problem they most want solved instead of by age or job title. In the grinder example, filter the conjoint results to the people who said they grind coffee while others in the house are asleep and check whether noise moves up the category importance chart. If it does, that group becomes your launch market, and for a company with an existing customer base it's often a segment of current customers you can reach on day one.
To filter results this way, add a multiple-choice question that tags each participant, or bring in data you already hold, such as which of your products each customer owns, through hidden fields, meaning URL parameters in the survey link. OpinionX's segmentation tools are on every plan, including the free one, and recalculate every conjoint chart for the group you pick.
Conjoint analysis has one limit you can't design around: it can only value what you describe. A new feature needs a concrete, testable description that participants can picture, or the scores measure their guess at what "quieter" means instead of the feature itself. Some product decisions aren't a good fit for conjoint at all, and our article on when not to use conjoint analysis lists ten of them.
Want to see category importance, marginal willingness to pay and the simulator working on actual survey results, segment filter included? A demo walks through a live conjoint results dashboard.
Why does a product concept test have to end with a purchase?
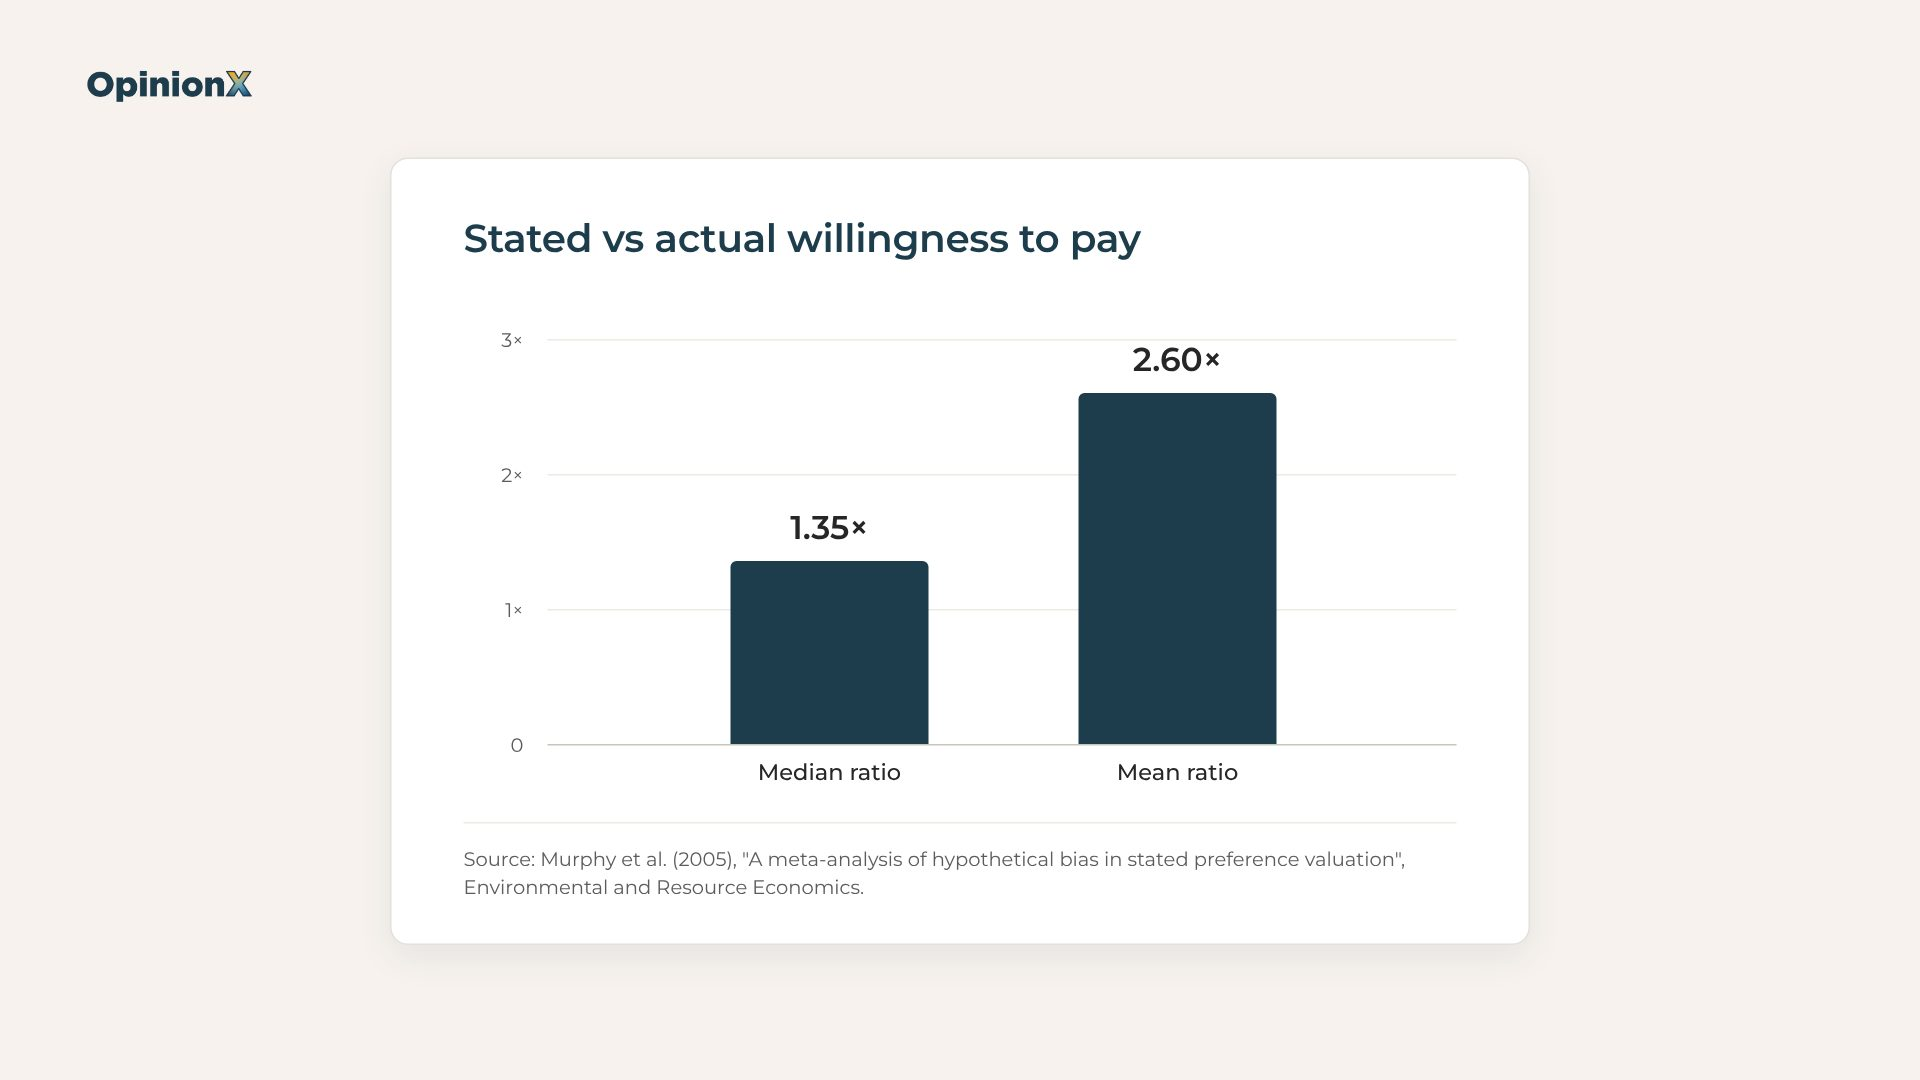
A product concept test has to end with a purchase because people overstate what they'd pay when answering a survey, and researchers have measured by how much. James Murphy and three co-authors combined 28 studies that compared what people said they'd pay with what they actually paid, covering 83 comparisons in total (Environmental and Resource Economics, 2005). In the typical comparison, stated values ran 1.35 times higher than actual payments, while the average was 2.60 times, pulled up by a few studies where the gap was far wider, and the full range ran from 0.76 to 25.08 times (working paper, 2003). This overstatement is called hypothetical bias, meaning the gap between what people say they'd do when nothing's at stake and what they do when real money is involved.
Hypothetical bias hits conjoint analysis too. Min Ding, Rajdeep Grewal and John Liechty ran a field experiment in a Chinese restaurant, comparing a standard conjoint survey about dinner specials with a version where participants had to live with the meal they chose. Their finding, in the paper's own words: "incentive-aligned choice conjoint outperforms hypothetical choice conjoint in out-of-sample predictions" (Journal of Marketing Research, 2005). In the working paper version, the incentive-aligned survey correctly predicted diners' top two choices 59% of the time, against 26% for the standard survey, and participants with something at stake were more sensitive to price (working paper).
Hypothetical bias is why a survey can't be the last step in a product concept test, and why Study 4 runs outside any survey tool: no survey platform, OpinionX included, can make a survey answer binding. OpinionX's Van Westendorp question type already counts "definitely would buy" as an 80% chance of buying rather than 100% when it builds the revenue chart, because stated intent runs ahead of actual buying. That correction helps you pick a price, but it doesn't replace a test where people pay.
The right purchase test depends on what you're launching:
Physical product: a pre-order page or a refundable deposit page at a price from Study 3's acceptable price range. In the grinder example, offer the quiet-motor version to existing customers by email and count how many place a deposit.
Software or a service from an existing company: a paid pilot with a few customers, an early-access offer at the tested price to existing customers, or a pre-sale of the add-on before it's built.
Study 4 doesn't prove demand for every market you'll sell into, but it tells you something no survey can: how many people put money down. If the commitment rate is low, go back to Study 2's segment results and check whether you offered the product to the wrong group of customers before you decide the product itself has failed.
How do you run the three survey studies on OpinionX?
Studies 1 to 3 run as separate surveys on OpinionX, and every method they use is on every plan, including the free one: conjoint analysis and the Van Westendorp question type both run there, capped at 25 participants per survey, as listed on our pricing page. That's enough to pilot the design and check that people understand the categories and options, though not enough to make the build decision, especially once you filter results by segment and each segment holds only part of your participants. To size the full study, open OpinionX's conjoint calculator from the Conjoint Rank setup card, which works out how many participants you need from three inputs: the number of options in your biggest category, the number of product versions shown per question and the number of questions each person answers.
OpinionX doesn't supply participants, so you bring your own audience, and existing customers are the natural first group to survey for a product they might buy next. If you need people outside your customer base, you can connect a third-party panel by passing each person's details into the survey through hidden fields. Our guide on screener questions shows how to filter out people outside your target market, and our guide on survey quotas shows how to cap the participants from each group so one segment doesn't swamp the results.
For Study 3, you can add a Gabor Granger question to the same survey if you want a demand curve as well as the acceptable price range. Gabor Granger offers each participant one price at a time and asks if they'd buy at it, which tells you which price in your range earns the most revenue, and our guide on running Van Westendorp and Gabor Granger in one survey covers the setup.
Frequently asked questions
How do you validate a product concept before launch?
Validate a product concept with four studies in order. Interviews and a survey find what buyers care about, and a conjoint analysis tests whether your unique selling point wins trade-offs. A Van Westendorp survey then sets an acceptable price range, and a pre-order or paid pilot measures actual purchases.
Can conjoint analysis test a unique selling point?
Yes. Conjoint analysis tests a unique selling point by including it as one option in a category, next to competitor features and a price category. Category importance shows whether the USP changes choices, marginal willingness to pay puts a dollar value on it, and the market simulator predicts whether it wins share.
Should you test price before or after product features?
Test product features before price. A Van Westendorp pricing survey asks participants to price one specific product, so a conjoint analysis has to settle the features first. Pricing an undecided product gives you an acceptable price range for a version you might not build.
Is a pre-order test better than a survey for validating demand?
A pre-order test measures demand more accurately than a survey because people pay real money. Across 28 studies, stated values ran a median of 1.35 times higher than actual payments (Murphy et al., 2005). Surveys explain why people would buy, and the pre-order shows whether they do.
What's the difference between concept testing and idea validation?
Idea validation checks whether a customer problem is worth solving before you design anything, while product concept testing checks whether a specific product design, its unique selling point and its price will win buyers. Founders still testing a business idea should start with idea validation and the Discovery Sandwich instead.
If you're still choosing which customer problem to solve, our guide on how to validate a product idea walks through problem discovery and ranking before you design any product. If you're ready for Study 2, our conjoint analysis guide explains how to choose categories and options and how the scores get calculated. For more research guides organised by the decision you're making, see our use cases.
