
When marketing researchers Timothy Gilbride and Greg Allenby modelled a camera conjoint study in 2004 and allowed for screening, they found that "92% of respondents screen alternatives on one or more attributes" (Marketing Science, 2004). Screening means people rule an option out before they compare anything else, so a profile carrying that option has no chance of being chosen. The standard conjoint model can't show this, because it lets a good price make up for a refused brand.
Rejection rate in conjoint analysis is the measure that shows which options people screen out. It's the share of choices where a participant picked "None of the above" instead of a profile carrying a given option. Read it within one category: rejection piled onto one or two options marks a dealbreaker, while rejection spread evenly across every option means the profiles were too alike or the sample includes people who'd never buy.
Below, we go through why the standard model misses dealbreakers, how rejection rate is calculated, what the none option should say, the three reasons people pick None (and how to tell them apart), what a none option costs you and where rejection shows up in OpinionX's results.
Why does the standard conjoint model miss dealbreakers?
Conjoint analysis is a survey method that shows people several versions of a product, called profiles, and asks them to pick the one they'd buy. Each profile combines one option from each category, such as a brand, a storage size and a price. (Textbooks call categories "attributes" and options "levels".) From hundreds of these choices, the analysis works out a score for every option, showing how much each one pushes people towards or away from a profile. Our conjoint analysis guide walks through the whole method if you're new to it.
The scoring model behind most conjoint studies, including the Hierarchical Bayes multinomial logit model (HB-MNL) that OpinionX uses for conjoint scoring, is compensatory. Compensatory means a strong option can make up for a weak one: a low enough price, or a loved enough brand, can buy back a profile that carries something the participant dislikes. Our guide on how conjoint results are calculated shows how those scores add up into a total for each profile.
Plenty of buyers don't choose that way, though. A screening rule is a personal cut-off that removes an option from consideration before any trade-off happens, such as "I won't buy a phone from that brand" or "nothing over $1,000".
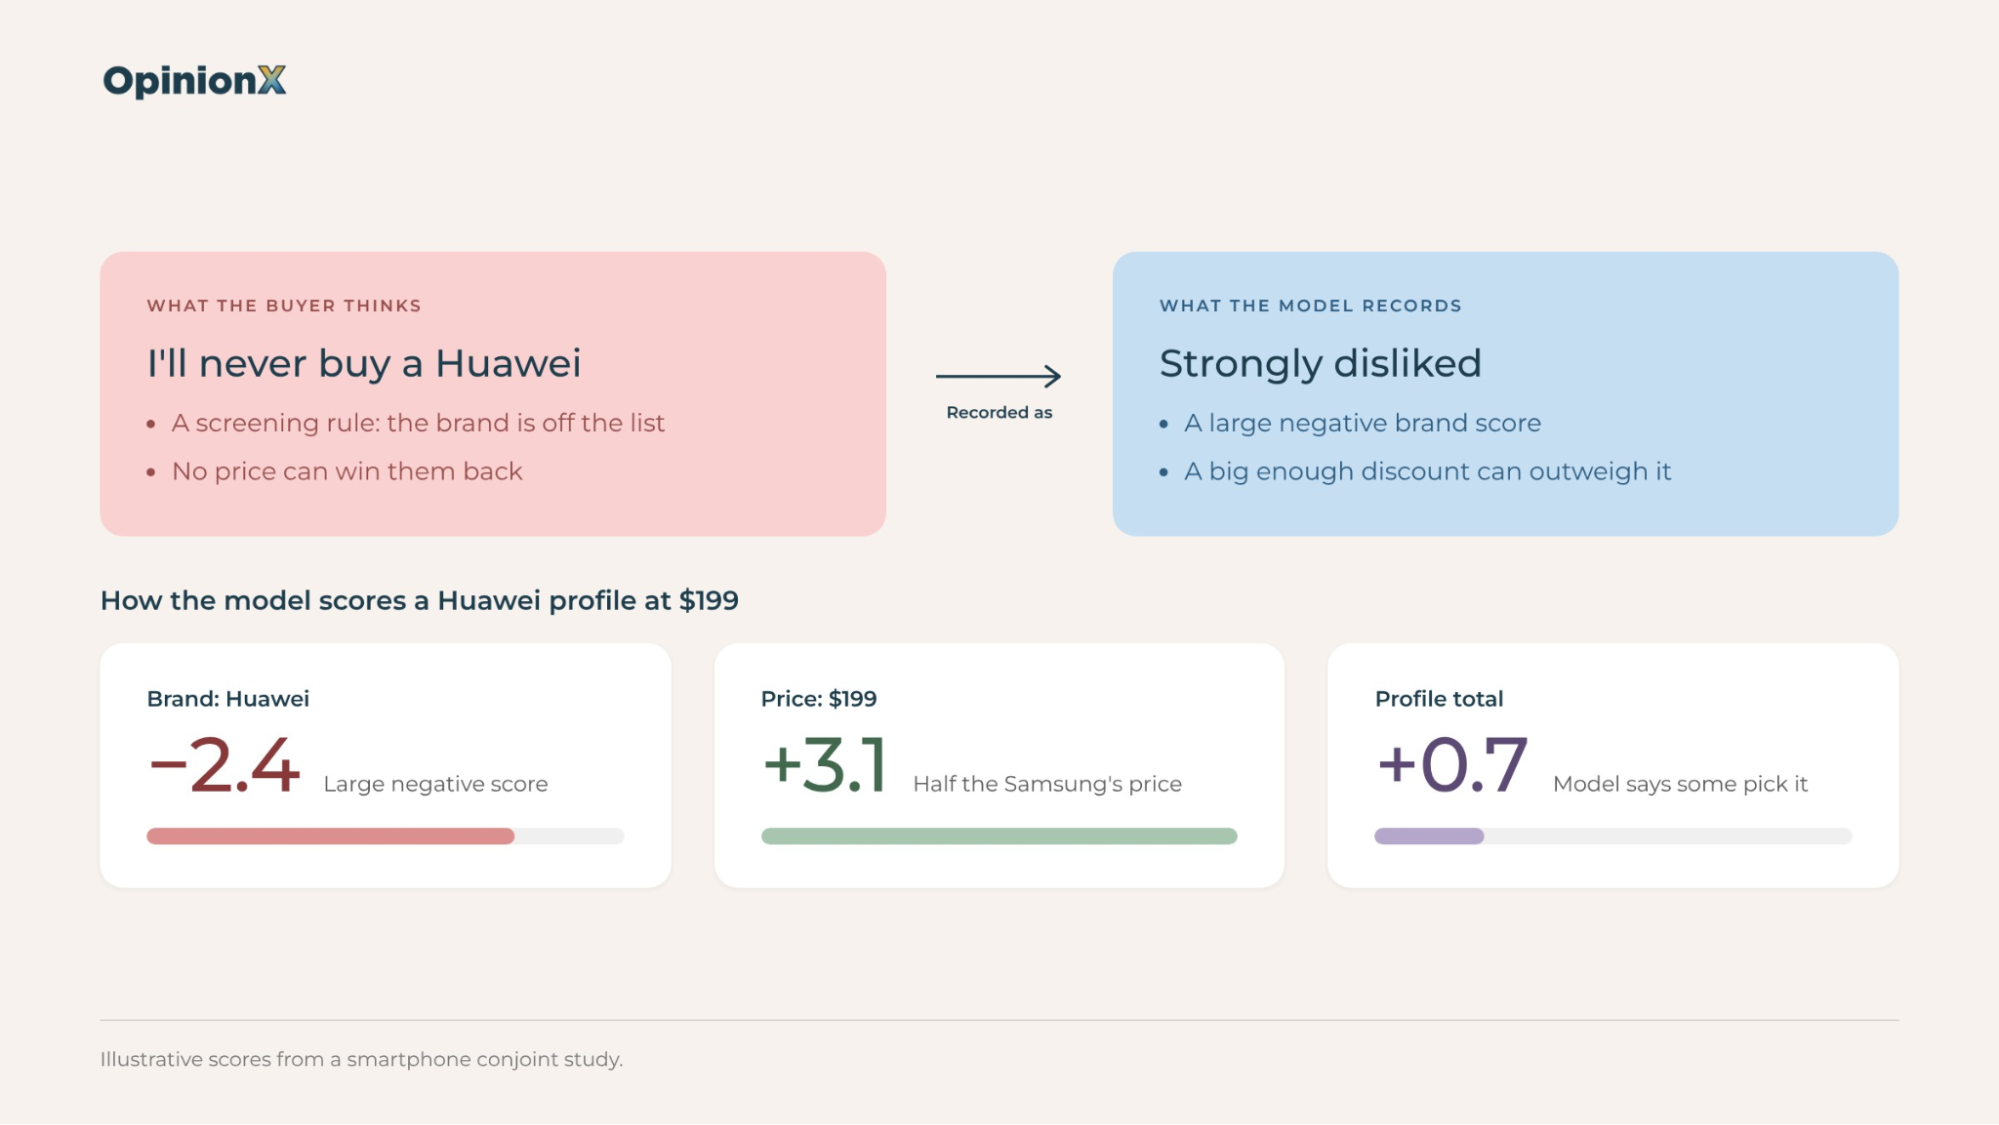
Take a smartphone study. Someone who refuses to buy a Huawei phone won't pick a Huawei profile at $199, even at half the price of the Samsung next to it. The compensatory model has no way to record "never", so it records "strongly disliked" instead, which is a large negative score that a big enough discount can still outweigh.
You'll see the gap between "never" and "strongly disliked" when you use the results. A conjoint market simulator predicts how many people would choose each product in a scenario you set up. Because the model treats every dislike as something a better offer can overcome, the simulator will move a share of people onto a cheaper Huawei profile that was never on their list in the first place. The prediction looks precise, and it's wrong for the people most likely to swing the decision.
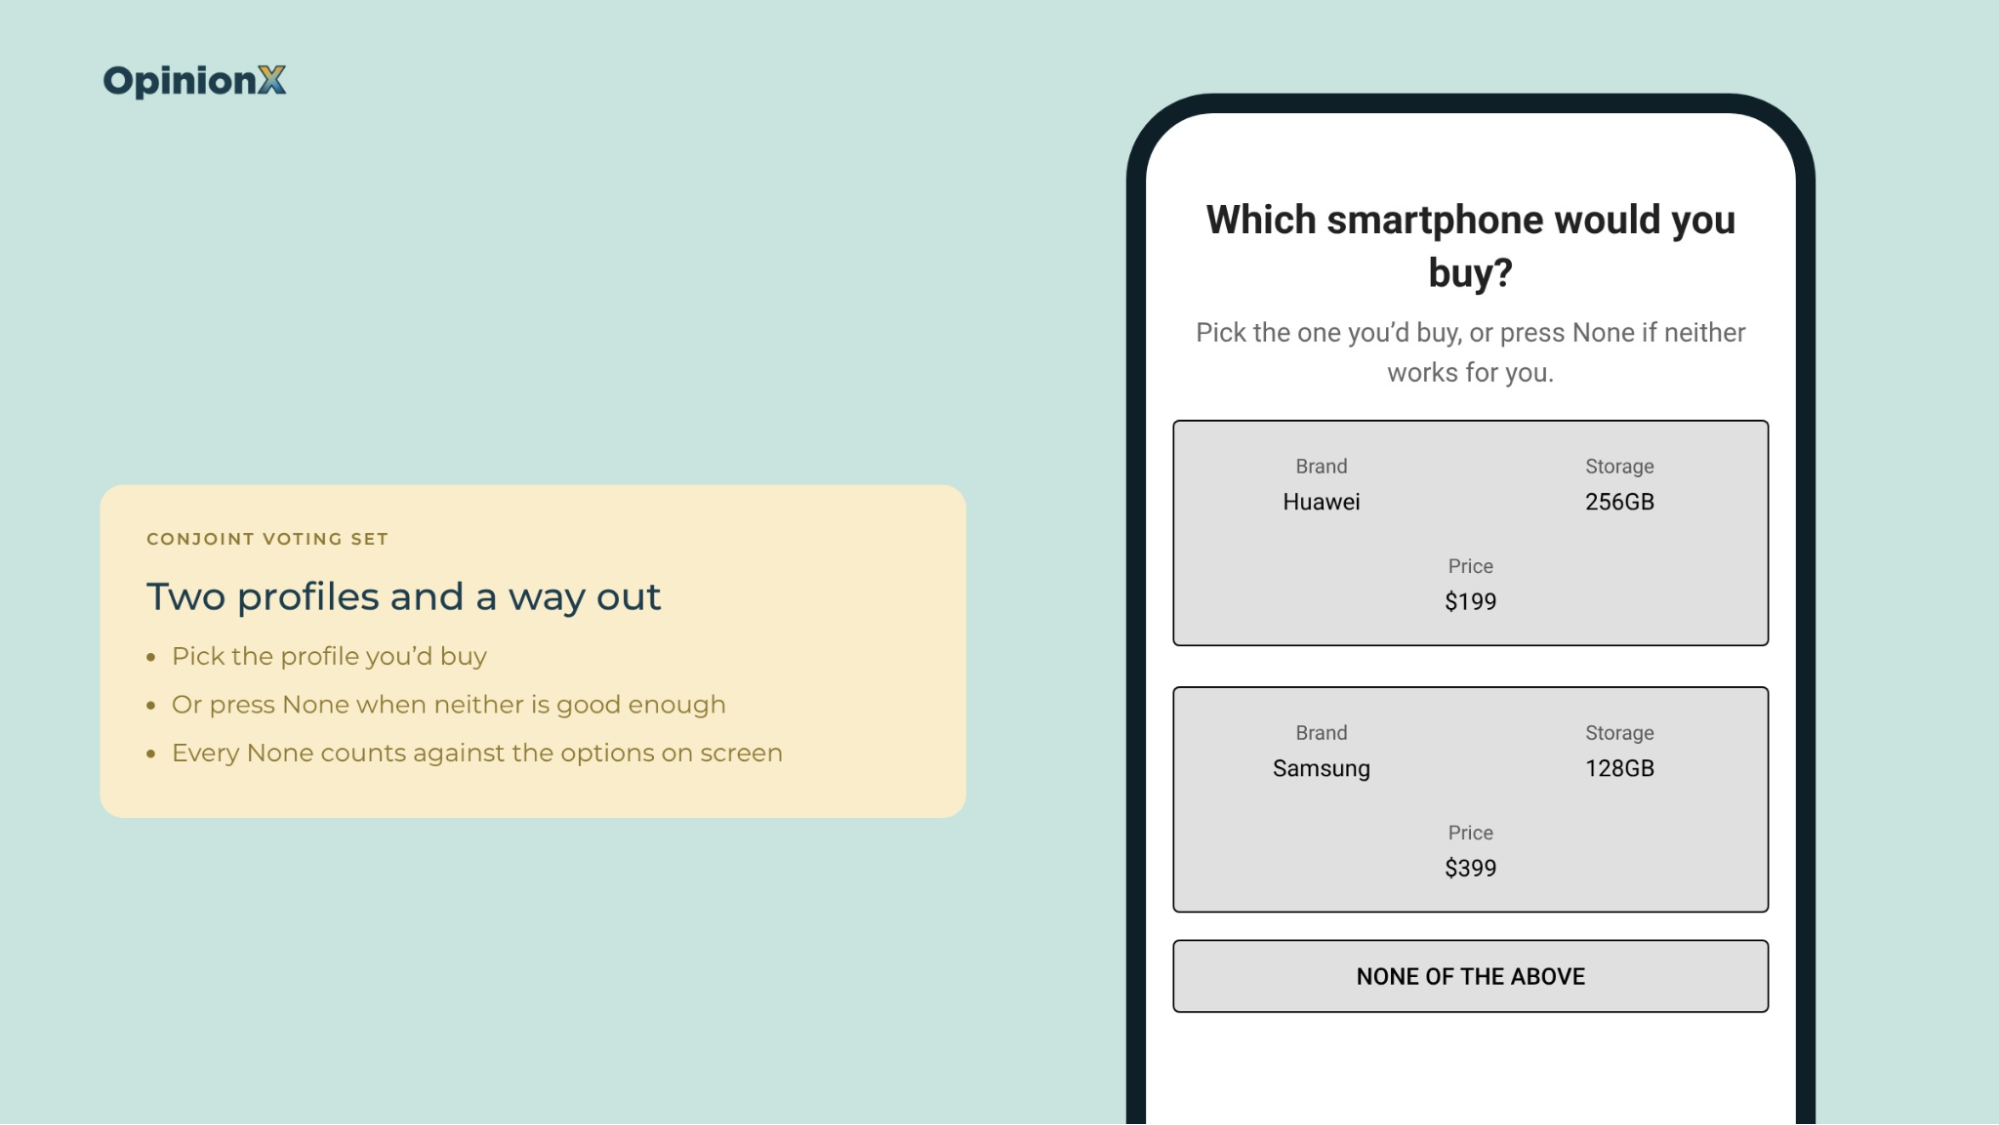
A none option fixes part of this. It's an extra button on each conjoint question that lets a participant say "none of these" instead of picking a profile, and rejection rate shows which options make them press it.
What is rejection rate in conjoint analysis?
💡 Rejection rate in conjoint analysis is, for each option, the share of voting sets where that option appeared on at least one profile and the participant chose None instead of picking a profile. A voting set is one conjoint question: the group of profiles a participant sees on a single screen.
OpinionX calculates rejection rate per option, not per profile. Every time a participant presses None, it counts that rejection against every option visible on the screen at the time, then divides each option's rejections by the voting sets where that option appeared.
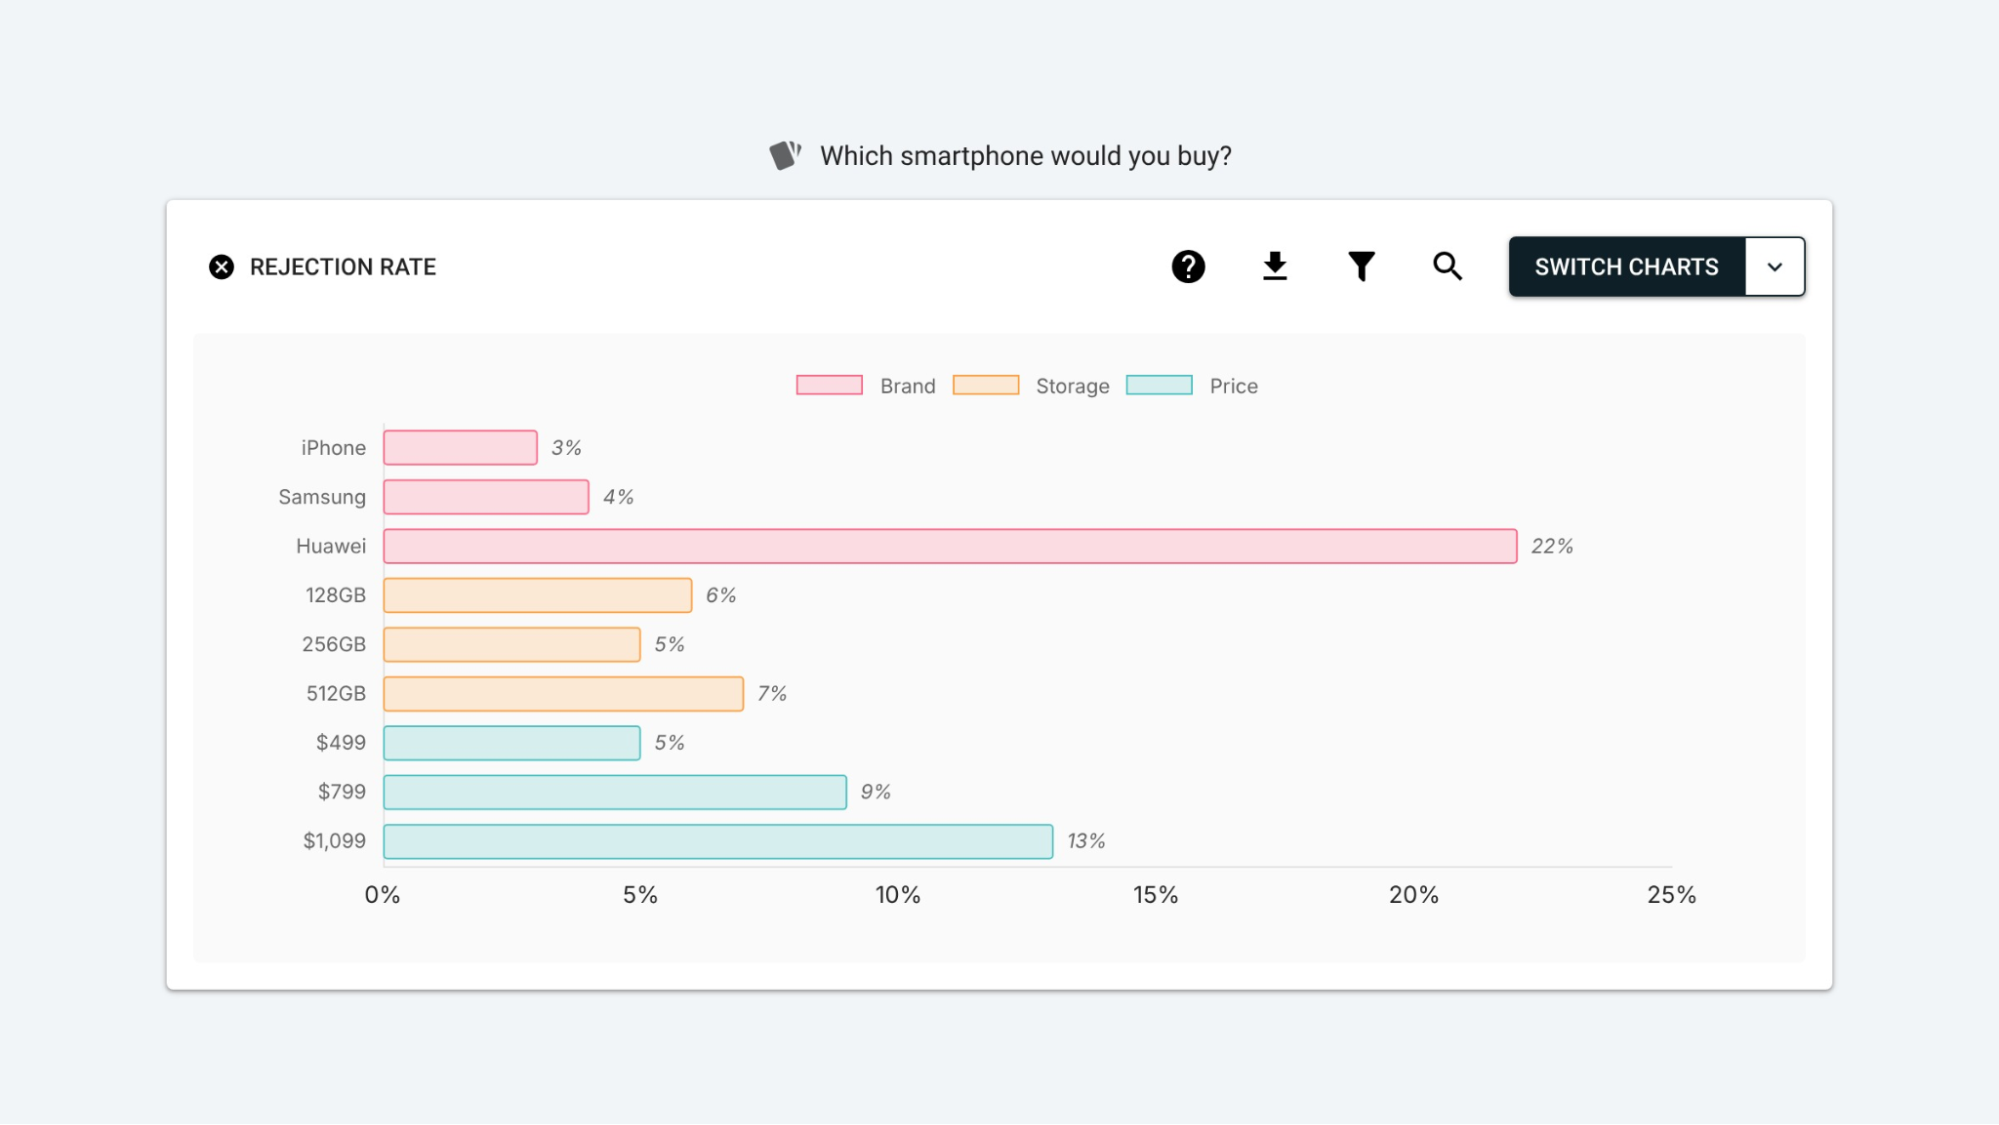
OpinionX's own example uses a smartphone study. The iPhone option has a rejection rate of 3%, meaning that in 100 voting sets where "iPhone" showed up on at least one of the two profiles, the participant chose None three times instead of a profile.
One option's rate on its own won't tell you much, so look at the whole Brand category. Here are two illustrative results for the same three brands:
Result A: iPhone 3%, Samsung 4%, Huawei 22%. Huawei's rate is five to seven times higher than its neighbours, so something about Huawei sends people to the None button that the other two brands don't.
Result B: iPhone 11%, Samsung 12%, Huawei 10%. Every brand sits within two points of the others, so people are pressing None at the same rate whichever brand is on screen.
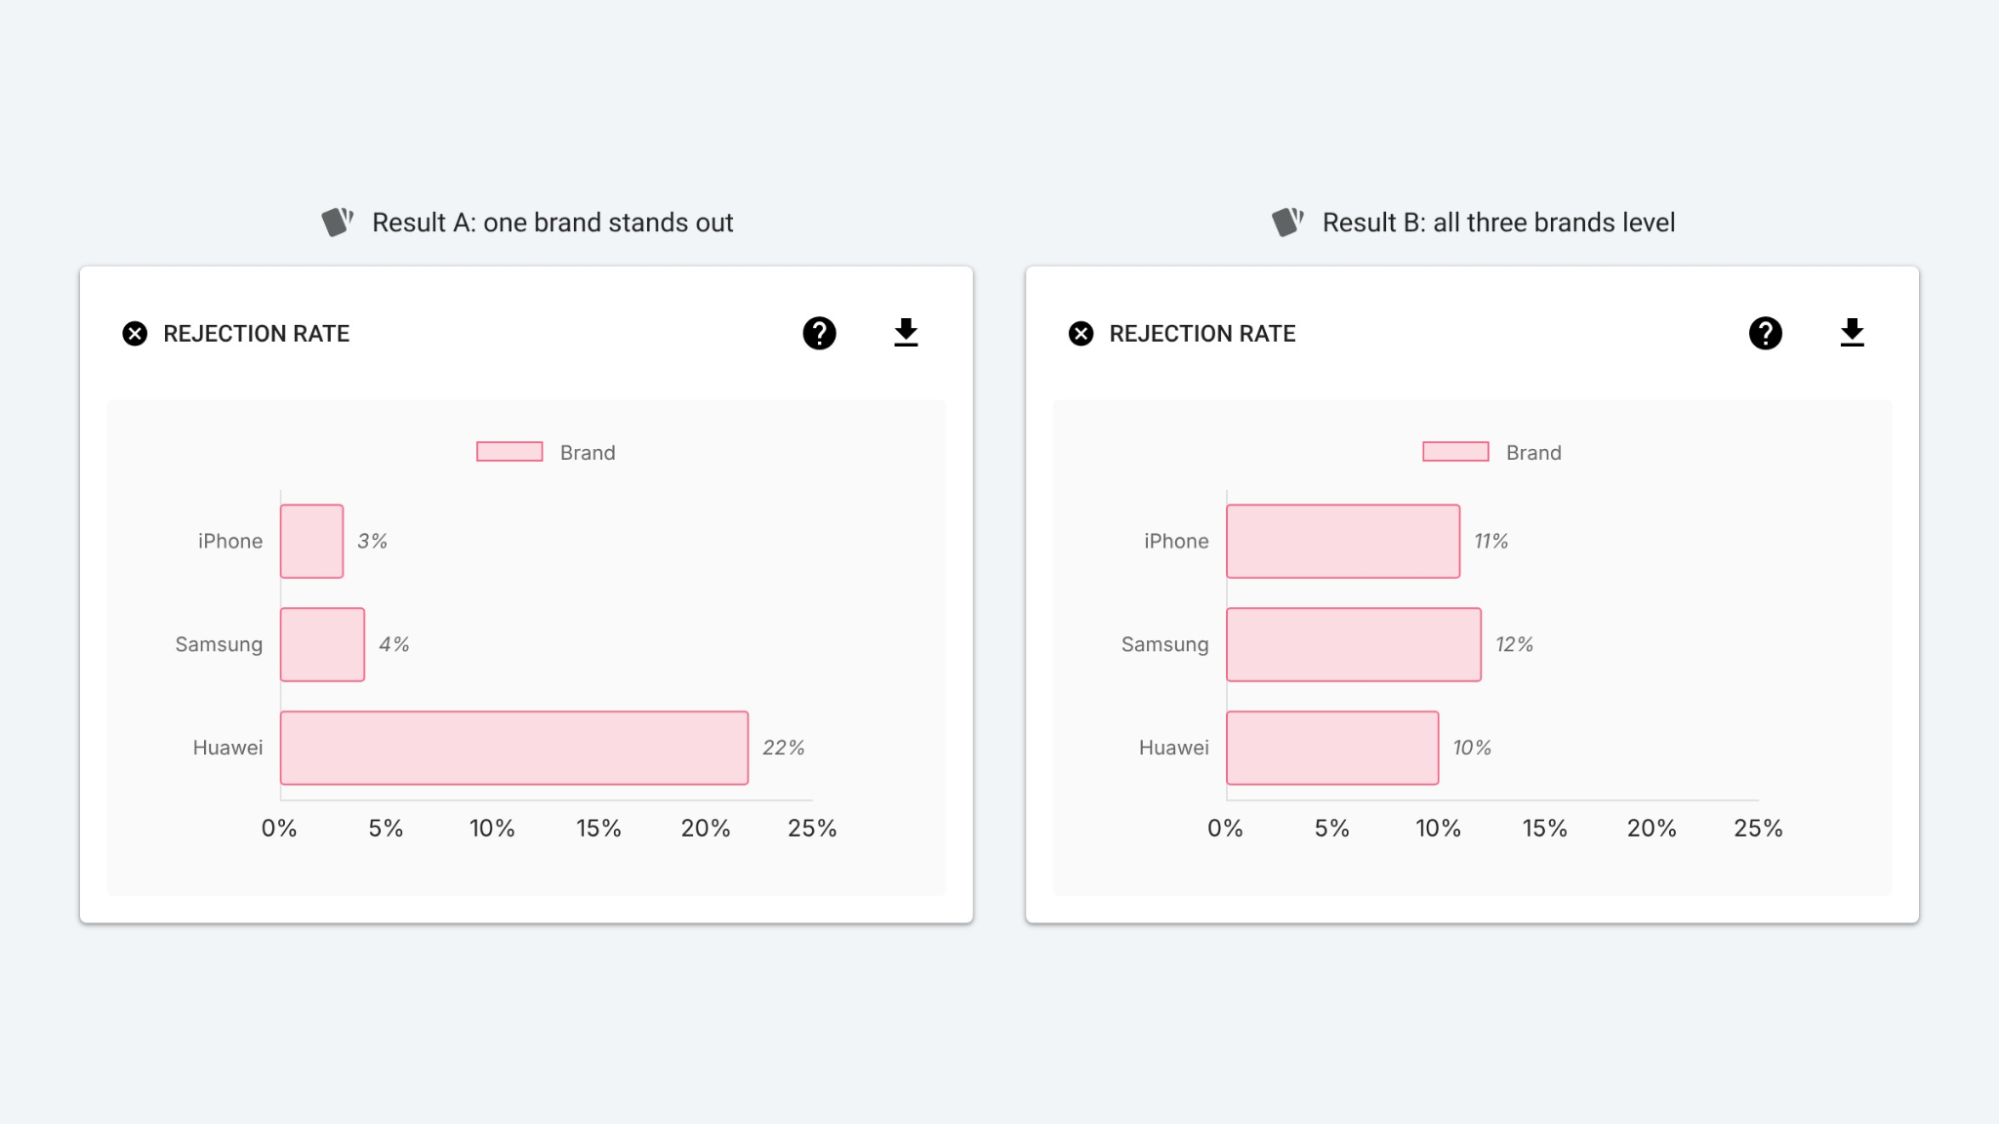
People pressed None in both results, but each points to a different problem with a different fix. Result A is a dealbreaker on one option, while Result B is something else entirely (the section on the three reasons people pick None explains how to tell which).
Why compare rejection rates only within one category?
Rejection rates only compare fairly within one category, such as iPhone against Samsung against Huawei, and never across categories, such as a brand's rate against a price's rate. Why? Because of the way conjoint builds its profiles.
In a standard conjoint survey, the survey picks the options it shows together at random and balances them across participants. Every brand appears next to cheap prices, expensive prices, small storage and large storage roughly equally often. When you compare iPhone's rejection rate with Huawei's, the other categories on screen have evened out, so the difference between the two rates comes from the brand.
Comparing iPhone's 3% with the $1,099 price's 25% breaks that logic. The two options belong to different categories and each one's rate comes from a different mix of voting sets, so the gap between them doesn't tell you which one people object to more.
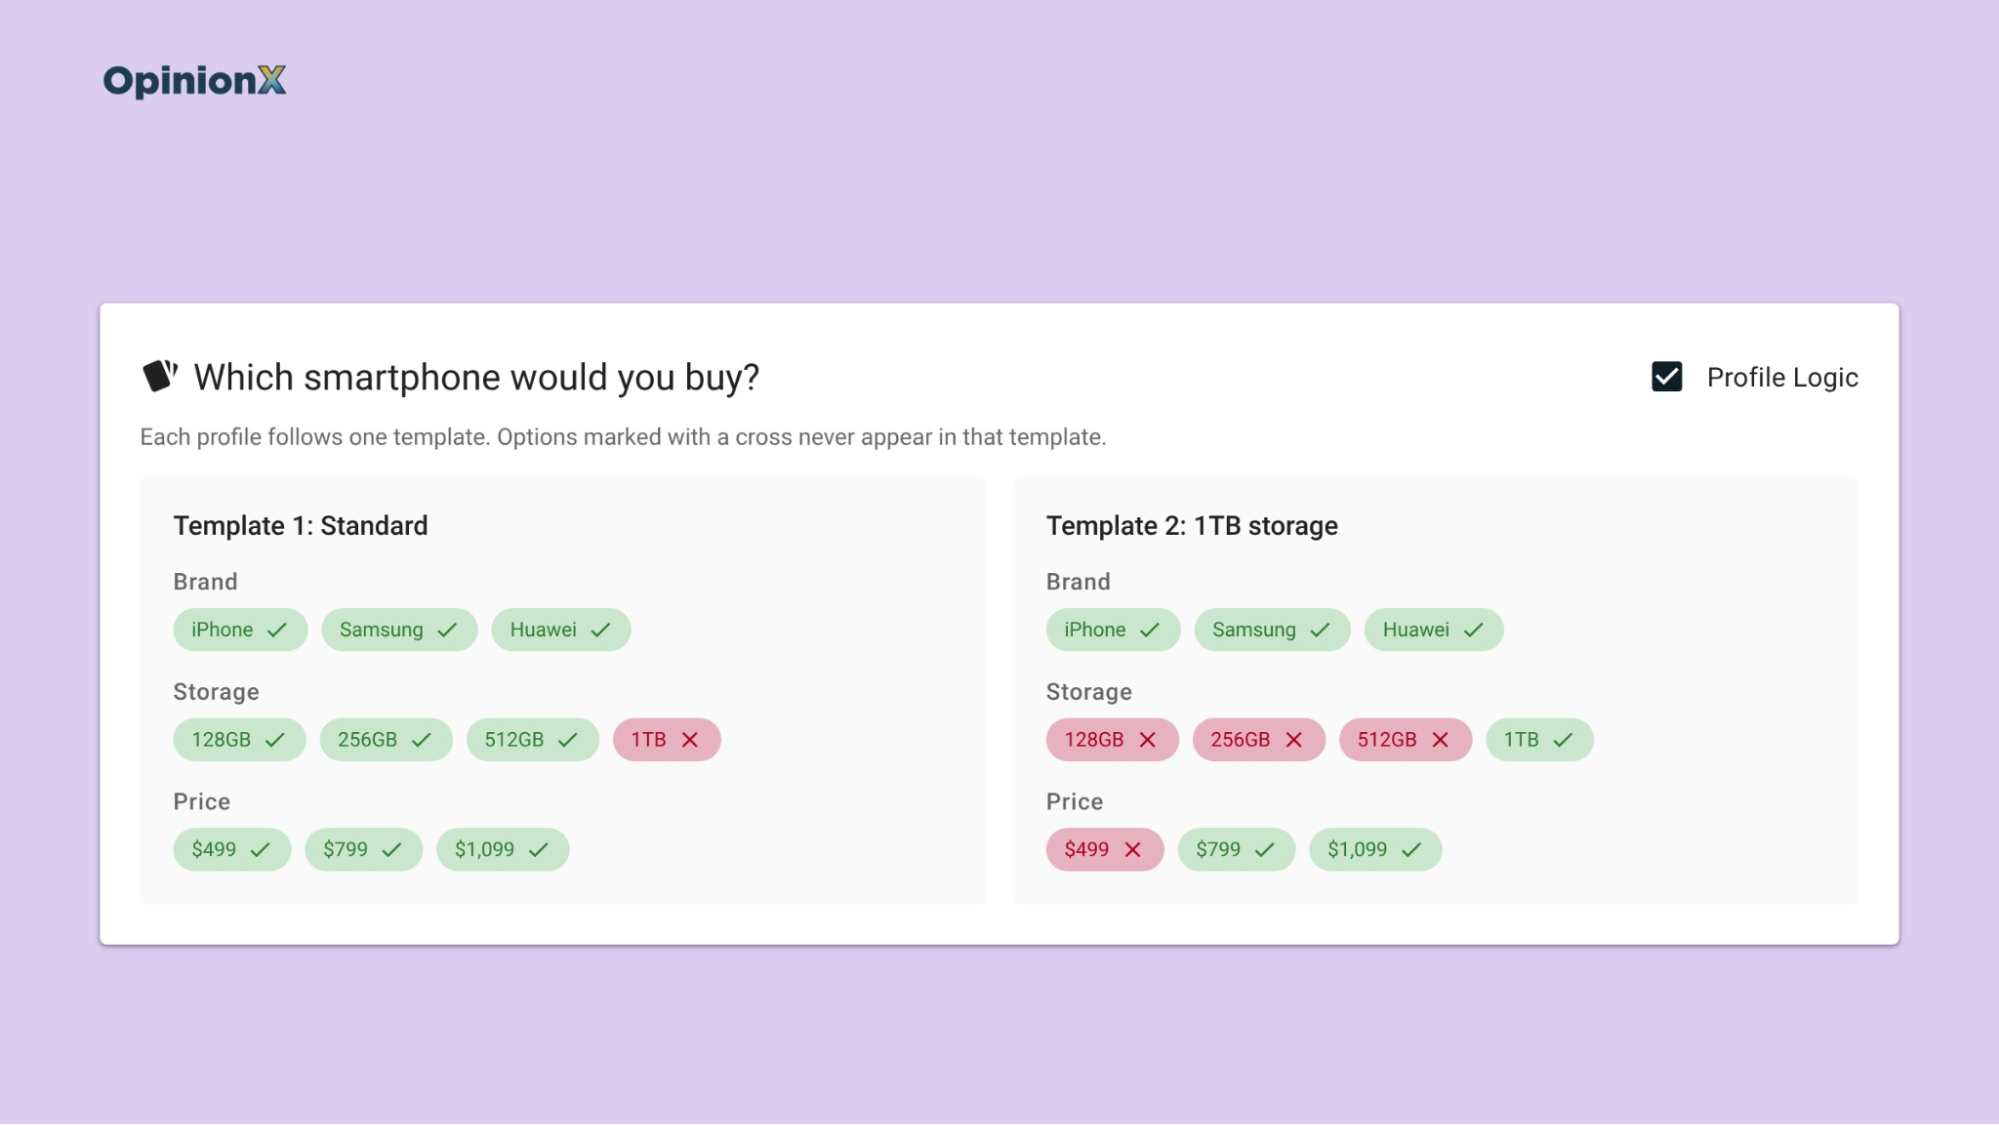
Profile Logic breaks the balance too. Profile Logic (previously called Prohibited Pairs) is an OpinionX setting that stops certain options from appearing together in one profile, so you don't show people combinations that can't exist, like a large plant in a hanging pot.
With Profile Logic switched on, an option that can only appear next to certain other options takes on part of their rejection rate as well. Say the 1TB storage option can only appear with the two highest prices: a high rejection rate on 1TB might be a reaction to those prices, not to the storage. Read the rejection rates of restricted options with care, and only restrict combinations that actually can't exist, since unrestricted randomisation gives cleaner data across the whole study.
What should the none option say in a conjoint survey?
The none option's label decides what rejection rate measures, so writing it is a research design decision, not a wording detail. The button does the same job whatever it says, but participants answer the question the label asks.
OpinionX's launch of the None of the Above button gave two examples that show the difference:
"I would prefer to keep my current solution" measures switching. A participant who presses that button is saying none of the profiles is good enough to leave what they use today. Use this when you're designing a product to win customers from a competitor or from a spreadsheet.
"I would rather cancel my subscription" measures churn, meaning the share of existing customers who'd leave. Use this when you're testing a price rise or a change to the plans your current customers are on.
A plain "None of these" sits somewhere vague between the two. One participant reads it as "I'd keep shopping", another as "I'd buy nothing", and the rejection rate mixes both. Write the label as the alternative your buyer actually has, in the words they'd use for it.
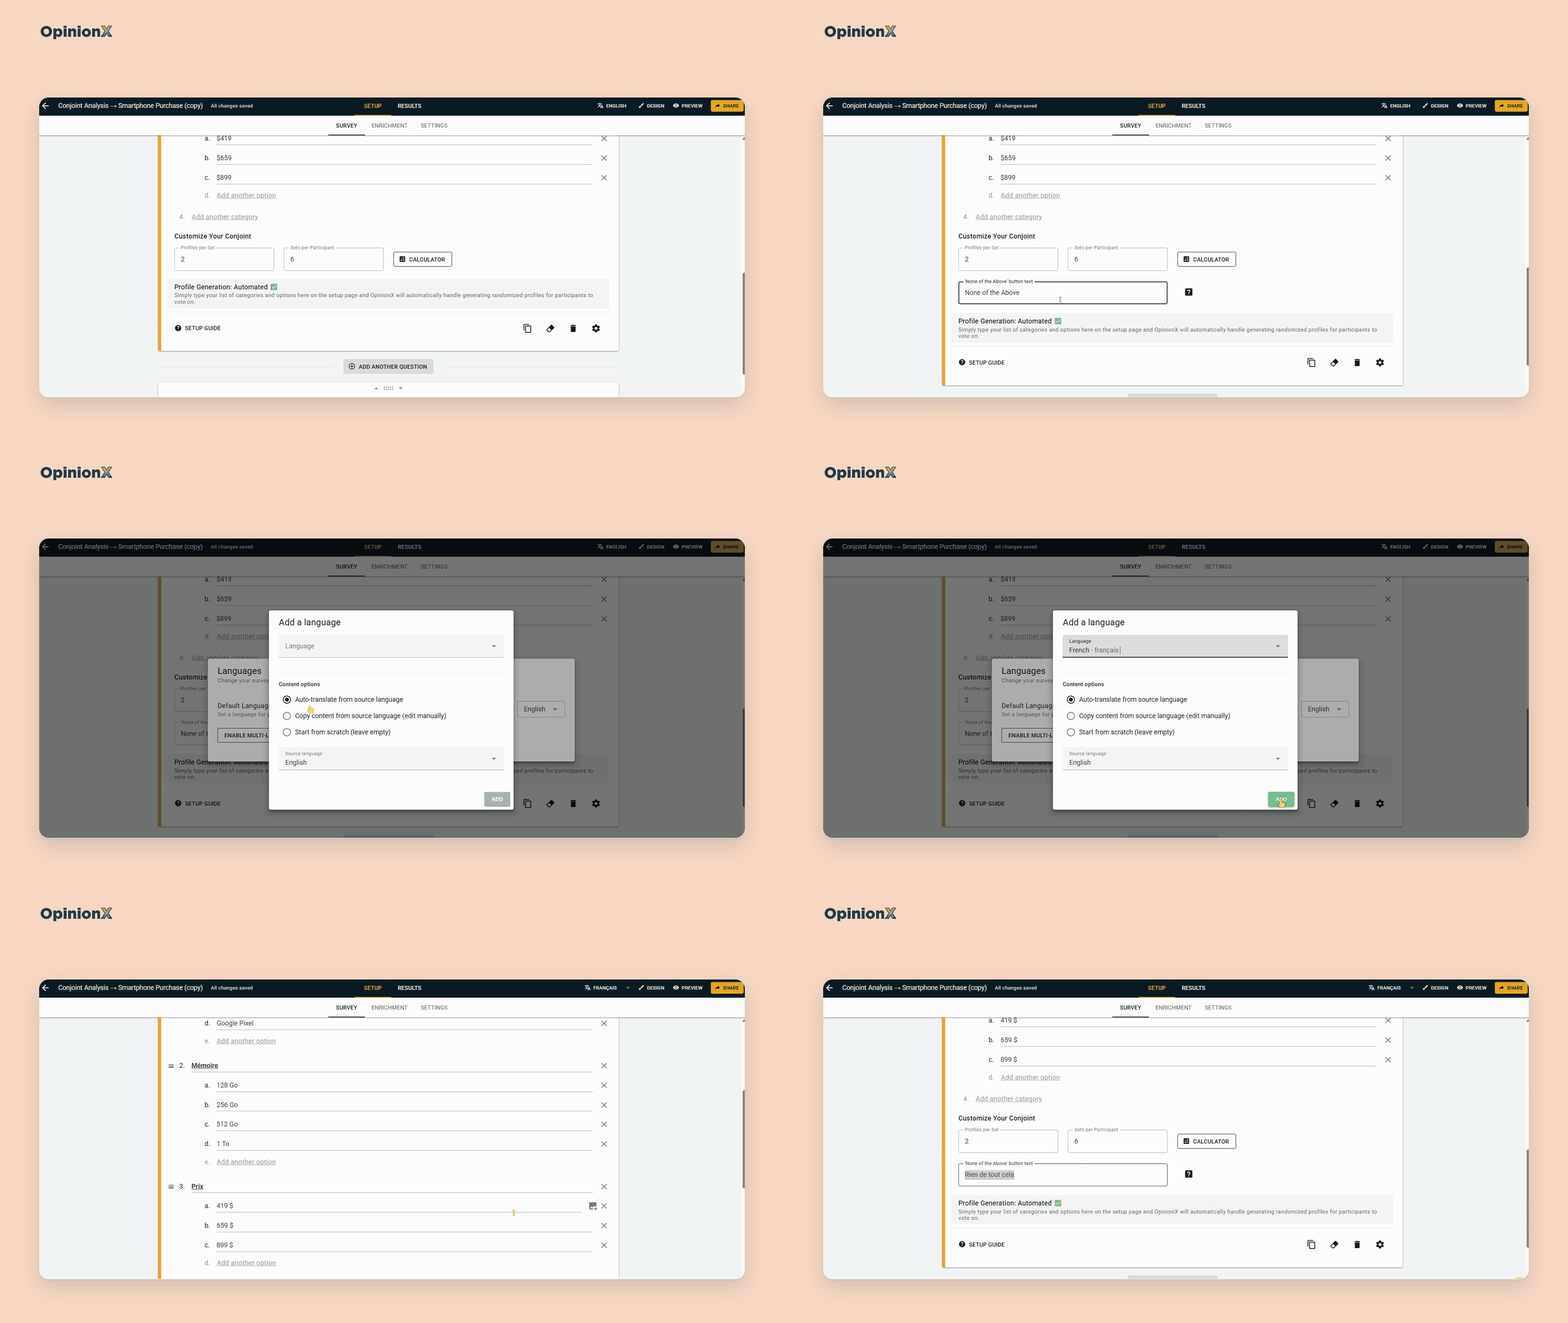
You set the label on the Survey Setup page, in any language your survey uses, including a survey with several language versions in one set of results. Whatever label you pick, report it next to every rejection figure you share. "22% of participants would keep their current phone rather than buy a Huawei profile" is a finding someone can act on, while "Huawei had a 22% rejection rate" leaves the reader guessing what people rejected and what they'd pick instead.
Writing a none label that measures switching instead of indecision takes some care. Book a free setup call and a research expert will look over your label and the options you plan to test before the survey goes live.
What are the three reasons people pick None?
People press the None button for three different reasons, and each one leaves a different pattern in the Rejection Rate chart. Reading that pattern is the main skill to learn here, because each reason has its own fix and the wrong fix makes the study worse.
The first reason is a dealbreaker. A dealbreaker is an option some participants won't accept at any price, which is the screening rule Gilbride and Allenby measured. In the Rejection Rate chart, a dealbreaker shows up as rejection piled onto one or two options within a category, far above their neighbours, like Huawei's 22% in Result A above.
The second reason is a close call. A close call happens when the profiles on screen are so similar in appeal that choosing between them feels hard, so the participant puts off the choice instead. Ravi Dhar, a marketing professor at Yale, showed this in a 1997 study in the Journal of Consumer Research. When people saw one pair of bookshelf speakers, 38% chose not to buy; adding a second, equally attractive pair pushed that to 50%. When the second pair was worse than the first, it fell to 29%, because the worse option made the first one easier to pick.
Dhar's other results point the same way. Across four product categories, adding an equally attractive option raised the share of people who put off choosing by about 11 percentage points (190 participants). In a later study from the same paper, letting people pick both close options cut deferral by 21 points (280 participants), which shows the problem was how hard the choice was, not a lack of interest in the product.
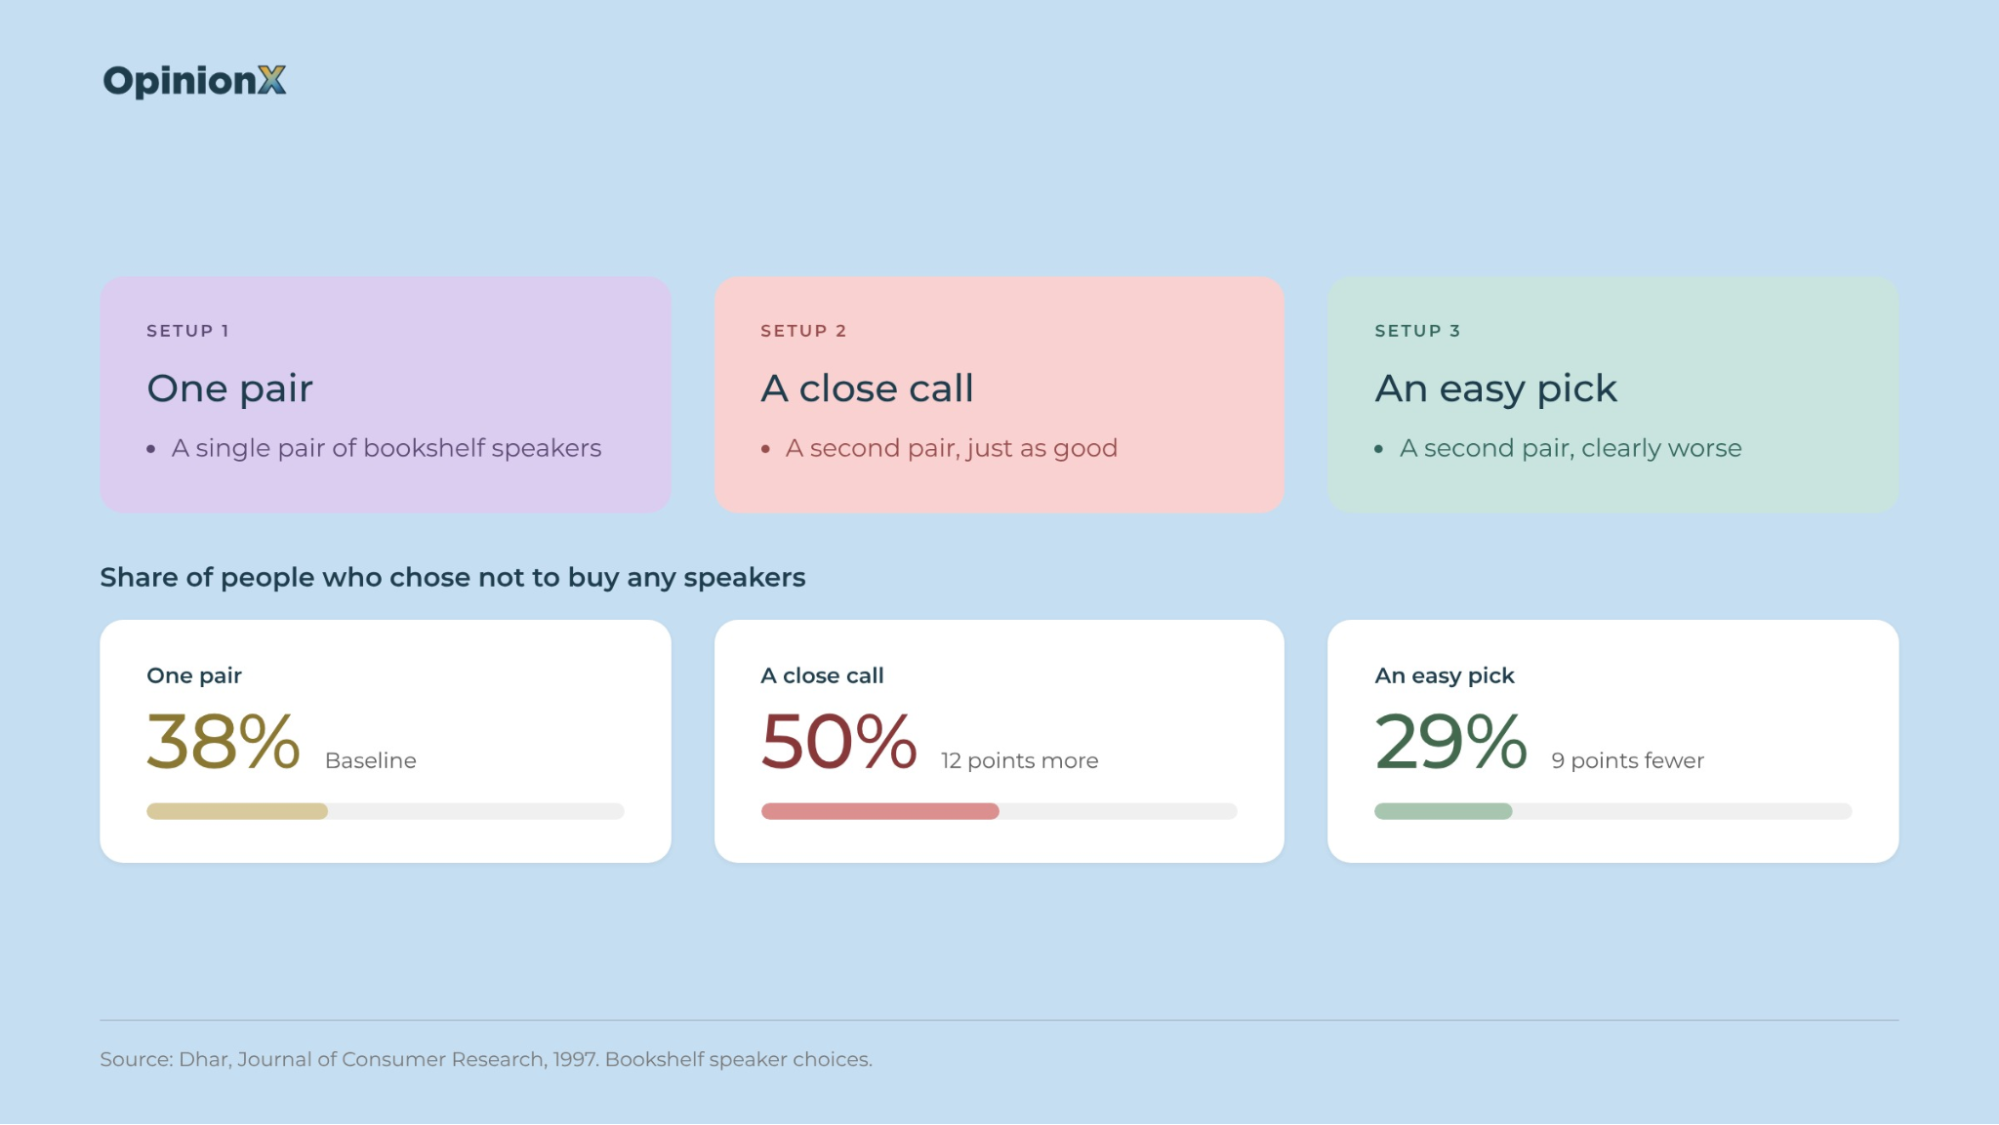
In the Rejection Rate chart, close calls show up as rejection spread roughly evenly across every option, like Result B above. A flat rejection profile usually means the profiles were too alike, not that people don't want the product.
The third reason is non-buyers. If your sample includes people who'd never buy a product like yours, they'll press None on almost every screen, whatever the profiles contain. That also shows up as a flat rejection profile, but a high one, with every option sitting at 30% or 40% instead of 10%. The fix happens before the conjoint, with screening questions that keep people outside your target market out of the survey. Our guide to writing screener questions covers how to do that without telling people which answer gets them in, and OpinionX's screening-out and quota settings end the survey for anyone who doesn't qualify.
The table below puts the three reasons side by side, with the fix for each and what that fix costs you:
| Reason for None | Pattern in the Rejection Rate chart | What it means for the decision | The fix | What the fix costs you |
|---|---|---|---|---|
| Dealbreaker | One or two options in a category far above their neighbours | Some buyers won't accept that option at any price, so a simulator built on scores alone overstates its share | Drop the option, reprice it, or keep it only in a version aimed at the customer segment that accepts it | Dropping it loses the buyers who wanted it; keeping it means a second product version to build and sell |
| Close call | Rejection spread evenly across options, at a low to moderate rate | The profiles were too similar to choose between, which says nothing about whether people want the product | Widen the gaps between options, such as more distance between prices or storage sizes | Wider gaps tell you less about small differences, such as $649 against $699 |
| Non-buyer | Rejection spread evenly across options, at a high rate | Part of the sample sits outside your market and is diluting every result | Tighten the screener questions before the conjoint | More people screened out, so recruiting the same completes takes longer or costs more |
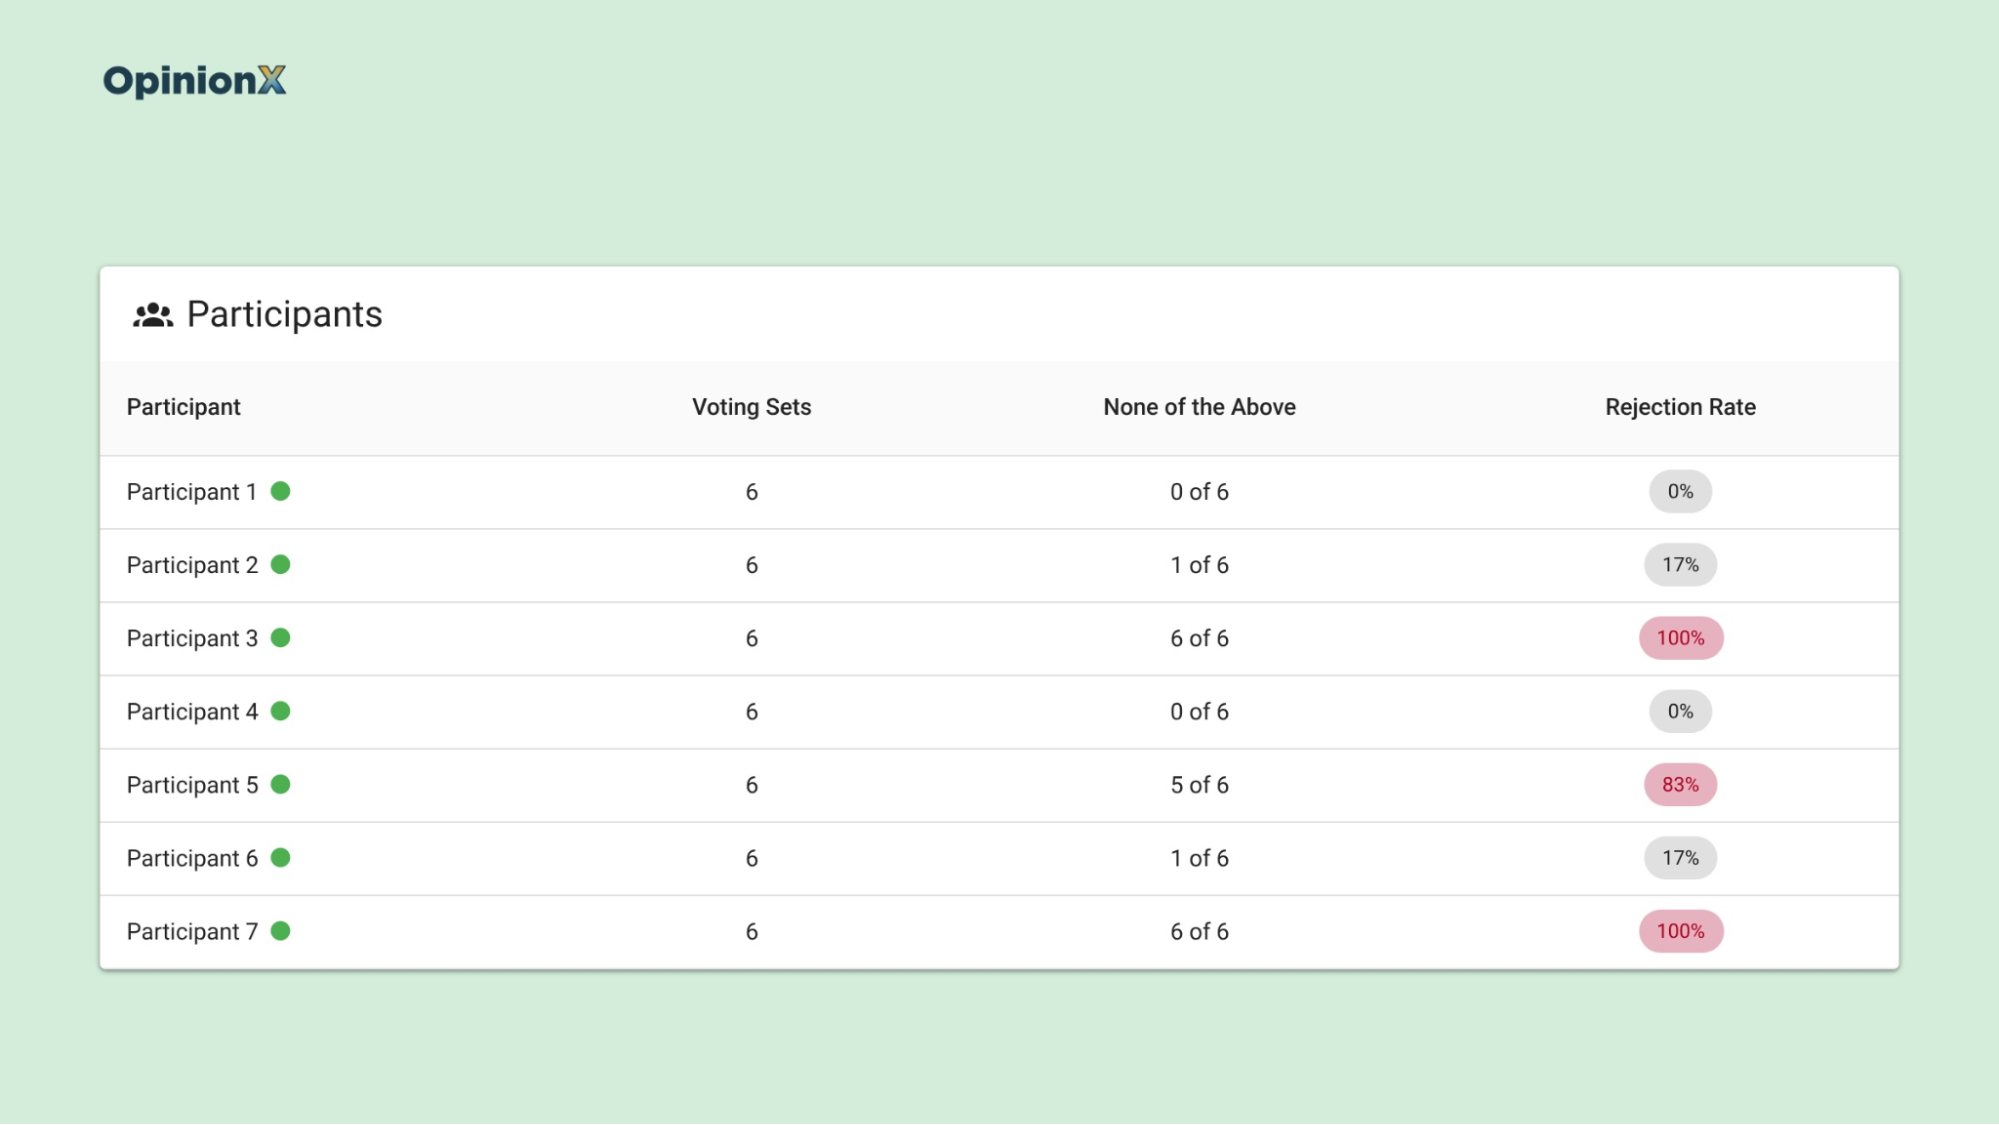
A close call and a non-buyer can look alike in the overall chart, since both are flat, but the Participants tab separates them. If a handful of participants pressed None on nearly every screen, you have non-buyers; if rejection is spread thinly across most participants, you have close calls. Our guide to participant-level data explains why individual answers often tell you more than the average.
What are the disadvantages of adding a none option?
A none option gives you rejection data and takes away some trade-off data in return. Jeff Brazell and colleagues, writing in Marketing Letters in 2006, noted that a no-choice option helps a conjoint "better mimic consumer choices", since buyers in a shop can always walk away. They also pointed out the catch: when someone picks None, you learn nothing about how the profiles on that screen compare with each other.
Every conjoint choice is evidence about which options people prefer. A participant who picks a profile tells you it beat the others on screen, while a participant who presses None only tells you none of them was good enough, not which one came closest. If 30% of voting sets end in None, the scores for each option come from 70% of the choices you collected.
So a study with a lot of rejection needs more voting sets per participant, more participants, or both, to get scores as precise as a study without a none option. As a rough guide, if you expect around a quarter of choices to end in None, plan for about a third more participants than you'd otherwise recruit. For example, 400 participants instead of 300 keeps your profile choices close to the original plan, because 75% of 400 is 300. If you need help finding them, our guide on where to find free survey participants covers three ways to recruit without a paid panel.
The cost is worth paying when "would they buy at all?" is as important as "which version wins?", such as in pricing, packaging and churn studies. It's harder to justify in a study that only ranks features for a roadmap, where every participant is an existing customer who'll keep the product whatever you build. Our guide on when not to use conjoint analysis covers more of those trade-offs.
Where does rejection show up in OpinionX's conjoint results?
The None of the Above button is available on every OpinionX plan, including the free plan, which allows 25 participants per survey, while Analyze costs $900 per year for unlimited participants. Once a Conjoint Rank survey includes the button, rejection data appears in four places on the results dashboard.
1. The Rejection Rate chart. One bar per option, grouped by category, showing the rejection rate defined above. Check here first for the dealbreaker pattern.
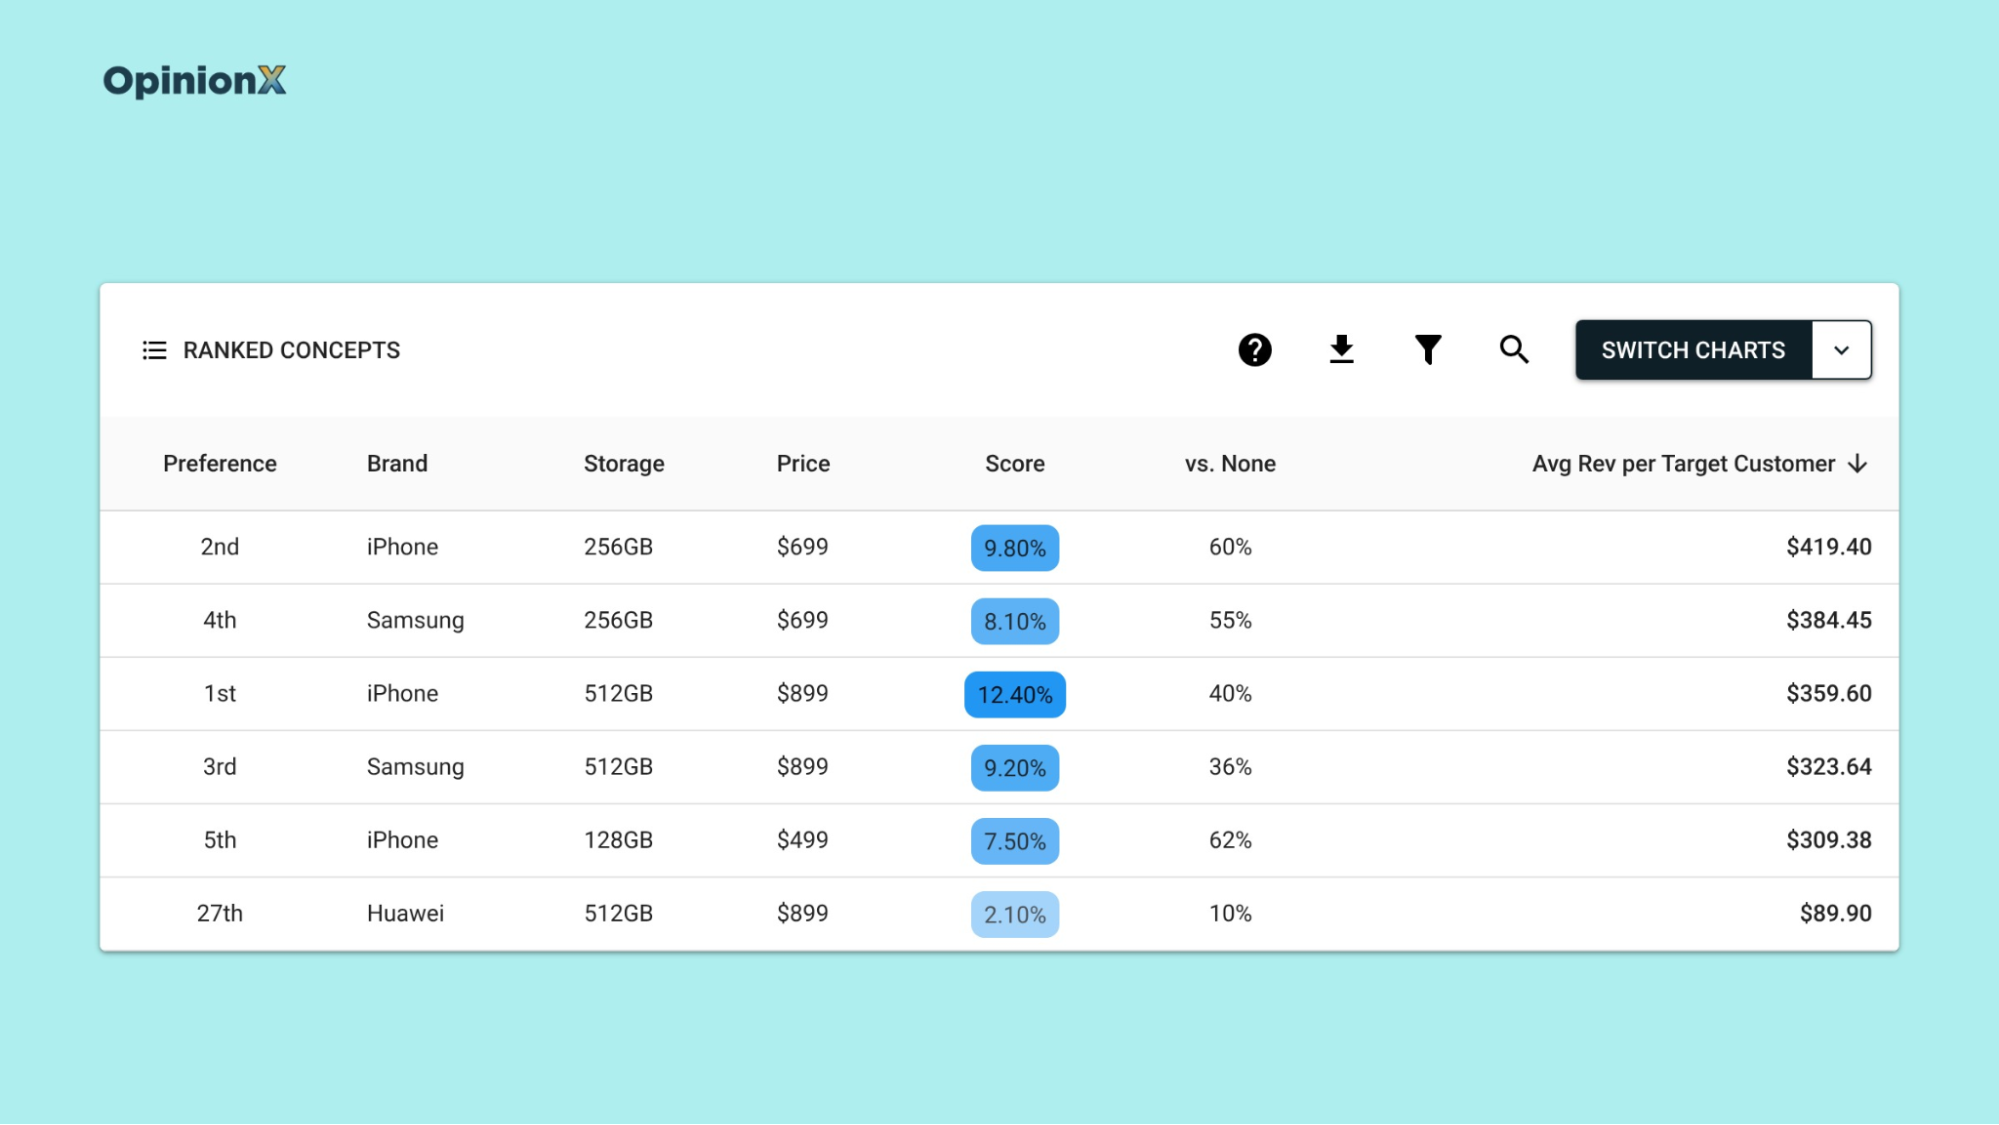
2. Ranked Concepts. Ranked Concepts lists every possible combination of options, ranked by preference score. With a none option, it adds a "vs None" column: the share of participants who'd likely pick that combination over the None button. When price is one of your categories, it also adds Average Revenue per Target Customer, which multiplies each combination's price by its vs None share.
Sorting by that revenue column can change which product looks best. Take two illustrative smartphone combinations:
Combination A: the favourite on preference score, at $899, with a vs None share of 40%. Average revenue per target customer is $899 × 0.40 = $359.60.
Combination B: further down the preference ranking, at $699, with a vs None share of 60%. Average revenue per target customer is $699 × 0.60 = $419.40.
Combination B earns $59.80 more per target customer (about 17% more) because fewer people reject it outright, even though the preference ranking alone would have pointed you at Combination A.
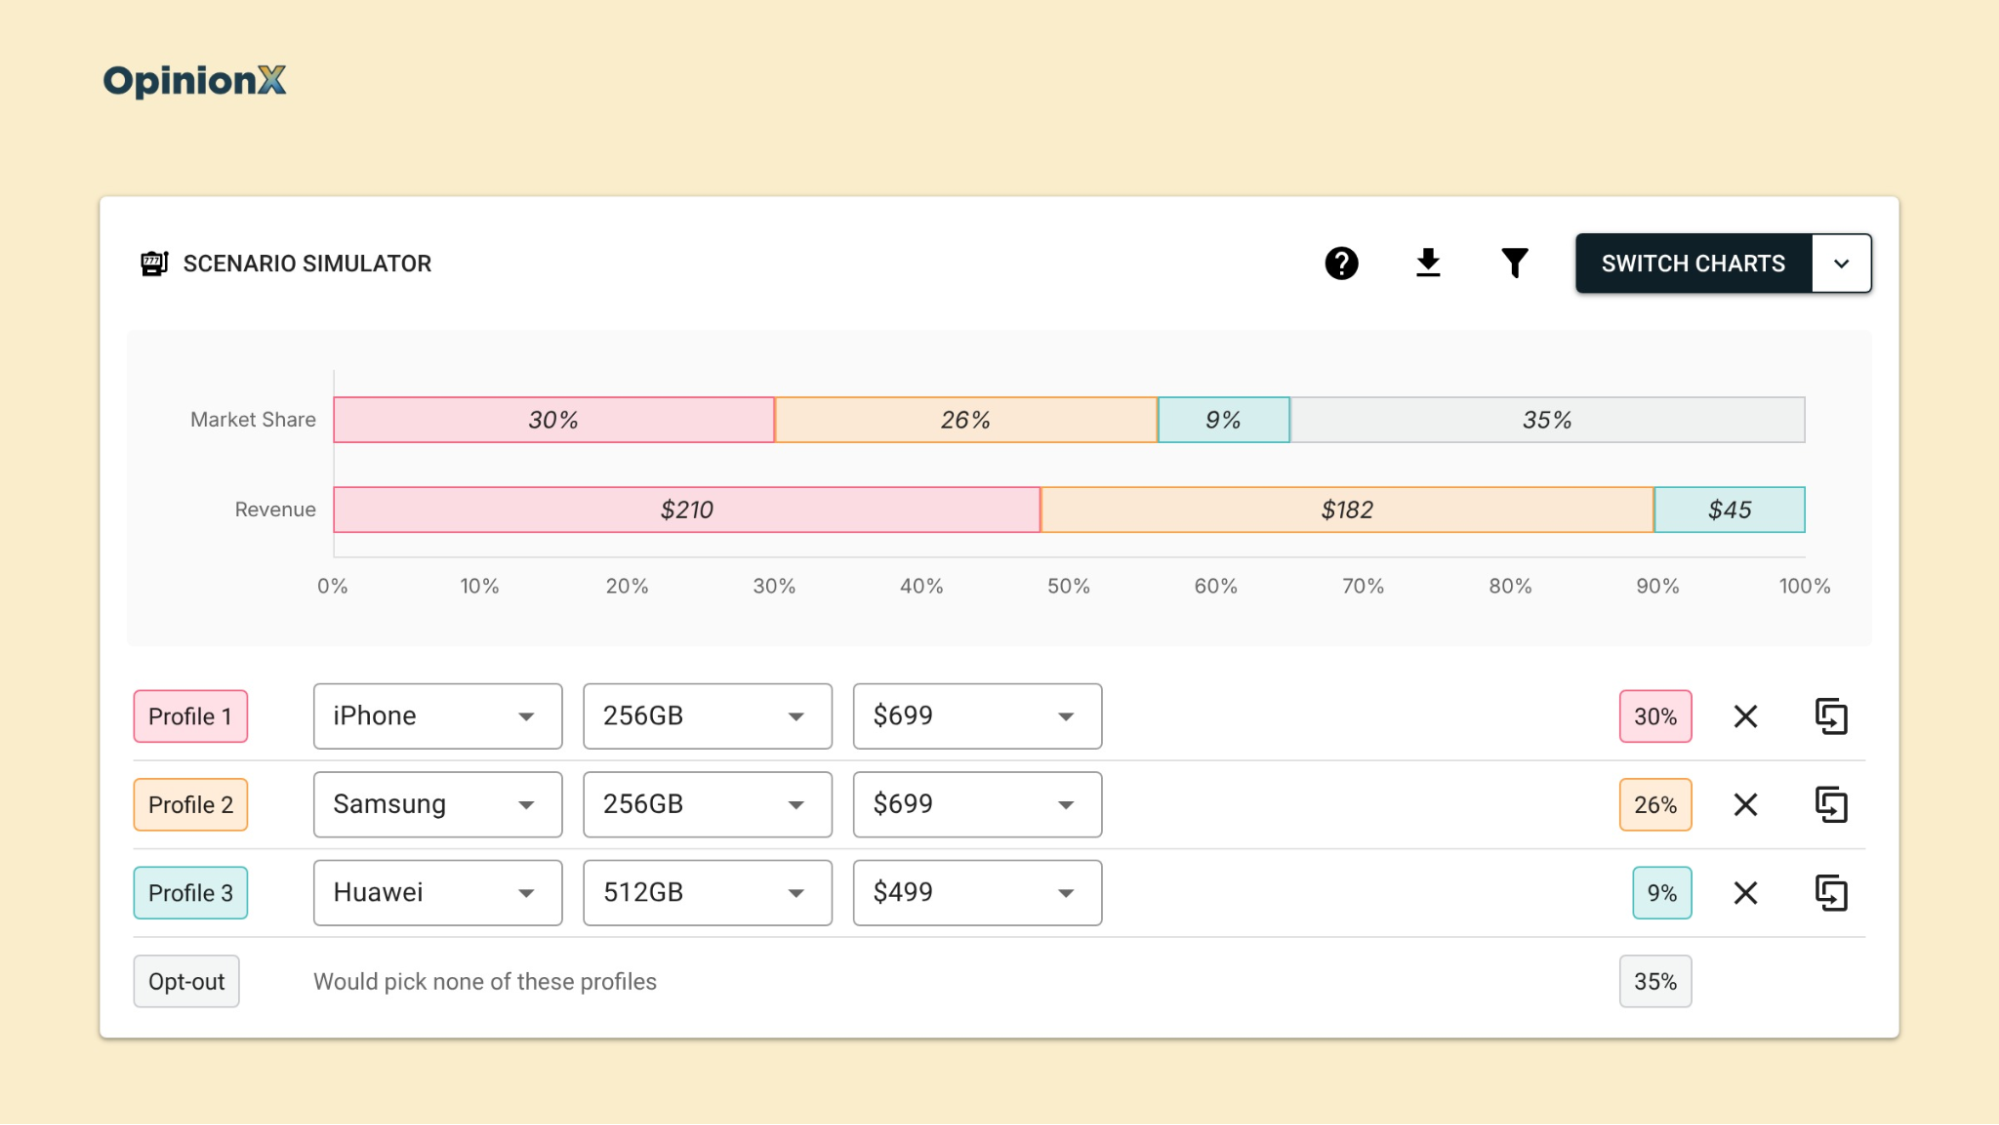
3. The Churn Simulator. The Scenario Simulator predicts market share and revenue for products you set up, using the scores from the HB-MNL model. With a none option in the survey, it adds a churn factor: an opt-out group for participants who'd likely pick none of the profiles in your scenario. That stops the simulator from assuming everyone buys something, which is the overstatement from the first section of this guide. Our guide on marginal willingness to pay shows how to turn the same scores into a dollar value for each option.
4. The Participants tab, Segments tab and exports. Rejection stats appear for each participant, for each customer segment you've defined, and in the spreadsheet export, so you can rebuild any of these views yourself.
Want to see rejection rates, revenue-ranked concepts and the churn simulator on one conjoint result? A demo walks through all three on a live results dashboard.
Why read rejection rate by customer segment?
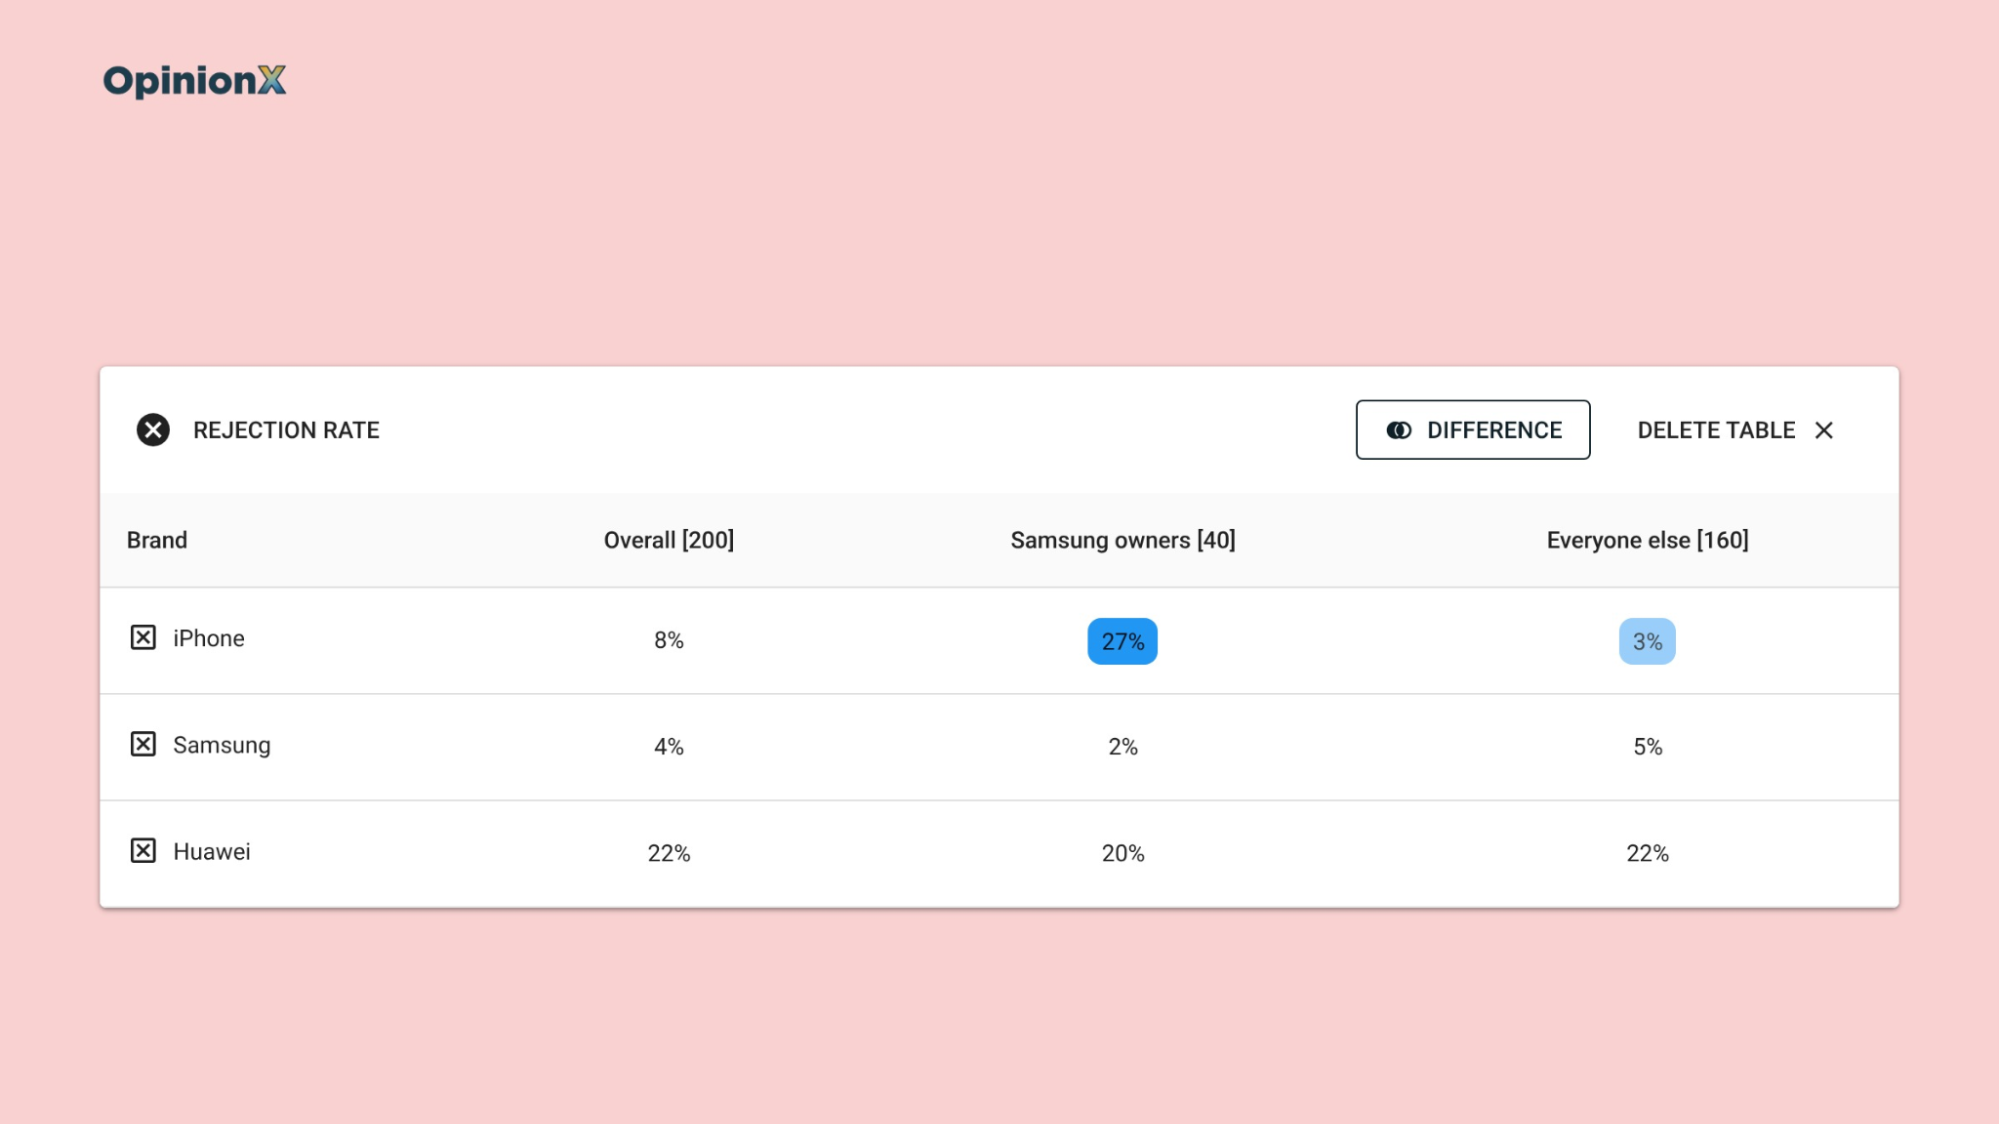
Screening rules are personal, so read rejection rate by customer segment before you trust the overall figure. A customer segment is a group of participants you can view on their own, such as company size, current plan or the phone brand people own today. One customer segment can reject an option outright while the overall rejection rate looks modest, because the other customer segments dilute it.
Back to the smartphone example. If current Samsung owners make up a fifth of your participants and a quarter of them reject every iPhone profile, that's only one participant in 20, so iPhone's overall rejection rate rises by about five points at most. Across everyone, iPhone looks fine, but for Samsung owners alone it's a dealbreaker for a quarter of the customer segment you're trying to win.
The Segments tab shows rejection stats for each customer segment. To build customer segments, add multiple-choice questions to the survey (current brand, budget, company size), which tag each participant so you can filter the results, or import data you already hold about each person. You can save the customer segments you check often with saved segments. Our guide to needs-based segmentation shows how to group people by what they need instead of by demographics, which is where screening rules tend to differ most.
Rejection by customer segment is also where AI-generated survey answers fall apart. In a Harvard Business School working paper revised in April 2026, James Brand, Ayelet Israeli and Donald Ngwe asked GPT-3.5 Turbo to answer a laptop conjoint study as different customer segments, with a none option on every question. Answering as lower-income buyers, GPT picked none 95% of the time, against 49% for actual people in that income group. Answering as higher-income buyers, it picked none 34% of the time, against 47% for actual people.
GPT overstated rejection for one customer segment and understated it for the other, so a simulator built on its answers would be wrong in both directions. Our guide to AI conjoint analysis covers what else synthetic participants get wrong.
How far can you trust a rejection rate?
Treat a rejection rate from a standard survey as a minimum, not a forecast, since the share of people who'd walk away in the market is probably higher. Klaus Miller, Reto Hofstetter, Harley Krohmer and John Zhang compared methods for measuring willingness to pay in the Journal of Marketing Research in 2011. In conjoint studies where participants had to buy the product they chose with their own money, people picked None far more often and were more sensitive to price than in a standard conjoint where nothing was at stake.
Fret not, though. The same paper found that even with that bias, a standard conjoint can still point to the right pricing decision, because the ranking of options holds up better than the overall amount of rejection does. So use rejection rate to find which options drive people away and which customer segments refuse them, and be careful about quoting the overall none share as a prediction of how many people will buy.
If price is the main question, check the price itself with a method built for it. Our guide comparing Van Westendorp and conjoint analysis explains when a direct pricing survey answers the question faster than a conjoint.
Frequently asked questions
What is rejection rate in conjoint analysis? Rejection rate in conjoint analysis is the share of voting sets where a given option appeared on at least one profile and the participant chose None instead of a profile. An option with a 3% rejection rate saw None picked three times in 100 voting sets where it appeared.
Should you include a none option in a conjoint survey? Include a none option in a conjoint survey when you need to know whether people would buy at all, such as in pricing, packaging and churn studies. Leave it out when every participant will keep the product regardless, because each None answer gives no information about which profile people preferred.
How do you interpret a high none share in conjoint? Interpret a high none share in conjoint by checking how rejection spreads within each category. Rejection piled onto one or two options means a dealbreaker. Rejection spread evenly means the profiles were too similar, or, if it's high everywhere, that the sample includes people who'd never buy.
What should the none option say in a conjoint survey? The none option in a conjoint survey should name the alternative your buyer actually has. "I would prefer to keep my current solution" measures switching, and "I would rather cancel my subscription" measures churn. Report the label next to every rejection figure, because it decides what the survey measured.
Does a none option bias conjoint results? A none option mainly costs precision in conjoint results, because a None answer says nothing about how the profiles on screen compare, so the scores rest on fewer choices. A study where a quarter of choices end in None needs roughly a third more participants to keep the same precision.
If you're new to conjoint, start with our types of conjoint analysis guide, which explains how choice-based conjoint differs from the older formats. Our guide to the discrete choice experiment covers how each question's group of profiles gets built and why that design decides what your results can tell you. For pricing studies, our guide to conjoint market simulators shows how to turn conjoint scores into market share and revenue predictions.
Add a None of the Above button to your next conjoint survey and see which options are dealbreakers for which customers. It's on every plan, including free.
