
Conjoint analysis is a survey method where people pick between versions of a product, such as phones with different storage and prices, and their choices show how much each feature is worth to them. When you split those results by customer group, for example people on your Pro plan and people on your free plan, each group is a segment. The most common mistake is comparing each segment's raw scores, which are the values OpinionX's model gives each option, such as 256GB of storage or a $499 price. A segment that picks more consistently, for example because its members agree with each other more, gets bigger raw scores on everything, so it looks as if it cares more even when its preferences are the same.
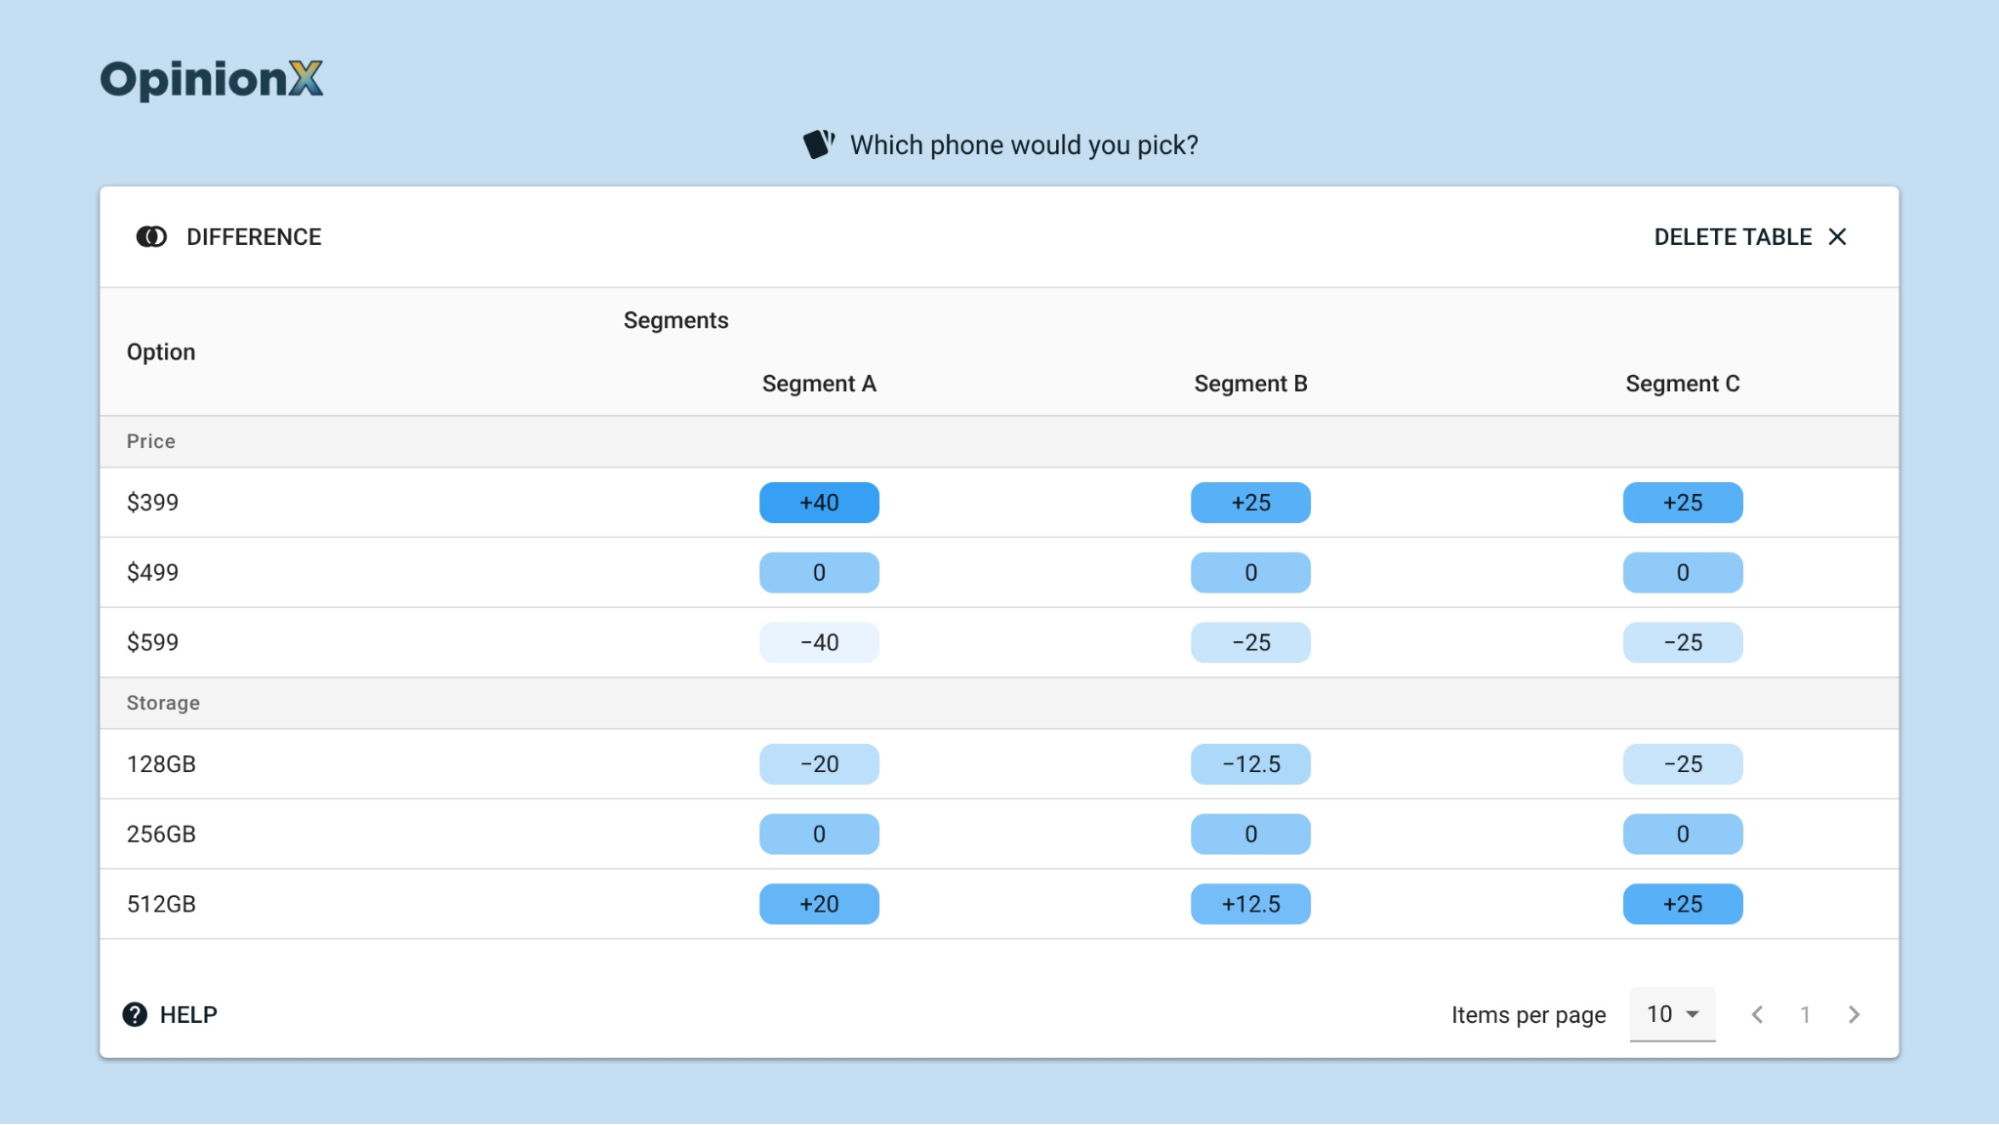
So compare segments on importance and marginal willingness to pay, which divide one score by another and cancel the bigger scores, or on simulator share, which only depends on which product gets each person's highest total.
What's conjoint analysis segmentation?
“💡 Conjoint analysis segmentation is splitting the results of a conjoint survey by group of participants, to see whether different customer groups value the same features and prices differently.”
In a conjoint survey, each participant sees two or more versions of a product at once and picks the one they prefer, then does the same with new versions several times. Our guide to conjoint analysis explains the method from the start, with a survey you can vote in yourself.
Each feature that changes between versions, such as storage, is a category, and each value inside a category, such as 256GB, is an option. Research papers use the word attributes for categories and levels for options.
A score shows how much an option made a participant more likely to pick a version, and research papers call these scores part-worth utilities. OpinionX calculates scores with a Hierarchical Bayes model, a statistical model that estimates a separate set of scores for every participant, and has done so since the Hierarchical Bayes update in December 2025. Our guide to how to calculate conjoint analysis shows each calculation step by step.
A segment is a group of participants you look at on their own, such as people on one pricing plan, or people who picked in a similar way.
Segmentation is worth doing because one average across everyone can describe nobody. If half your participants care mostly about price and half care mostly about storage, the average says they care a bit about both, and a product you build for that average fits neither group. Splitting the results tells you whether you need one product or two, and what each one should cost.
Why can't you compare raw conjoint scores between segments?
Raw conjoint scores from two segments aren't on the same scale, so a bigger score in one segment doesn't mean that segment cares more. The clearest proof comes from transport research on how people commute to work in two cities.
What a commuter example from transport research shows
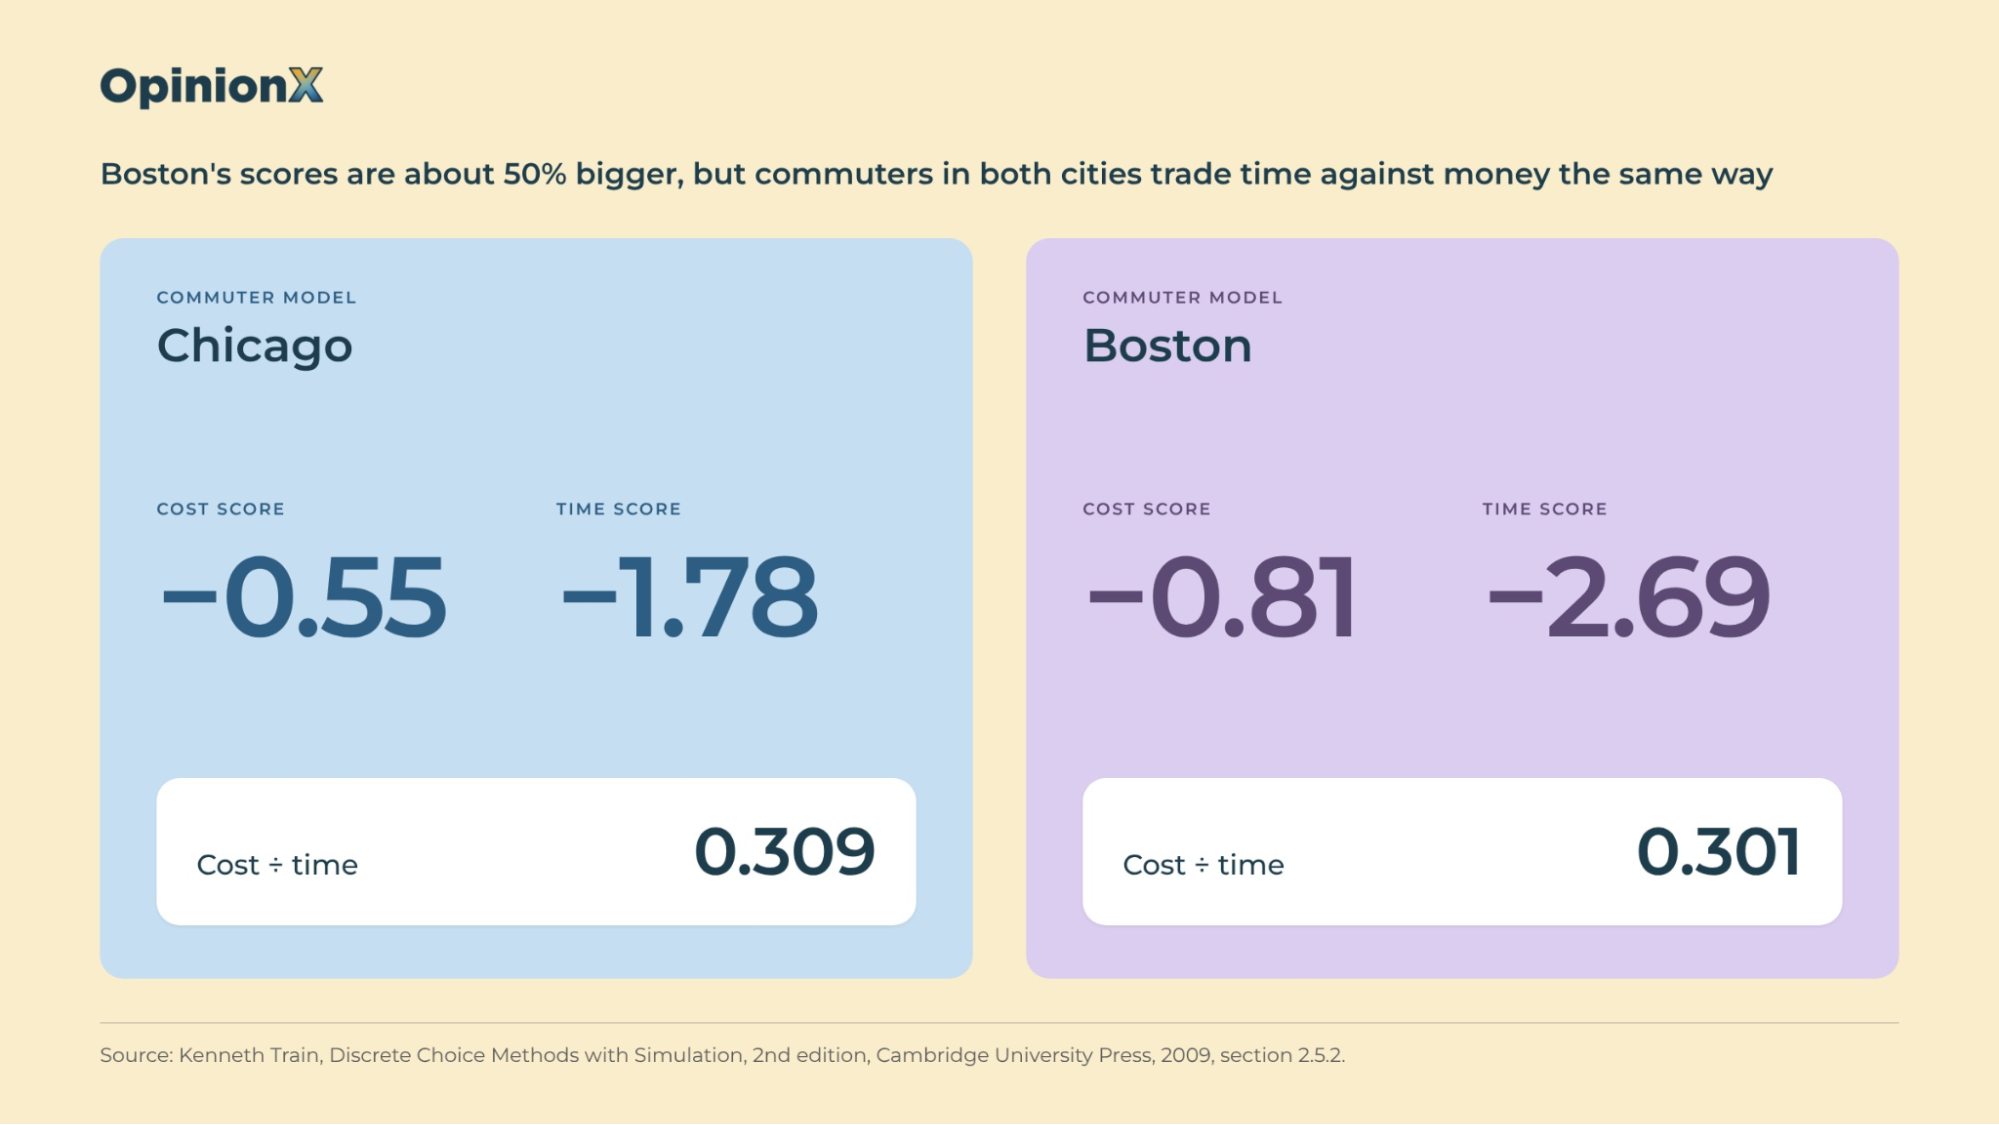
In Discrete Choice Methods with Simulation (the 2009 second edition from Cambridge University Press), Kenneth Train of UC Berkeley describes models that predict how people pick a way to commute in two cities. Section 2.5.2 of Train's chapter 2 gives the scores:
Chicago: the cost score is −0.55 and the time score is −1.78.
Boston: the cost score is −0.81 and the time score is −2.69.
Both scores are negative because more cost and more time make a commute less attractive. Boston's scores are about 50% bigger on both features, so a quick read says Boston commuters care more about money and more about time.
Now divide the cost score by the time score in each city. Chicago gives 0.55 ÷ 1.78 = 0.309, and Boston gives 0.81 ÷ 2.69 = 0.301, so commuters in both cities trade time against money almost the same way.
Train explains that Boston's bigger scores have a different cause: the things the model didn't measure, such as weather or mood, had less effect on Boston commuters' choices, so time and cost predicted Boston's choices better, and a model turns more predictable choices into bigger scores on everything.
Researchers call this hidden size difference the scale, and Train's section heading says what it means for comparisons in six words: "the overall scale of utility is irrelevant". Thomas Holmes and his co-authors Wiktor Adamowicz and Fredrik Carlsson warn in their 2017 chapter on choice experiments that you can't compare scores from two sets of data directly for this reason. Their chapter also describes a method that Joffre Swait and Jordan Louviere published in 1993 for measuring how much the scale differs between two data sets.
What that means for your conjoint results
Conjoint surveys have the same problem as Train's commuter models. Here's a phone example with two segments, where the scores in each category add up to zero, the way OpinionX's scores do:
Segment A: it scores $399 at +40 (with $499 at 0 and $599 at −40) and 512GB at +20 (with 256GB at 0 and 128GB at −20).
Segment B: it scores $399 at +25 (with $499 at 0 and $599 at −25) and 512GB at +12.5 (with 256GB at 0 and 128GB at −12.5).
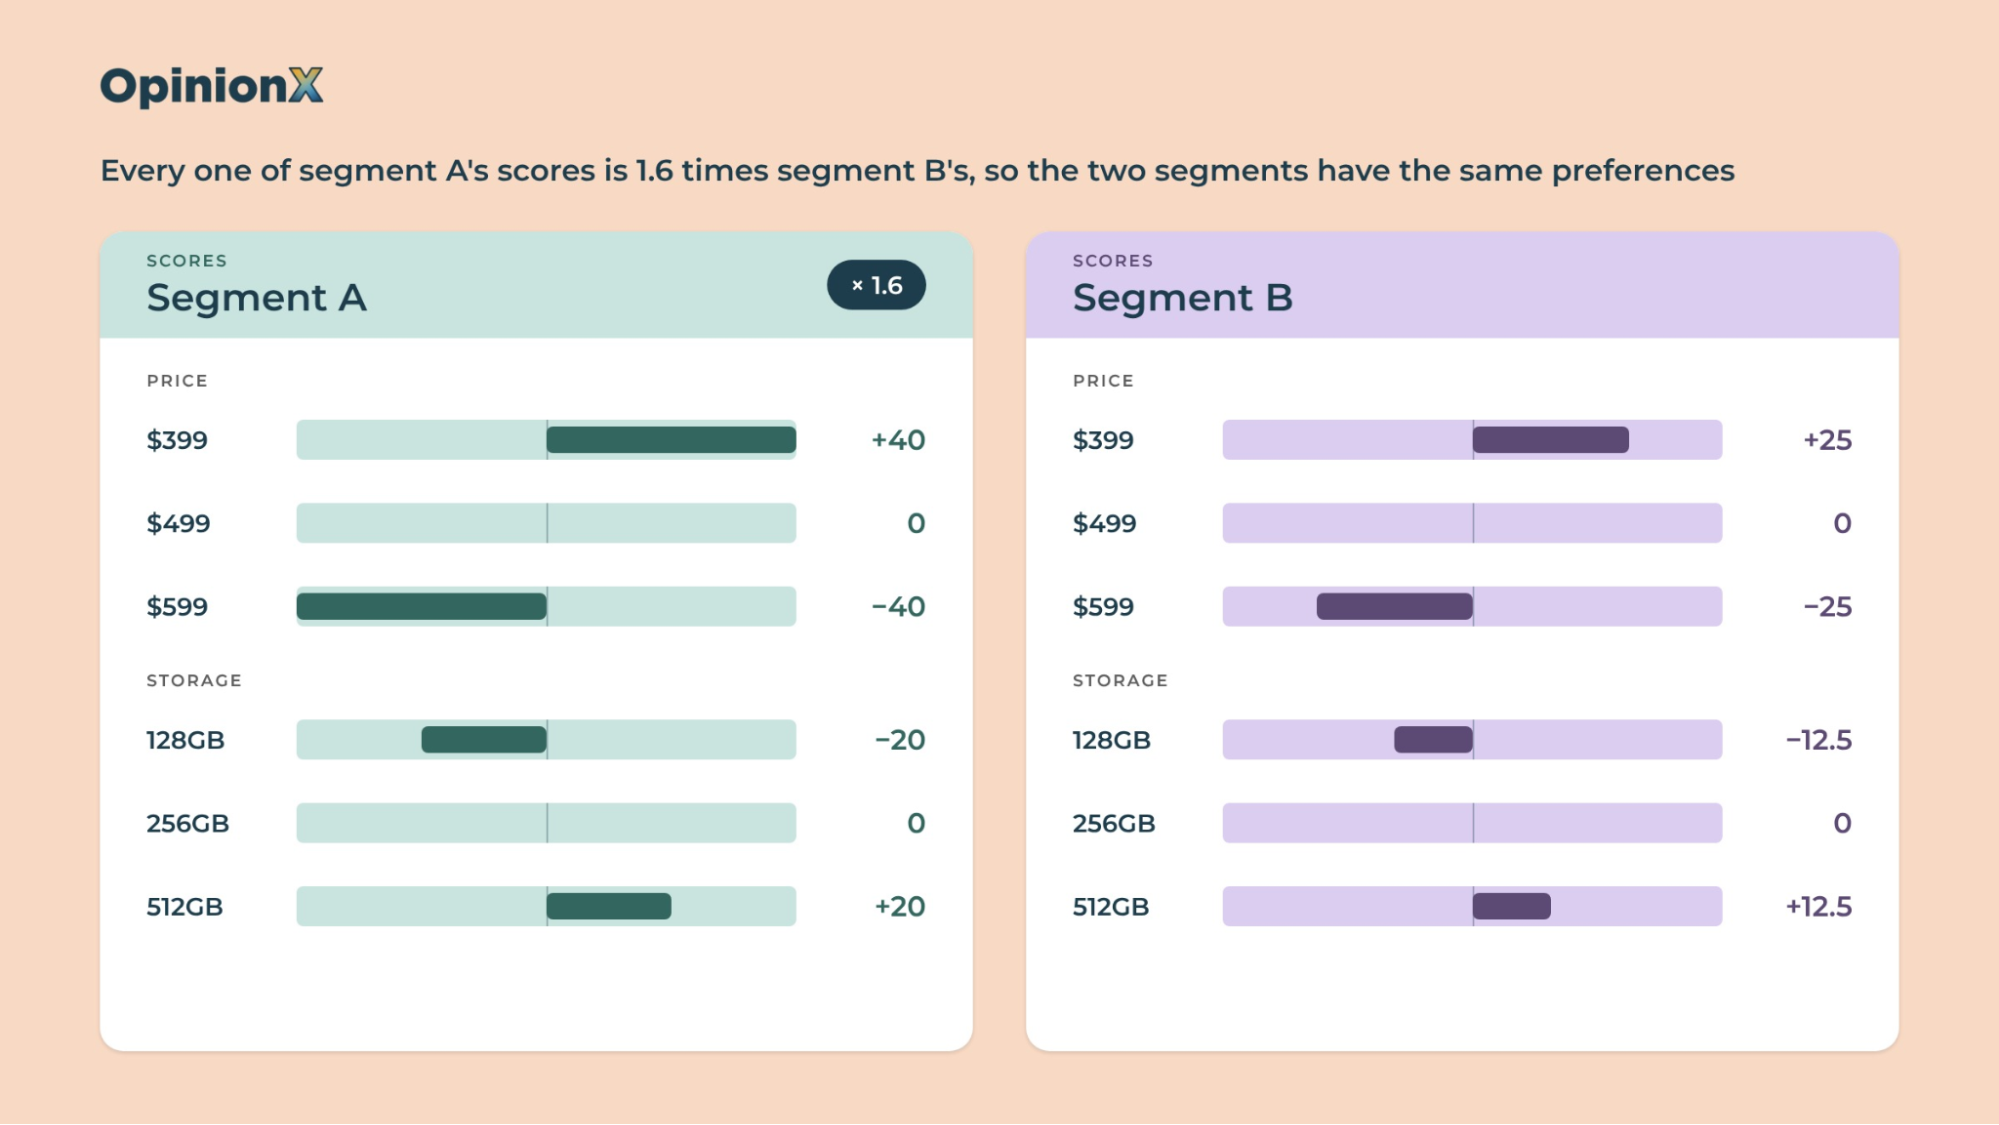
Segment A scores the $599 price at −40 and segment B scores it at −25, but that doesn't tell you that segment A cares more about price, because every one of segment A's scores is 1.6 times segment B's, which means the two segments have the same preferences. An actual difference in preferences looks like this: if a third segment scored price from +25 to −25 and storage from −25 to +25, that segment would care about storage as much as price, and multiplying its scores by any amount wouldn't make them match segments A and B.
Which conjoint measures can you compare between segments?
Importance
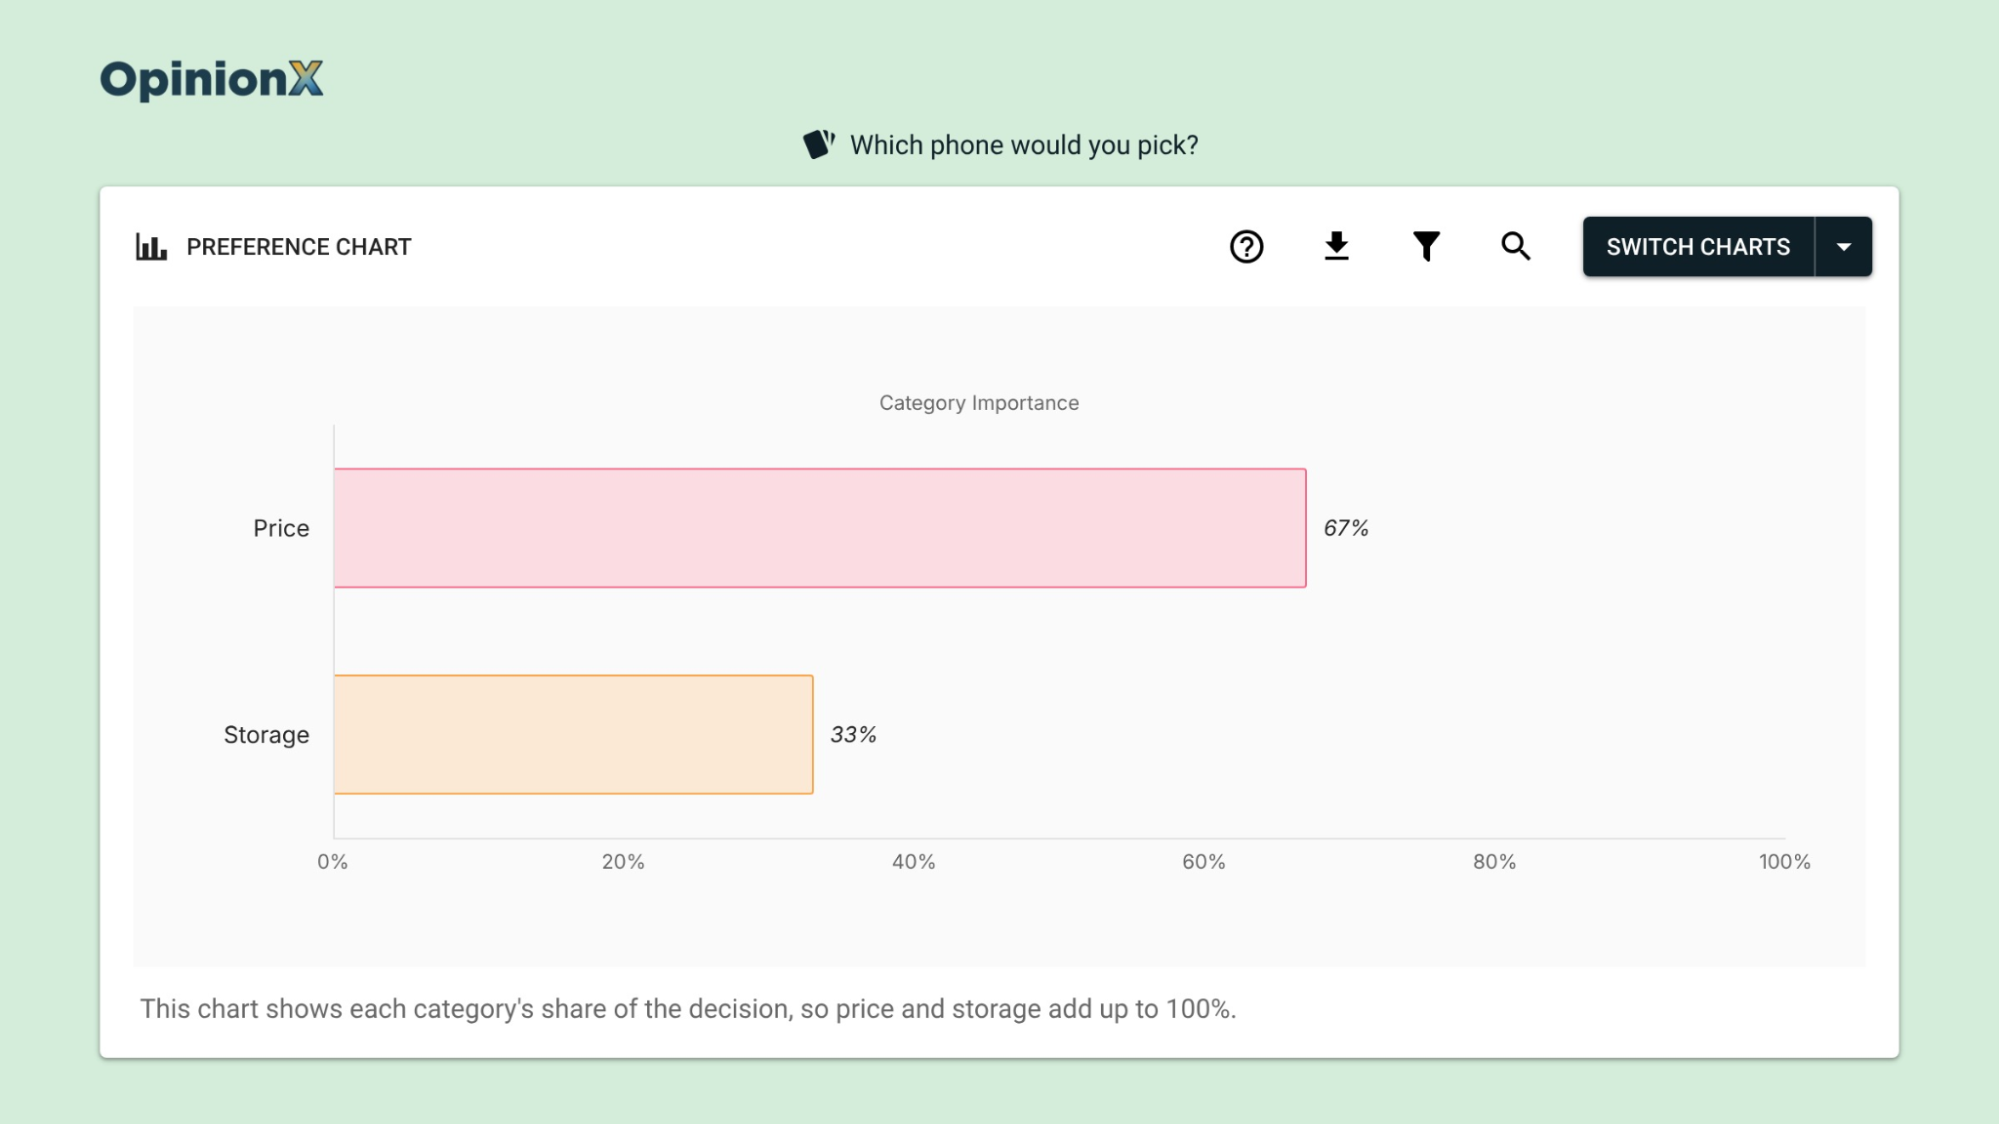
Importance shows how much of a participant's decision depends on each category, as a share of 100%. Take the range of each category's scores (the highest minus the lowest), then divide each range by the total of all the ranges.
In segment A, the price range is 40 − (−40) = 80 and the storage range is 40, so price is 80 ÷ 120 = 67% of the decision and storage is 33%. Segment B's ranges are 50 and 25, which gives 50 ÷ 75 = 67% and 33%, so the bigger scores disappear in the division. On OpinionX, the Category Importance chart shows this share for every category.
Marginal willingness to pay
Marginal willingness to pay is how many extra dollars a participant would pay for one change to a product, such as going from 128GB to 512GB. Work out how many score points one dollar is worth from the price category, then divide the upgrade's score difference by that value.
In segment A, prices from $399 to $599 cover 80 score points over $200, so one dollar is worth 0.4 points. The storage upgrade is worth 40 points, and 40 ÷ 0.4 = $100. In segment B, one dollar is worth 50 ÷ 200 = 0.25 points and the upgrade is worth 25 points, so segment B would also pay 25 ÷ 0.25 = $100. Holmes and his co-authors make the same point in general terms: because marginal willingness to pay is one score divided by another, the scale cancels out. Our guide to marginal willingness to pay shows the full calculation, and OpinionX's marginal willingness to pay chart does it for you.
Simulator share
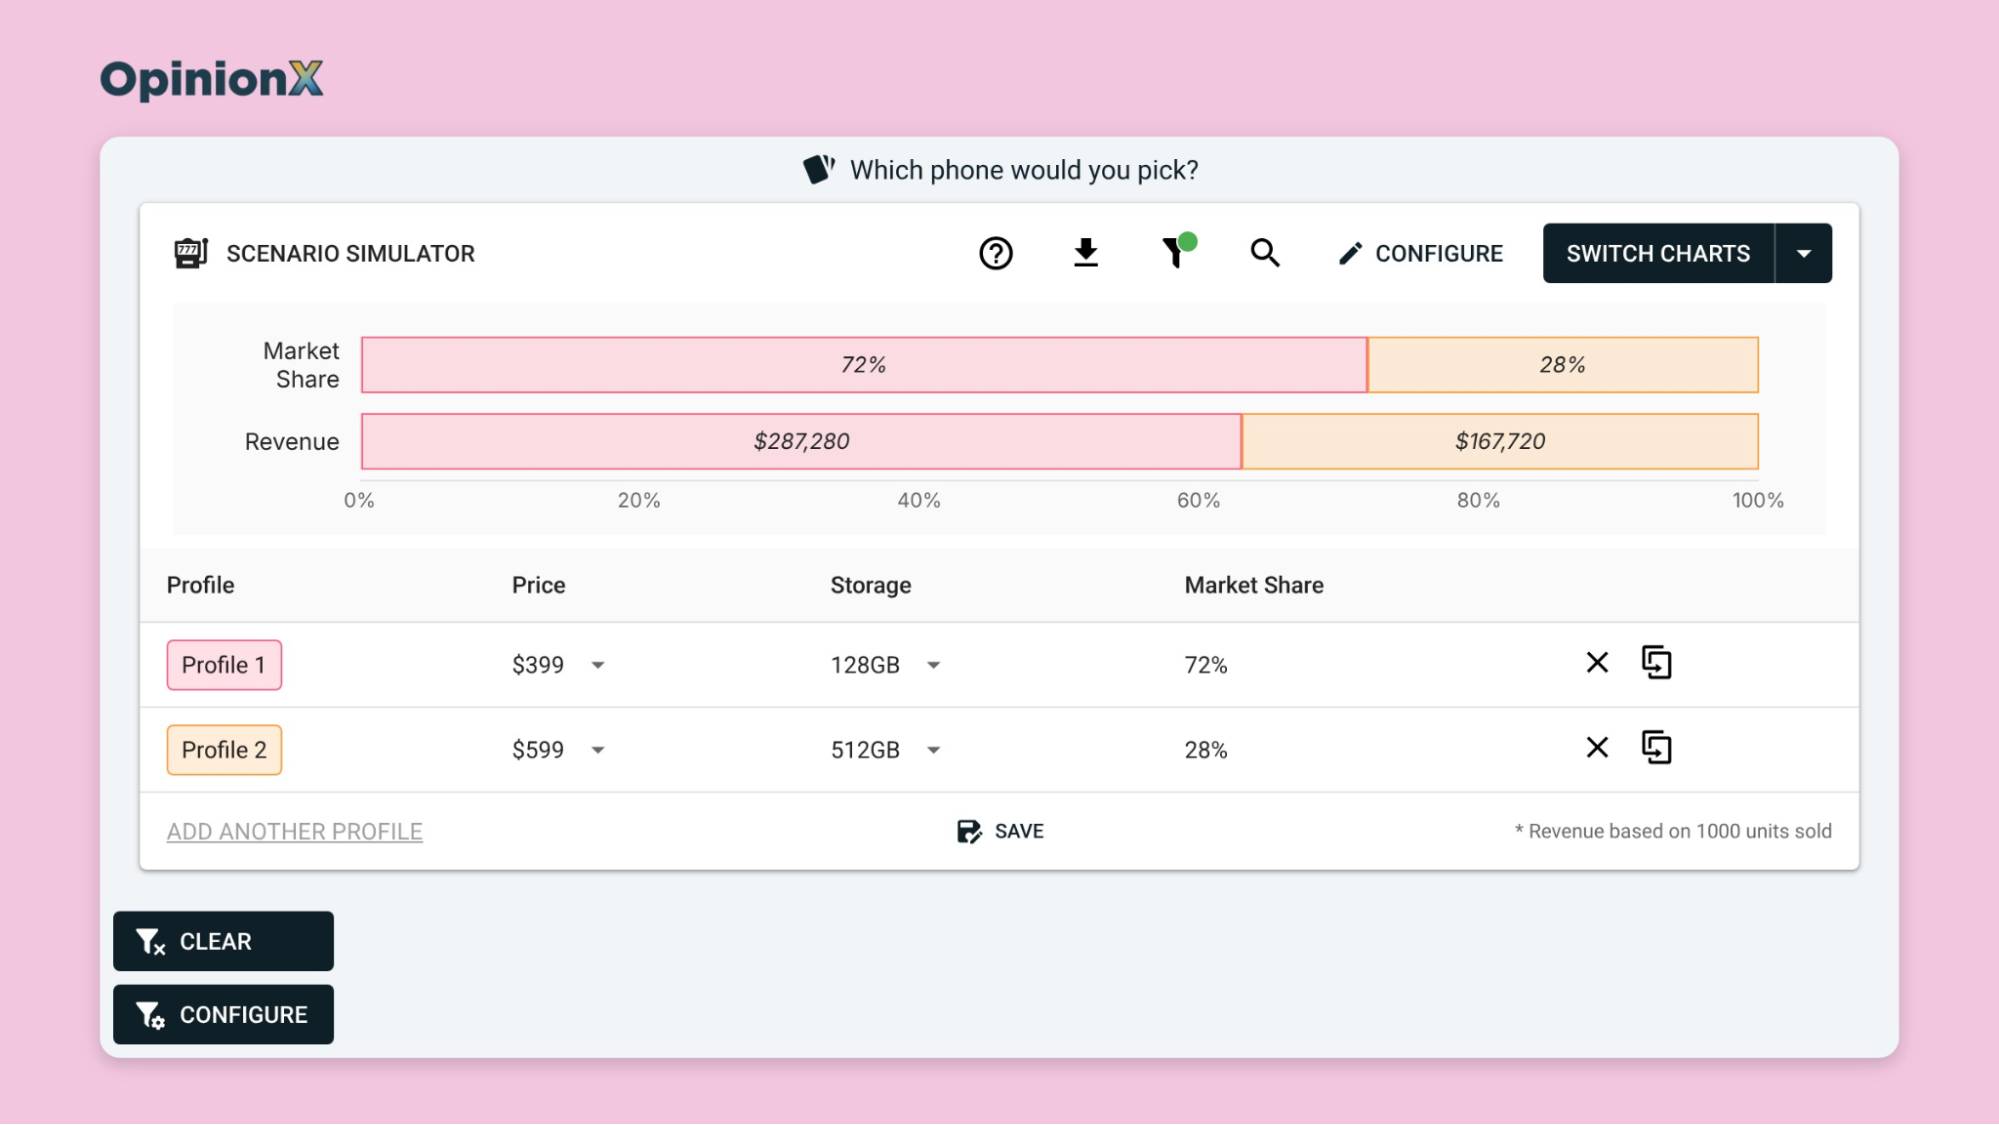
Simulator share is the percentage of participants who'd pick each product in a made-up market you build from your own options. OpinionX's Scenario Simulator adds up each participant's scores for every product you set up and gives that participant to the product with the highest total. Then it counts the share of participants each product won.
Simulator share is safe to compare because making all of one person's scores 1.6 times bigger doesn't change which product has their highest total. Take a $399 phone with 128GB against a $599 phone with 512GB. Segment B's totals are 25 − 12.5 = 12.5 for the cheaper phone and −12.5 for the bigger one, and segment A's are 20 and −20, so both segments pick the cheaper phone. Our guide to how a conjoint market simulator works covers versions that predict revenue and churn (customers who'd leave) too.
Where do conjoint segments come from?
Every conjoint analysis segmentation starts with deciding where the segments come from, and they can come from two places. You can tag participants before they vote with a question or data you already have, or you can find groups after the votes are in by looking at how people picked. Most studies benefit from using both kinds of segment together.
Tags you set before launch
A tag is a piece of information about a participant that puts them in a segment, such as their pricing plan or company size. You can add tags on OpinionX in any of these ways:
Ask a question in the survey. A multiple-choice question such as "Which plan are you on?" turns each answer into a segment. Our guide to screener questions shows how to write one that doesn't hint at the answer you want.
Pass data through the survey link. Hidden fields add data to the end of each participant's survey link, such as their pricing plan. That way, your CRM (the system where you keep customer records) can create a personal link for every customer, and the plan arrives with their answers.
Import a CSV file before you send the survey. Upload a spreadsheet of customers to the Enrichment Tab, which is the part of survey setup that stores what you already know about participants. Then send each person their own link, and OpinionX matches their answers to their row in the spreadsheet.
You have to set up all three before anyone votes, because OpinionX can't attach new data to a participant after the survey ends. Tags are also the quickest segments to act on, because your sales and marketing teams can find "Pro plan customers at companies of 50 to 200 people" in the CRM. The segmentation features page shows every tagging option in one place.
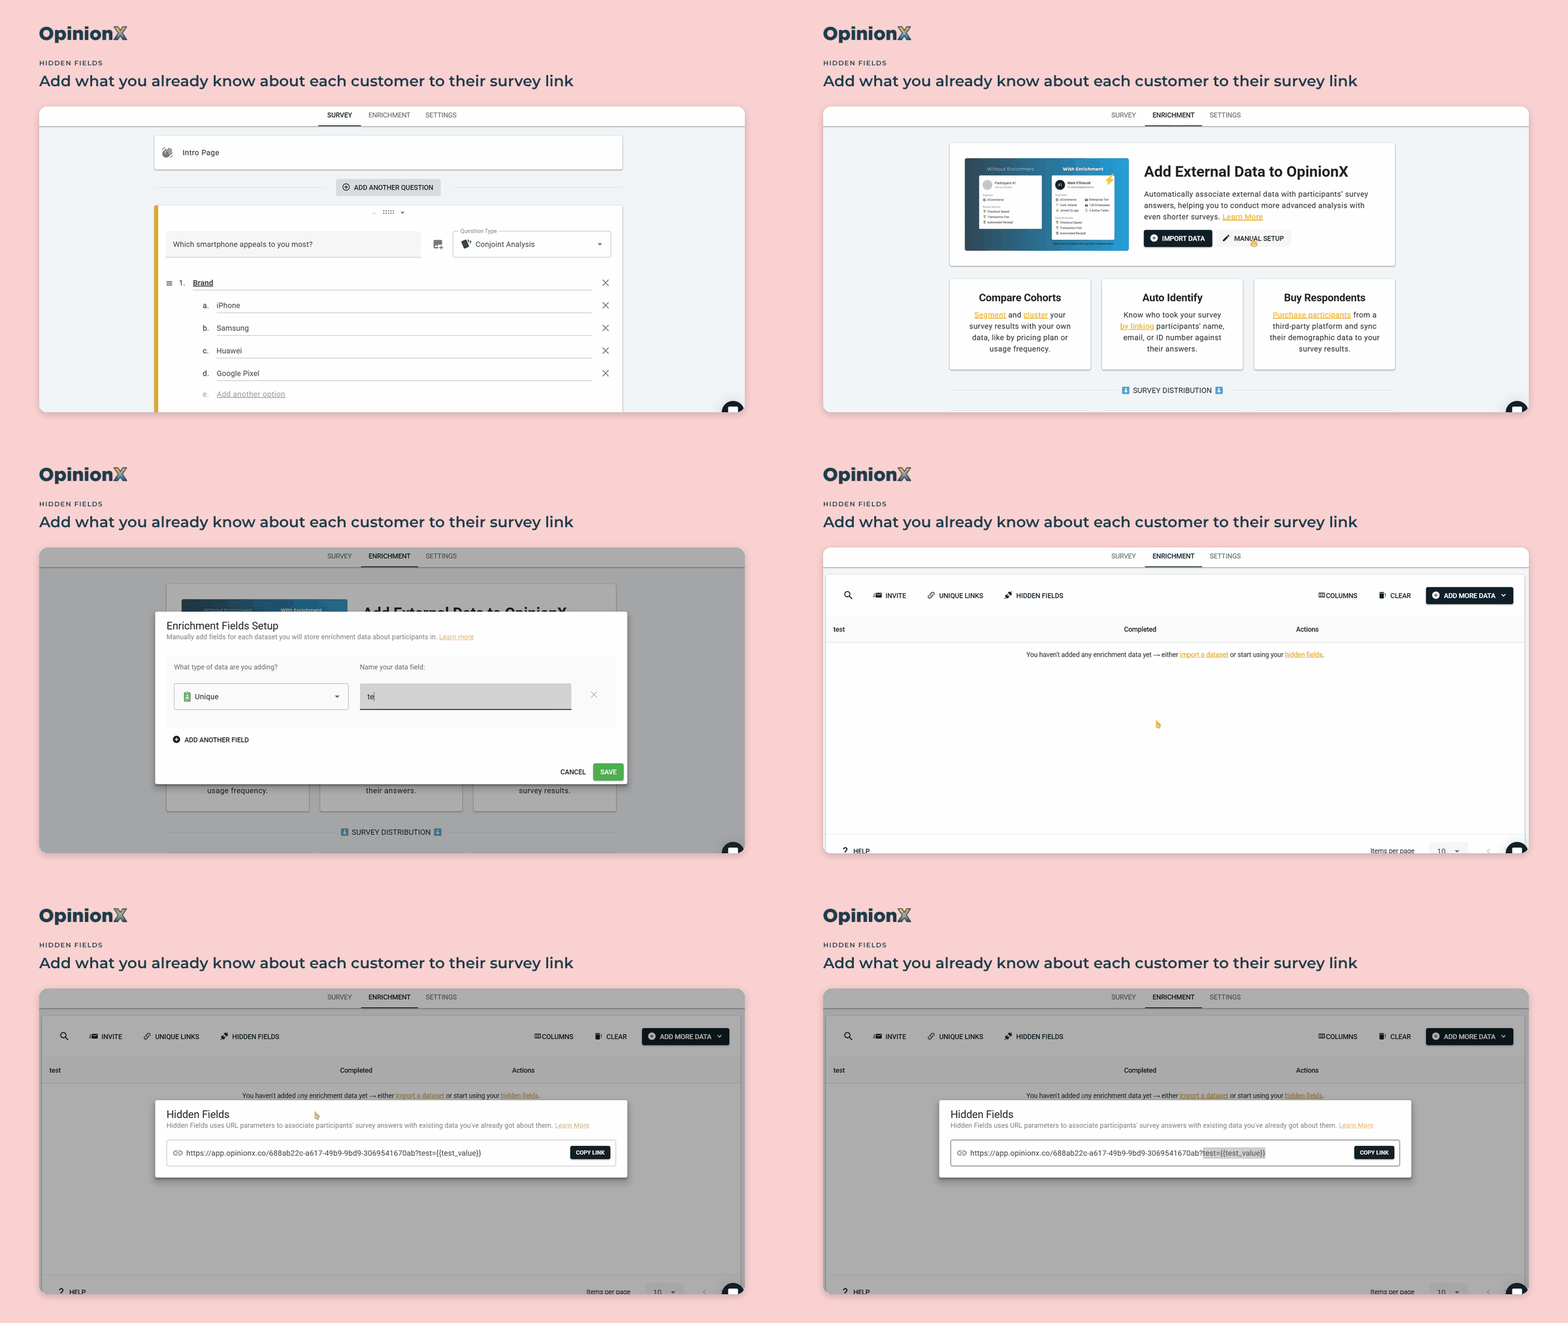
If you're deciding which groups to compare, that's a setup question worth settling before anyone votes. Book a free 30-minute setup call and a research expert will help you pick your segments and set up the tagging questions and hidden fields behind them.
Groups you find after the votes
The second way is to find groups in the data after the votes are in, by putting participants together when they picked in a similar way. These groups answer a different question: what kinds of buyers exist in this market, whatever their job title or plan. They're often the segments that change a decision, because two people with the same job title can want very different products.
Researchers find these groups in two main ways:
Clustering puts people into groups when their results look alike.
Latent class analysis is a model that finds the groups and calculates each group's scores at the same time.
Rick Andrews and his co-authors Asim Ansari and Imran Currim compared latent class and Hierarchical Bayes models in the Journal of Marketing Research in February 2002. They built 128 simulated study designs of 150 people each and used ratings-based conjoint, where people score versions instead of picking between them. Both model types predicted answers to extra test questions equally well, and the authors found both "quite robust to violations of underlying assumptions", which means both kept working when the data broke the rules each model assumes. The weak point was finding the groups, because the statistical test researchers usually use to decide how many groups exist picked the right count in 95 of the 144 simulated data sets the authors tested it on, about two thirds.
So you have to decide yourself how many groups to keep. Check that each group makes sense when you read what it values, and that it's big enough for your business to act on. Groups from clustering or latent class analysis have no name until you give them one, such as "price-first buyers". Our guide to needs-based segmentation explains why you should group people by what they need first and describe them second.
How do you segment conjoint results on OpinionX?
OpinionX has six features for conjoint analysis segmentation. Segmentation is available on every OpinionX plan.
1. Conjoint Crosstabs on the Segments Tab. A crosstab is a table that shows the same results once for each group. The Segments Tab puts every segment against every option of your conjoint question in one heatmap (a table where darker cells mean higher values), with up to 30 segments as columns. Use it to spot differences worth checking, then confirm each difference with the measures from the section on what you can compare between segments. Our crosstab analysis guide explains how to read this kind of table.
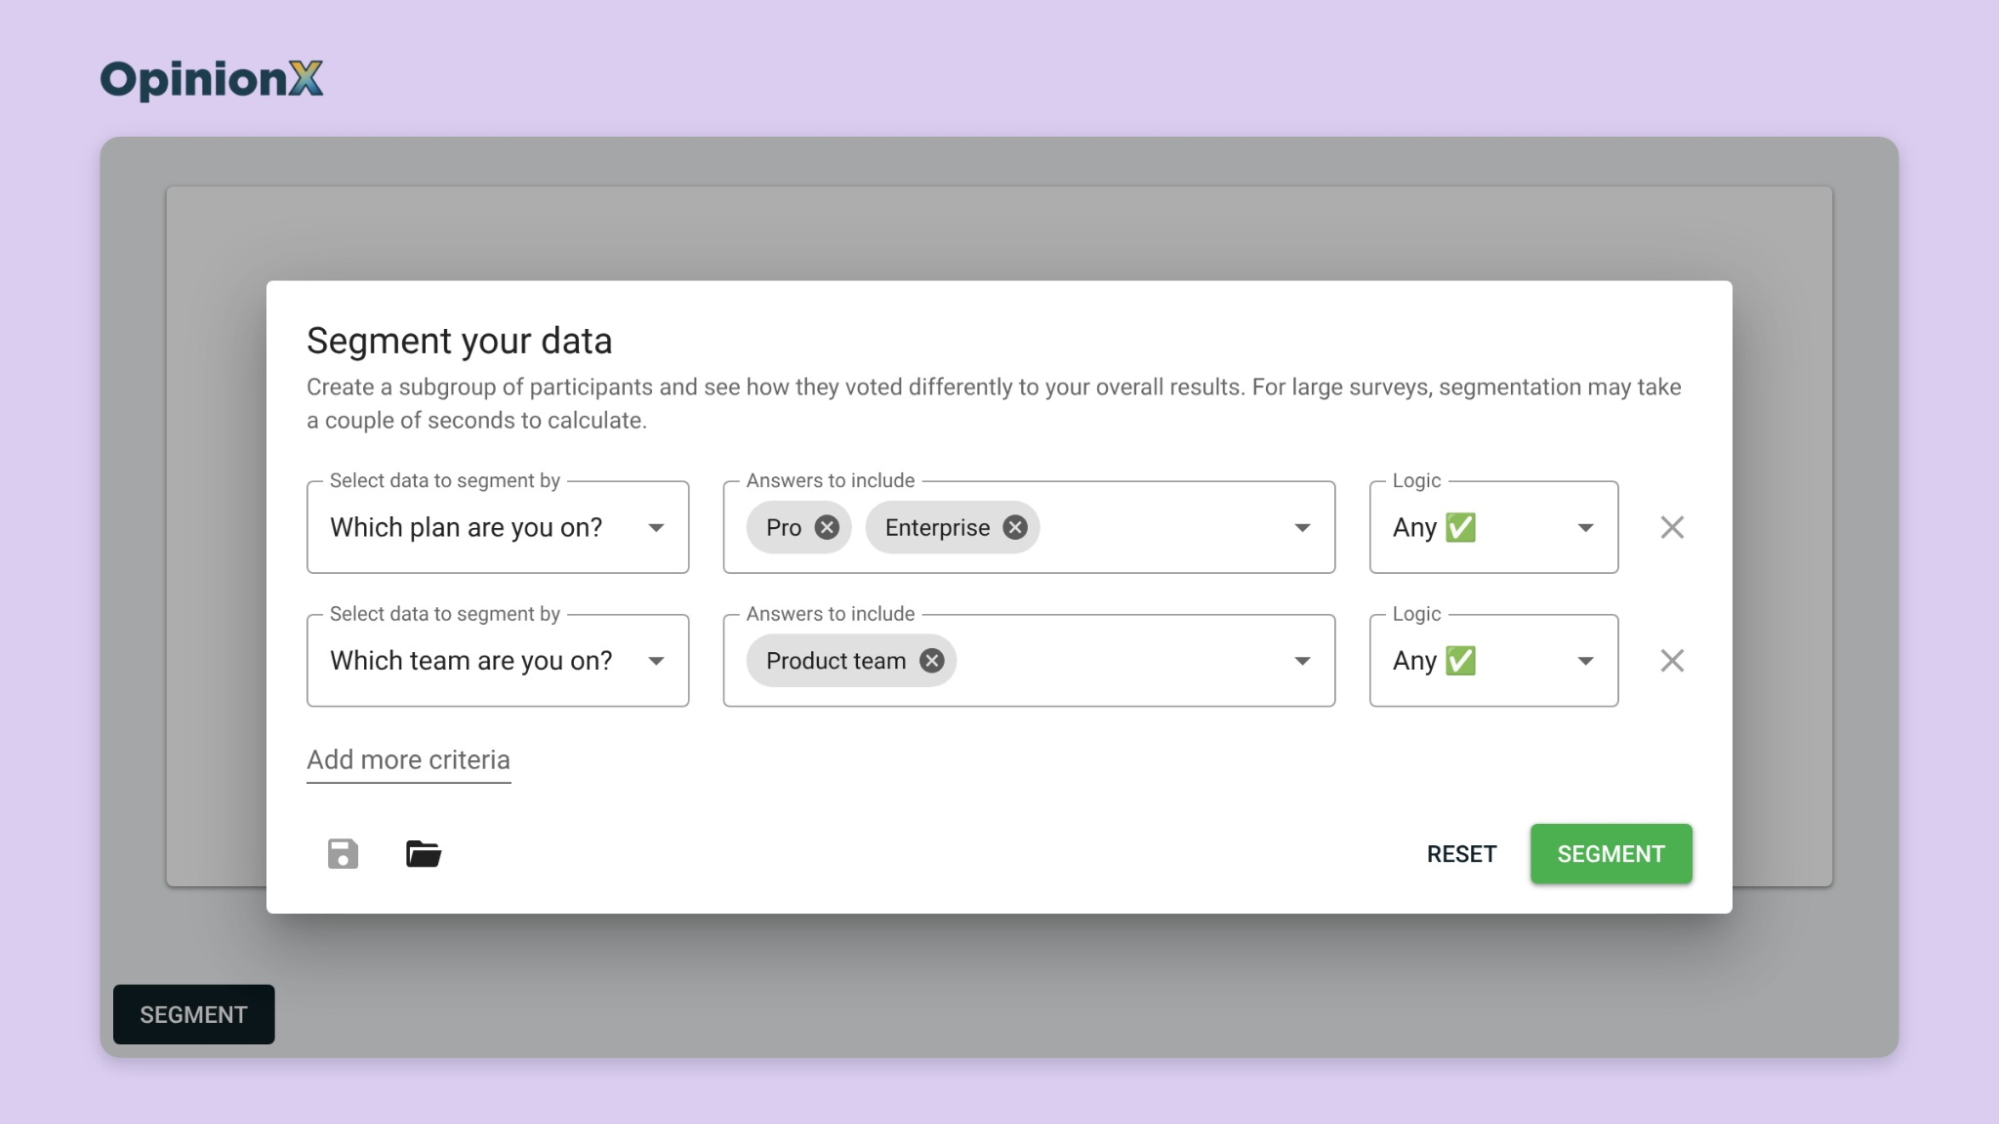
2. One-click filtering. Click any bar on a multiple-choice chart, and OpinionX filters the results page to the participants who gave that answer and recalculates every chart for that group. The Segment button combines answers with OR inside one question and AND between questions, such as (Pro OR Enterprise) AND (Product team).
3. The Compare Tab. The Compare Tab puts two segments in columns next to each other across every question and shows how many places each option moved in the ranking between them.
4. The Cluster Tab. The Cluster Tab groups participants with k-means clustering, a method that puts people together when their votes look alike. Each cluster gets a card that shows which options it weighted most differently from everyone else, and you can use clusters as segments in every other feature on this list.
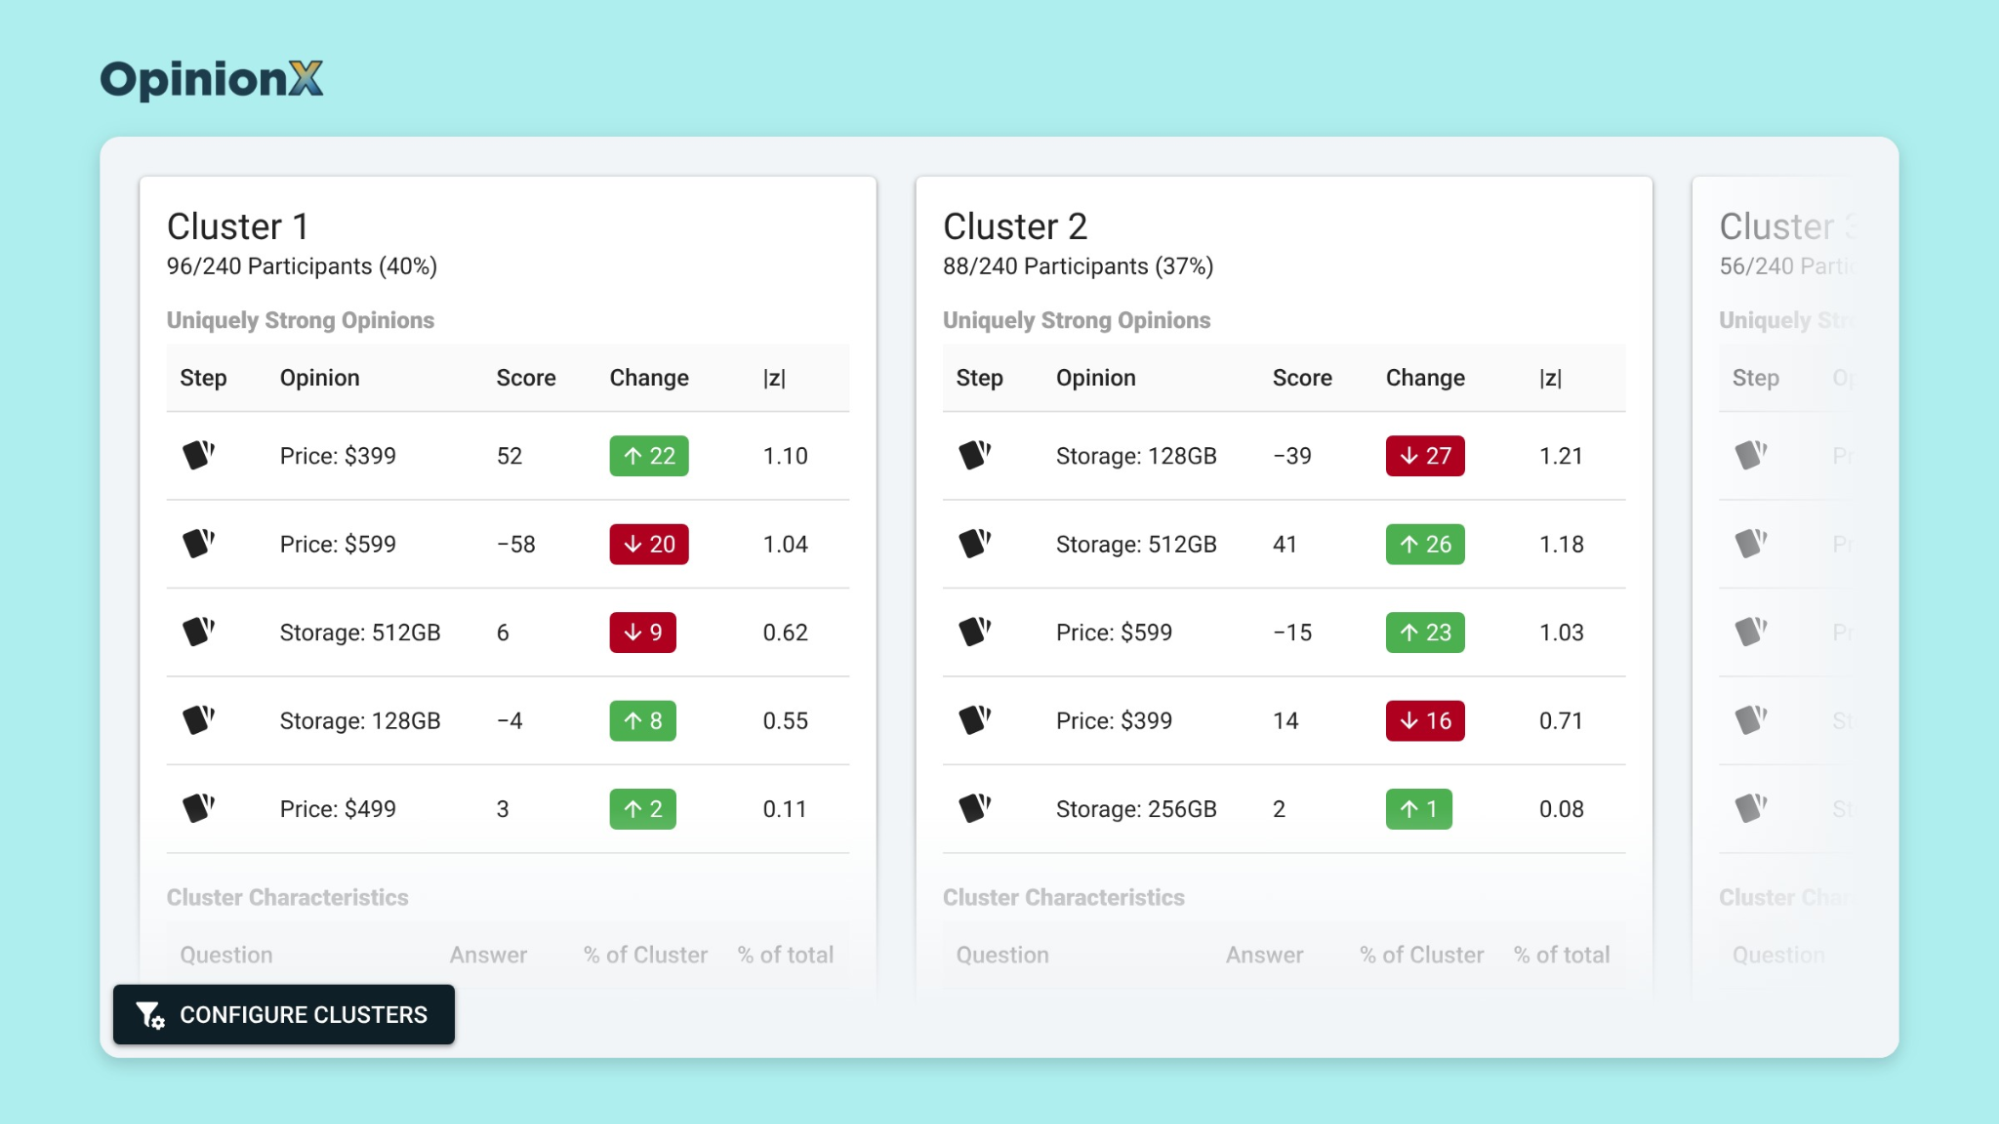
5. Saved segments. A saved filter gets a name and description and appears in the Segments Tab and Compare Tab, so a colleague can reuse the same group. The saved segments update shows how it works.
6. The Scenario Simulator and marginal willingness to pay, filtered by segment. With a filter on, both charts recalculate for that segment, so you can see which plan each group would pick and what each group would pay for an upgrade.
Most of our customers aren't quantitative research experts, which is why OpinionX calculates every one of these charts for you. You still decide which segments to look at and what the differences mean. The conjoint analysis page shows how the scoring and charts fit together.
A heatmap of segments is easier to judge on survey results than in a description. Book a demo and we'll use these features to compare segments on a conjoint survey with actual votes.
Why can small conjoint segments look closer to average than they are?
OpinionX scores conjoint surveys with a Hierarchical Bayes model, which uses the whole sample to help estimate each person's scores. The model pulls each participant's estimate towards the average of everyone in the survey, and it pulls harder on people who answered fewer sets of choices, such as people who left the survey partway through, because it has less evidence about them. Statisticians call this shrinkage, and it's why Hierarchical Bayes gives stable scores for every person.
Shrinkage has a cost for segmentation, because the model pulls a small segment with unusual preferences towards everyone else, so that segment looks more like the rest of your participants than it really is. Andrews and his co-authors measured this pull across their simulated studies: the spread of scores between the people with the strongest and weakest preferences was 3.24 score points in the true data and 2.91 in the Hierarchical Bayes estimates, so the model kept about 90% of the actual differences between people.
So Hierarchical Bayes makes differences between segments look smaller than they are, but it never makes up a difference that isn't there. When a small segment still stands out, such as 40 participants whose price importance is far above everyone else's, you can trust that difference, because the model was working against it. A small segment that looks the same as everyone else might still differ, so collect more participants from that group before you decide the difference doesn't exist. Our guide to individual-level conjoint analysis explains how far you can trust each person's scores.
How many participants does each conjoint segment need?
No single minimum fits every conjoint segment, so work from the research and from your own survey design. Emily Lancsar and Jordan Louviere wrote a 2008 guide to discrete choice experiments. Discrete choice experiments is the academic name for choice-based conjoint, the kind where people pick between versions instead of rating them. In their guide, they say you rarely need more than 20 people per questionnaire version (one fixed set of choice questions) to estimate the scores. They also say that comparing segments afterwards always needs a larger sample.
Many published studies have smaller samples than that warning calls for. Esther de Bekker-Grob and colleagues reviewed 69 healthcare conjoint studies from 2012 in a 2015 paper in The Patient. They found that 22 of the 69 studies (32%) had fewer than 100 participants, and 49 of them (71%) didn't report how their authors picked the sample size.
The practical approach is to treat each segment as its own survey when you work out your sample size. OpinionX's conjoint calculator uses the formula N = (O × E) ÷ (P × S). O is how many options your largest category has, and E is how many times participants should see each option: 160 for a minimum sample and 240 for a safe one. P is how many versions each set shows, and S is how many sets each participant answers.
If your largest category has 4 options and each participant answers 8 sets of 3 versions, a safe sample is (4 × 240) ÷ (3 × 8) = 40 participants. Apply that to your smallest segment, not your whole survey: if Enterprise customers are your smallest segment at 20% of participants, you need 40 ÷ 0.2 = 200 participants in total. Survey quotas cap how many people from each segment can take part, so larger segments can't fill the survey before your smallest segment reaches its 40. Our guide to survey quotas shows how to set them.
OpinionX's free plan allows 25 participants per survey, which is enough to test your setup and check your tags work but too few to split into segments. The paid plan OpinionX calls "Analyze" is $900 per year with unlimited participants, and the pricing page lists advanced analysis and data enrichment on that plan. If you're recruiting participants yourself, our guide on finding free survey participants lists places to look.
Which conjoint measure should you bring to a meeting?
When someone asks "but which customers want this?", the table below shows which conjoint measure answers their question, and 🟢 marks the measures you can compare between segments.
| Measure | Question it answers in a meeting |
|---|---|
| 🔴 Raw score (part-worth utility) | Which option does this one segment prefer within a category? |
| 🟢 Importance | Does this segment care more about price or about features? |
| 🟢 Marginal willingness to pay | How much more would this segment pay for the upgrade? |
| 🟢 Simulator share | If we launch two pricing plans, which segment picks which one? |
Frequently asked questions
Can you compare part-worth utilities between segments? No. Part-worth utilities, the raw conjoint scores, include a hidden scale that changes with how consistently each segment picked, so a more consistent segment gets bigger scores on everything. Compare segments on importance and marginal willingness to pay instead, which divide one score by another and cancel the scale, or on simulator share, which only depends on each person's highest total.
How many participants do you need per segment for conjoint? Treat each conjoint segment as its own survey: if the largest category has 4 options and each participant answers 8 sets of 3 versions, OpinionX's calculator suggests 40 participants per segment for a safe sample. Lancsar and Louviere (2008) warn that comparing groups always needs a larger sample than estimating one set of scores.
Should you segment conjoint results by demographics or by preferences? Use both. Tags such as plan or company size are quick to act on because sales and marketing can find those people. Groups that come from how people picked in a conjoint survey show which kinds of buyers exist, and they often change the product decision more than job titles do.
What's latent class conjoint analysis? Latent class conjoint analysis is a model that finds groups of participants with similar preferences and calculates each group's conjoint scores at the same time. It also gives each person a probability of belonging to each group. Andrews and his co-authors (2002) found it predicted as well as Hierarchical Bayes in simulated studies.
Can you segment conjoint results by CRM data you already have? Yes, if you attach the CRM data before participants vote. On OpinionX, you can add it to each person's survey link with hidden fields, or import a CSV file of customers and send each one a personal link. OpinionX can't attach new data to participants after the conjoint survey ends.
Our guide to discrete choice modelling explains the choice models that produce conjoint scores, including where scale comes from. Our guide to psychographic segmentation covers grouping customers by values and attitudes, which works well as a tagging question. For the same approach on pricing surveys, read our guides on how to segment Gabor Granger results and Van Westendorp segmentation. If some segments reject every version you show them, our guide to rejection rate in conjoint analysis shows how to find the options they reject.
Create a free conjoint analysis survey on OpinionX and add a question that tags each participant, so you can see your first segment split on votes from your own customers. If you'd rather have us work through your own split with you first, book a demo.
